AUD declines as US Dollar rises amid shifting Fed policy signals
- The Australian Dollar depreciates as the US Dollar extends its gains for the second successive day.
- RBA’s Bullock warned that elevated unit labor costs and weak productivity could drive inflation above current forecasts.
- Trump announced a 35% tariff rate for goods imported from Canada.
The Australian Dollar (AUD) loses ground against the US Dollar (USD) on Friday, halting its three-day winning streak. However, the AUD/USD pair faced challenges following the introduction of new tariff actions by US President Donald Trump. President Trump announced on Thursday a 35% tariff rate for goods imported from Canada, effective August 1. He further stated that the European Union (EU) would receive a letter notifying them of new tariff rates “today or tomorrow.”
The AUD receives support after the Reserve Bank of Australia (RBA) surprisingly decided to maintain the Official Cash Rate (OCR) at 3.85% earlier this week. RBA Governor Michele Bullock stated that inflation risks persist, driven by the elevated unit labor costs and weak productivity, which could push inflation above forecasts. Moreover, RBA Deputy Governor Andrew Hauser mentioned that the global economy is facing uncertainty. Hauser also stated that tariff effects on the global economy are profound and are likely to dampen growth.
Australian Dollar declines as US Dollar continues to gain ground
- The US Dollar Index (DXY), which measures the value of the US Dollar (USD) against six major currencies, extends its gains for the second successive day and is trading at around 97.80 at the time of writing. The Greenback extends its gains due to evolving monetary policy signals by the Federal Reserve’s (Fed) officials.
- Federal Reserve Bank of Chicago President Austan Goolsbee said late Thursday that he does not support the arguments that the US central bank should cut rates to make government debt cheaper, the mandate is on jobs and prices.
- President Trump unveiled a new wave of tariff demand letters on Wednesday, sparking concerns about a renewed global trade war. The flurry of letters and additional tariff threats marked the latest turn in a fast-moving trade agenda that has fueled market volatility.
- The Federal Open Market Committee (FOMC) Minutes from the June 17–18 meeting, released on Wednesday, indicated that policymakers largely maintained a wait-and-see stance regarding future interest rate decisions.
- President Trump said on Tuesday that he will announce a 50% tariff on imported copper and indicated that steeper sector-specific levies are forthcoming. Trump also said he would soon announce tariffs “at a very, very high rate, like 200%,” on pharmaceutical imports.
- US Treasury Secretary Scott Bessent said that the United States has already received around $100 billion in tariff revenue this year and could see that total surge to $300 billion by the end of 2025, driven by US President Donald Trump’s escalating trade measures.
- The White House announced late Monday that US President Donald Trump has signed an executive order delaying the implementation of new tariffs from July to August 1, per Bloomberg. Trump renewed his threat of a 25% tax on imports from Japan and South Korea and shared a batch of other letters to world leaders warning of levies from 1 August. Trump also imposed 25% rates on Malaysia, Kazakhstan, and Tunisia, while South Africa would see a 30% tariff, and Laos and Myanmar would face a 40% levy. Other nations hit with levies included Indonesia with a 32% rate, Bangladesh with 35%, and Thailand and Cambodia with duties of 36%.
- Trump posted on social media on Monday that “Any Country aligning itself with the Anti-American policies of BRICS, will be charged an ADDITIONAL 10% Tariff. There will be no exceptions to this policy.”
- China’s Consumer Price Index climbed 0.1% year-over-year in June after declining 0.1% in May. The market consensus was 0% in the reported period. Meanwhile, the monthly CPI decreased by 0.1% against the expected 0% reading. Moreover, Producer Price Index (PPI) fell 3.6% YoY in June, following a 3.3% decline in May. The data came in lower than the market consensus of 3.2%. Any change in the Chinese economy could impact the AUD as China and Australia are close trading partners.
- The Financial Times reported that China is increasingly rerouting its exports through Southeast Asia to circumvent US tariffs imposed by the Trump administration. Direct shipments from China to the US fell by 43% in May, while China’s overall exports climbed by 4.8%. This shift was marked by a 15% surge in exports to Southeast Asia and a 12% increase to the European Union (EU). However, the US trade agreement with Vietnam now includes a 40% tariff on transshipped goods to curb such practices.
- The Reuters survey poll showed that 30 analysts forecasted the Reserve Bank of Australia to cut the cash rate by 25 basis points to 3.60% in August. Australia’s four major banks, ANZ, CBA, NAB, and Westpac, also support the rate cut.
- Australian Treasurer Jim Chalmers said that the Reserve Bank of Australia’s decision to hold rates was neither the outcome millions of Australians had hoped for nor what markets had anticipated. Chalmers added that the central bank has signaled a clear direction on inflation and interest rates moving forward.
Australian Dollar reaches fresh eight-month highs near 0.6600
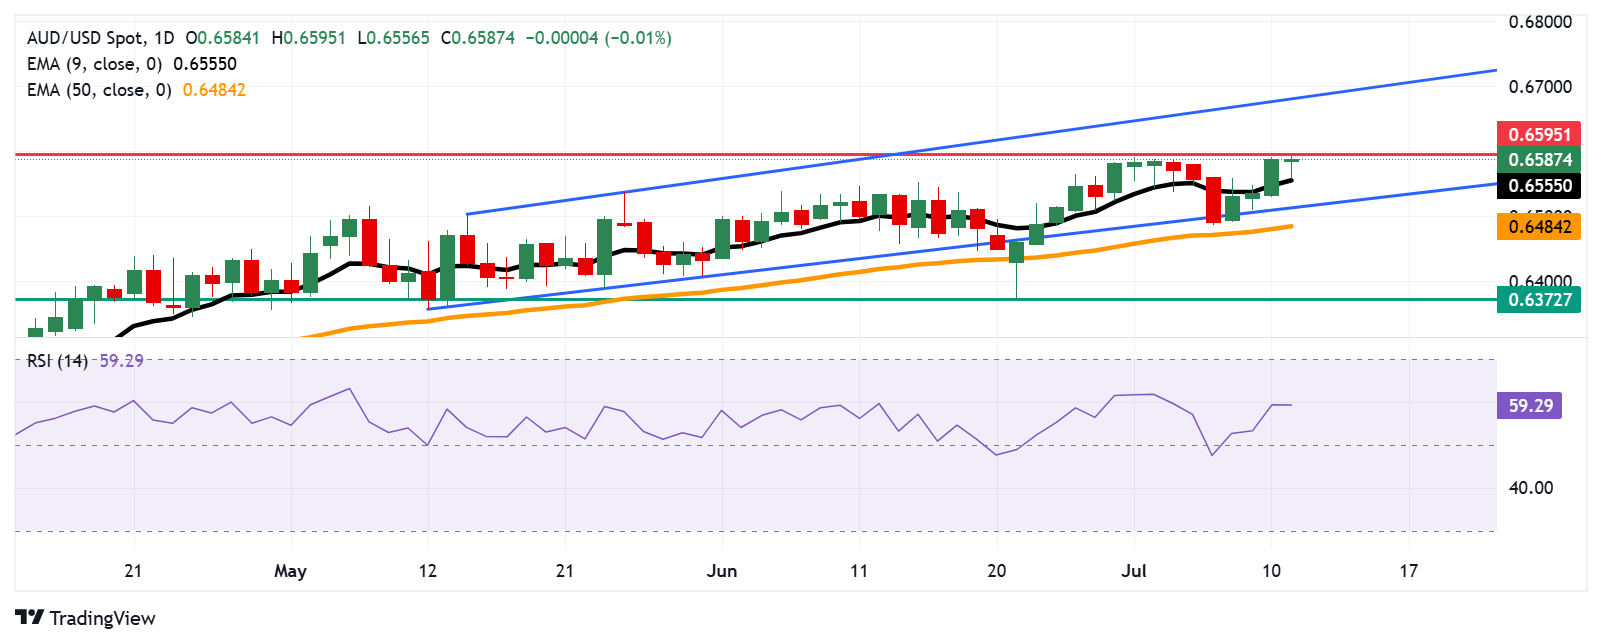
AUD/USD is trading around 0.6590 on Friday. The daily chart’s technical analysis indicated a persistent bullish sentiment as the pair remains within the ascending channel pattern. The 14-day Relative Strength Index (RSI) is positioned above the 50 mark, strengthening the bullish bias. Additionally, the pair has moved slightly above the nine-day Exponential Moving Average (EMA), indicating that short-term price momentum is strengthening.
On the upside, the AUD/USD pair has reached its fresh eight-month high of 0.6595 on Friday. A break above this level could strengthen the bullish bias and open the doors for the pair to explore the region around the upper boundary of the ascending channel around 0.6680.
The AUD/USD pair may test its initial support at the nine-day EMA of 0.6555. A successful breach below this level would weaken the market sentiment and put downward pressure on the pair to test the ascending channel’s lower boundary around 0.6520, followed by the 50-day EMA at 0.6484.
AUD/USD: Daily Chart
Australian Dollar PRICE Today
The table below shows the percentage change of Australian Dollar (AUD) against listed major currencies today. Australian Dollar was the weakest against the Swiss Franc.
| USD | EUR | GBP | JPY | CAD | AUD | NZD | CHF | |
|---|---|---|---|---|---|---|---|---|
| USD | 0.18% | 0.17% | 0.53% | 0.29% | 0.06% | 0.31% | 0.03% | |
| EUR | -0.18% | -0.04% | 0.34% | 0.10% | -0.04% | 0.11% | -0.15% | |
| GBP | -0.17% | 0.04% | 0.40% | 0.12% | -0.01% | 0.19% | -0.15% | |
| JPY | -0.53% | -0.34% | -0.40% | -0.24% | -0.48% | -0.25% | -0.53% | |
| CAD | -0.29% | -0.10% | -0.12% | 0.24% | -0.17% | 0.00% | -0.26% | |
| AUD | -0.06% | 0.04% | 0.00% | 0.48% | 0.17% | 0.31% | -0.10% | |
| NZD | -0.31% | -0.11% | -0.19% | 0.25% | -0.00% | -0.31% | -0.32% | |
| CHF | -0.03% | 0.15% | 0.15% | 0.53% | 0.26% | 0.10% | 0.32% |
The heat map shows percentage changes of major currencies against each other. The base currency is picked from the left column, while the quote currency is picked from the top row. For example, if you pick the Australian Dollar from the left column and move along the horizontal line to the US Dollar, the percentage change displayed in the box will represent AUD (base)/USD (quote).


