AUD/USD retreats as geopolitical risks increase, limiting US Dollar weakness
- The AUD/USD falls on rising geopolitical risks and a lack of fresh fundamental drivers in Australia.
- The US Dollar gains after Israel attacks Iran’s nuclear facilities, impacting demand for the Australian Dollar.
- The pair continues to be influenced by monetary policy expectations of both the Reserve Bank of Australia and the Federal Reserve.
The Australian Dollar (AUD) is weakening against the US Dollar (USD) on Friday, with price action being guided by a combination of factors.
The two primary drivers of the recent move have been increasing geopolitical risks and interest rate expectations, which are likely to continue influencing near-term price movements.
At the time of writing, AUD/USD is trading below 0.6500, with intraday losses of 0.60%.
Market sentiment remains fragile following the escalation of tensions in the Middle East. Reports overnight say that Israel launched targeted strikes on Iranian nuclear and military sites, killing several senior officials.
This has led to heightened fears of a broader regional conflict. It has also underpinned safe-haven demand for the US Dollar, limiting risk appetite and pressuring high-beta currencies, such as the Australian Dollar.
On the data front, the University of Michigan’s preliminary Consumer Sentiment Index for June showed an improvement in household confidence.
However, both one-year and five-year Consumer Inflation Expectations moved slightly lower, reinforcing this week’s softer-than-expected US CPI and PPI prints.
Looking ahead, focus turns to key Chinese data due Monday, including Industrial Production and Retail Sales for May, which could heavily influence AUD/USD due to Australia’s strong trade ties with China.
AUD/USD technical analysis: Bearish bias below 0.6500
AUD/USD is trading below 0.6500 on Friday, pulling back after stalling at resistance around 0.6535.
Price remains confined within a rising wedge pattern after failing to break through prior wedge resistance, with 0.6535 now acting as a key upside barrier.
The 61.8% Fibonacci retracement level of the September–April decline at 0.6549 adds further resistance just above.
The pattern reflects fading bullish momentum and the risk of a breakdown if support levels fail to hold. Immediate support is located at the 20-day Simple Moving Average (SMA) near 0.6473, while stronger support aligns with the 200-day SMA and the 50% Fibonacci level at 0.6428.
AUD/USD daily chart
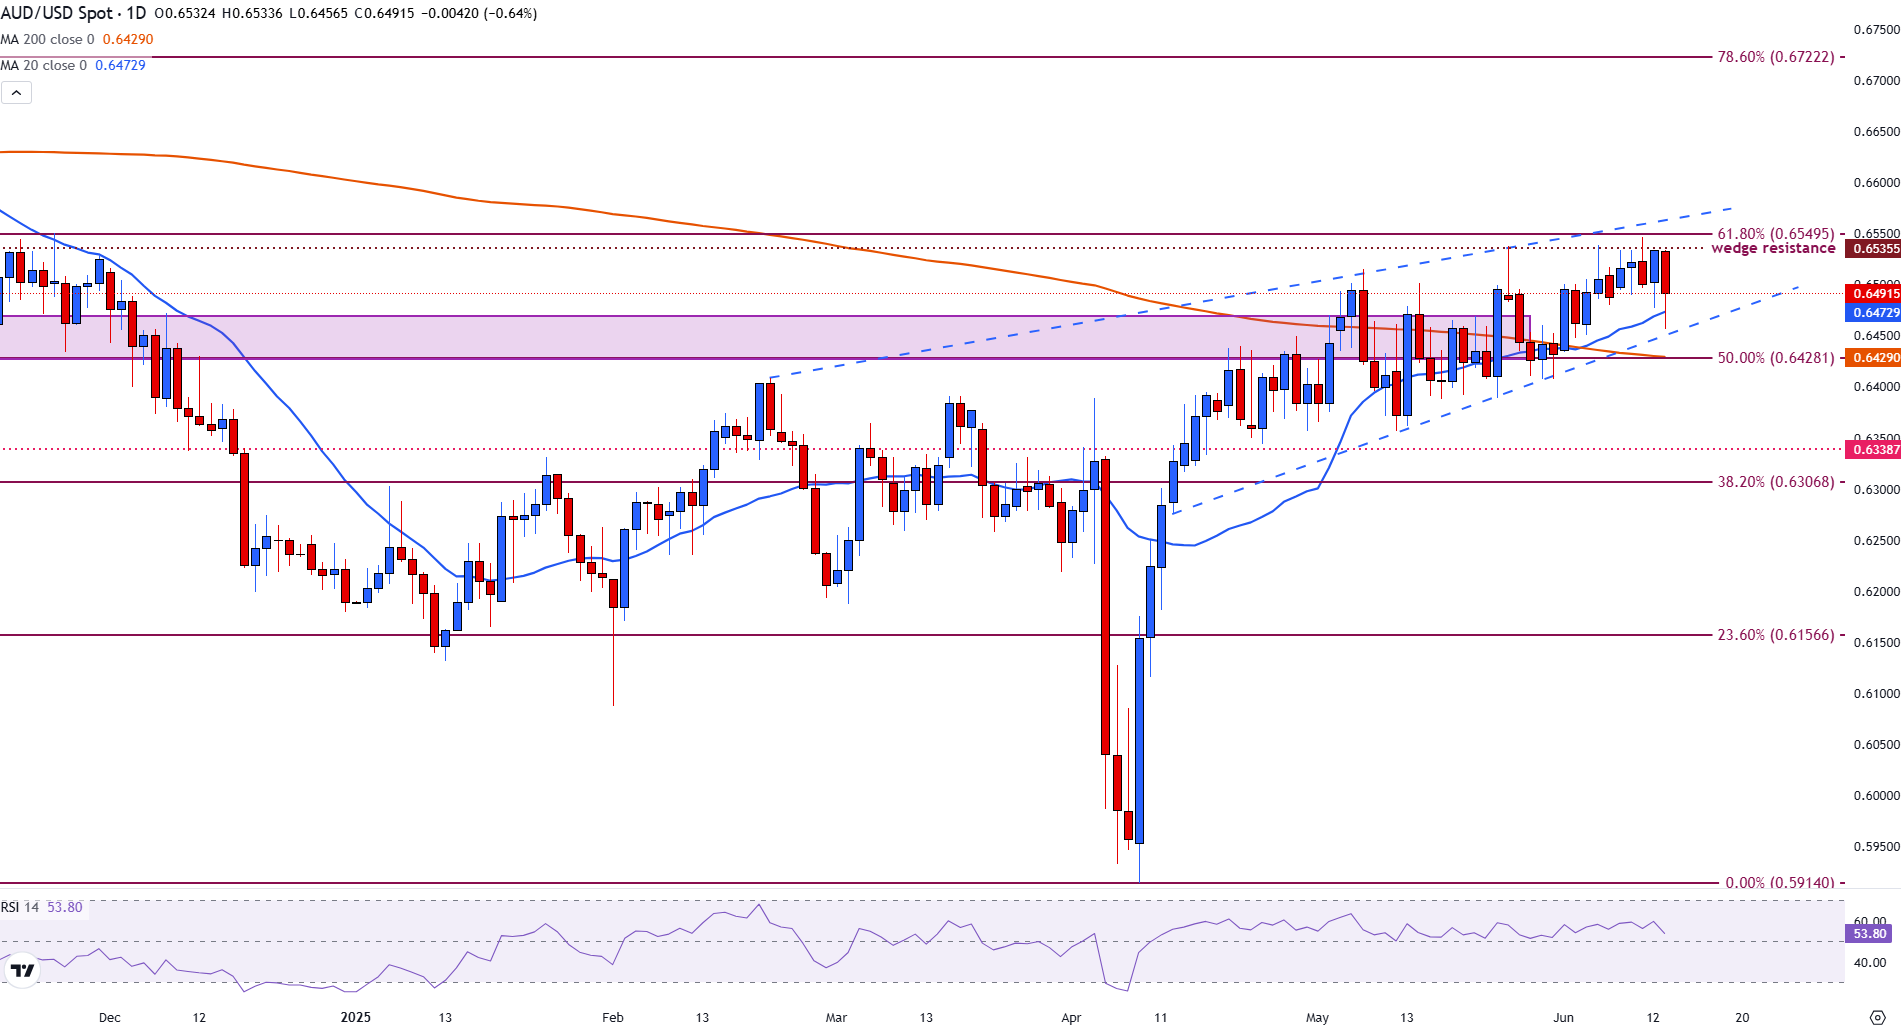
A close below this zone would confirm a break from the wedge and expose downside targets at 0.6338 and 0.6306.
On the upside, a breakout above 0.6535 would shift focus toward 0.6550 and the broader recovery target at 0.6722. The Relative Strength Index (RSI) is near 54, indicating a potential shift in trend as bullish momentum fades.


