Australian Dollar declines as US Dollar remains stronger ahead of ISM Services PMI
- Australian Dollar struggles despite stronger-than-expected Trade Balance data.
- Australia’s Trade Balance widened to 7,310 million MoM in July, surpassing the expectations of 4,920 million.
- The US Dollar inches higher ahead of the release of labor data and ISM Services PMI on Thursday.
The Australian Dollar (AUD) depreciates despite the release of solid trade balance data on Thursday. However, the AUD/USD pair maintained its position as the US Dollar (USD) struggled, as weaker-than-expected July JOLTS Job Openings prompted investors to consider the implications for Federal Reserve decisions. Traders will likely observe the weekly Initial Jobless Claims, the ADP Employment Change, and the ISM Services Purchasing Managers Index (PMI) due later in the North American session.
Australia’s Trade Balance increased to 7,310 million month-over-month in July, from 5,366 million (revised from 5,365 million) the prior month. The trade surplus widened against the expected decline to 4,920 million. The Australian Bureau of Statistics (ABS) further revealed that Australia’s Exports rose by 3.3% MoM in July from 6.3% (revised from 6.0%) seen prior. Meanwhile, Imports declined by 1.3% MoM in July, compared to a fall of 1.5% (revised from -3.1%) seen in June.
The US Dollar Index (DXY), which measures the value of the US Dollar against six major currencies, is holding ground and trading around 98.20 at the time of writing. In the previous session, the Greenback slipped as JOLTS data showed July job openings declined to 7.18 million from 7.35 million, marking the weakest level since September 2024 and missing forecasts of 7.4 million.
The CME FedWatch tool indicates a pricing in more than 97% of a 25-basis-point (bps) rate cut by the Fed at the September policy meeting, up from 92% a day ago. Traders are awaiting labor market data this week that could shape the US Federal Reserve’s (Fed) policy decision in September. Economists project US Nonfarm Payrolls to add about 75,000 jobs in August, while the Unemployment Rate is seen at 4.3%.
Australian Dollar struggles despite easing bets of RBA rate cuts
- The Australian Bureau of Statistics reported on Wednesday that Gross Domestic Product (GDP) rose 0.6% quarter-over-quarter in Q2, following the 0.3% growth in Q1 and surpassing the expectations of 0.5% expansion. Meanwhile, the annual Q2 GDP grew by 1.8%, compared with the 1.4% growth in Q1, and was above the consensus of a 1.6% increase.
- Robust GDP figures eased expectations of additional RBA rate cuts, with swaps now assigning nearly a 90% probability that the central bank will keep policy unchanged in late September.
- Australia’s Monthly Consumer Price Index rose 2.8% year-over-year in July, beating both the previous 1.9% increase and the 2.3% forecast. The hotter inflation in July dampened the likelihood of a Reserve Bank of Australia (RBA) rate cut anytime soon, continuing to provide support for the Australian Dollar.
- China’s Caixin Services Purchasing Managers’ Index (PMI) unexpectedly rose to 53.0 in August from 52.6 in July. The data came in above the market forecast of 52.5 in the reported period. Caixin Manufacturing PMI jumped to 50.5 in August from 49.5 in July. It is worth noting that any change in the Chinese economy could influence AUD as China and Australia are close trading partners.
- Federal Reserve (Fed) Bank of Minneapolis President Neel Kashkari warned again on Wednesday, cautioning that tariffs are pushing the consumer-facing costs of goods higher, resulting in climbing inflation figures. Meanwhile, Atlanta Fed President Raphael Bostic said that high inflation remained the Fed’s main risk, but added that signs of labour market weakness still pointed to a single quarter-point rate cut this year.
- US Treasury Secretary Scott Bessent said on Tuesday that he expects the Supreme Court will approve Trump’s use of a 1977 emergency powers law to slap the tariffs on trading partners, and the administration has a backup plan if it does not. Trump, meanwhile, pledged to seek an “expedited ruling” from the Court.
- Market concerns increased about the Fed’s independence amid uncertainty over the legality of Trump’s dismissal of Fed Governor Lisa Cook, after a court hearing on Friday concluded without a decision on whether to temporarily halt the move.
- US Treasury Secretary Scott Bessent acknowledged on Monday that the Federal Reserve should be politically independent, but offered little clarity on his vague claim that the Fed has “made a lot of mistakes”, outside of not obeying President Trump’s demands for lower interest rates.
- US Personal Consumption Expenditures (PCE) Price Index held steady at 2.6% year-over-year in July, coming in line with the market expectation. The US core PCE Price Index, which excludes volatile food and energy prices, rose 2.9% YoY in July, as expected, following June’s increase of 2.8%. On a monthly basis, the core PCE Price Index rose 0.2% and 0.3%, respectively.
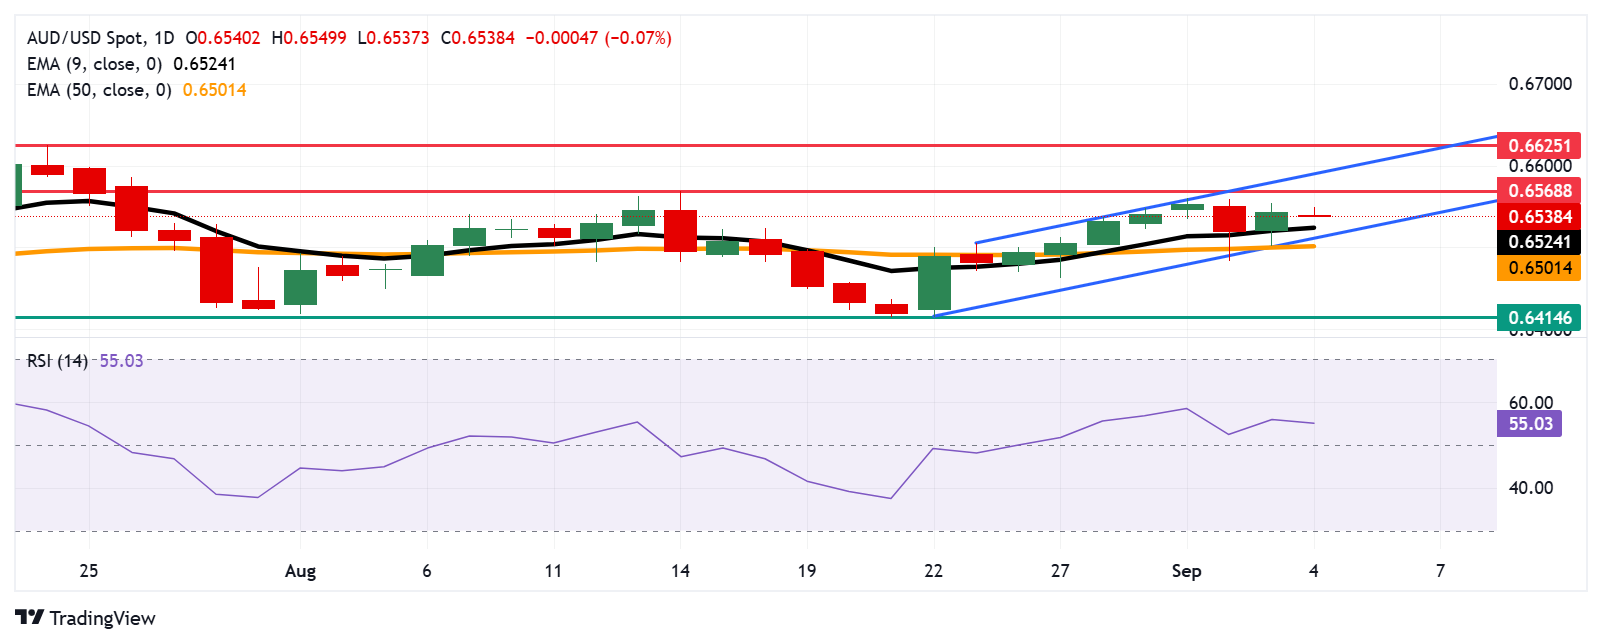
Australian Dollar moves below 0.6550 toward nine-day EMA support
AUD/USD is trading around 0.6530 on Thursday. The technical analysis of the daily chart shows the pair moves upwards within an ascending channel pattern, suggesting a prevailing bullish bias. Additionally, the pair is positioned above the nine-day Exponential Moving Average (EMA), indicating short-term price momentum is stronger.
On the upside, the AUD/USD pair may target the five-week high of 0.6568, reached on August 14, followed by the upper boundary of the ascending channel around 0.6590. A break above the channel would strengthen the bullish bias and support the pair to test the nine-month high of 0.6625, which was recorded on July 24.
The primary support lies at the nine-day EMA of 0.6524, followed by the ascending channel’s lower boundary around 0.6510 and the 50-day EMA at 0.6501. A break below this crucial support zone would cause the emergence of the bearish bias and prompt the AUD/USD pair to test its three-month low of 0.6414, recorded on August 21.
AUD/USD: Daily Chart
Australian Dollar Price Today
The table below shows the percentage change of Australian Dollar (AUD) against listed major currencies today. Australian Dollar was the weakest against the Swiss Franc.
| USD | EUR | GBP | JPY | CAD | AUD | NZD | CHF | |
|---|---|---|---|---|---|---|---|---|
| USD | 0.06% | 0.10% | 0.07% | 0.11% | 0.22% | 0.03% | 0.05% | |
| EUR | -0.06% | 0.06% | 0.00% | 0.05% | 0.22% | -0.03% | -0.05% | |
| GBP | -0.10% | -0.06% | 0.02% | -0.01% | 0.15% | -0.07% | -0.11% | |
| JPY | -0.07% | 0.00% | -0.02% | 0.06% | 0.09% | 0.00% | -0.00% | |
| CAD | -0.11% | -0.05% | 0.00% | -0.06% | 0.08% | -0.07% | -0.10% | |
| AUD | -0.22% | -0.22% | -0.15% | -0.09% | -0.08% | -0.24% | -0.26% | |
| NZD | -0.03% | 0.03% | 0.07% | -0.01% | 0.07% | 0.24% | 0.01% | |
| CHF | -0.05% | 0.05% | 0.11% | 0.00% | 0.10% | 0.26% | -0.01% |
The heat map shows percentage changes of major currencies against each other. The base currency is picked from the left column, while the quote currency is picked from the top row. For example, if you pick the Australian Dollar from the left column and move along the horizontal line to the US Dollar, the percentage change displayed in the box will represent AUD (base)/USD (quote).


