Bitcoin, Ethereum, Ripple: BTC teases all-time high, ETH and XRP gear up for breakout
- Bitcoin price hovers around $108,500 on Monday, inches shy of its all-time high.
- Ethereum closes above its key resistance at $2,461, hinting at a rally ahead.
- XRP nears its key resistance at $2.23, a breakout could trigger an upward momentum.
Bitcoin (BTC) price is hovering around $108,500 at the time of writing on Monday, just 3% shy of its all-time highs. Ethereum (ETH) closes above its key resistance level, signaling a potential for an extended rally. Meanwhile, Ripple (XRP) nears its critical level; a successful breakout could fuel upward momentum in the near term.
Bitcoin is shy of its record highs
Bitcoin price rose sharply by 7.32% last week, closing above $108,000. At the time of writing on Monday, it hovers at around $108,500.
If BTC continues its ongoing rally, it could extend toward the May 22 all-time high at $111,980. A successful close above this level could extend additional gains to set a new all-time high at $120,000.
The Relative Strength Index (RSI) on the daily chart reads 59, above its neutral level of 50, indicating bullish momentum. The Moving Average Convergence Divergence (MACD) on the daily chart also displayed a bullish crossover on Thursday, providing a buy signal and indicating an upward trend.
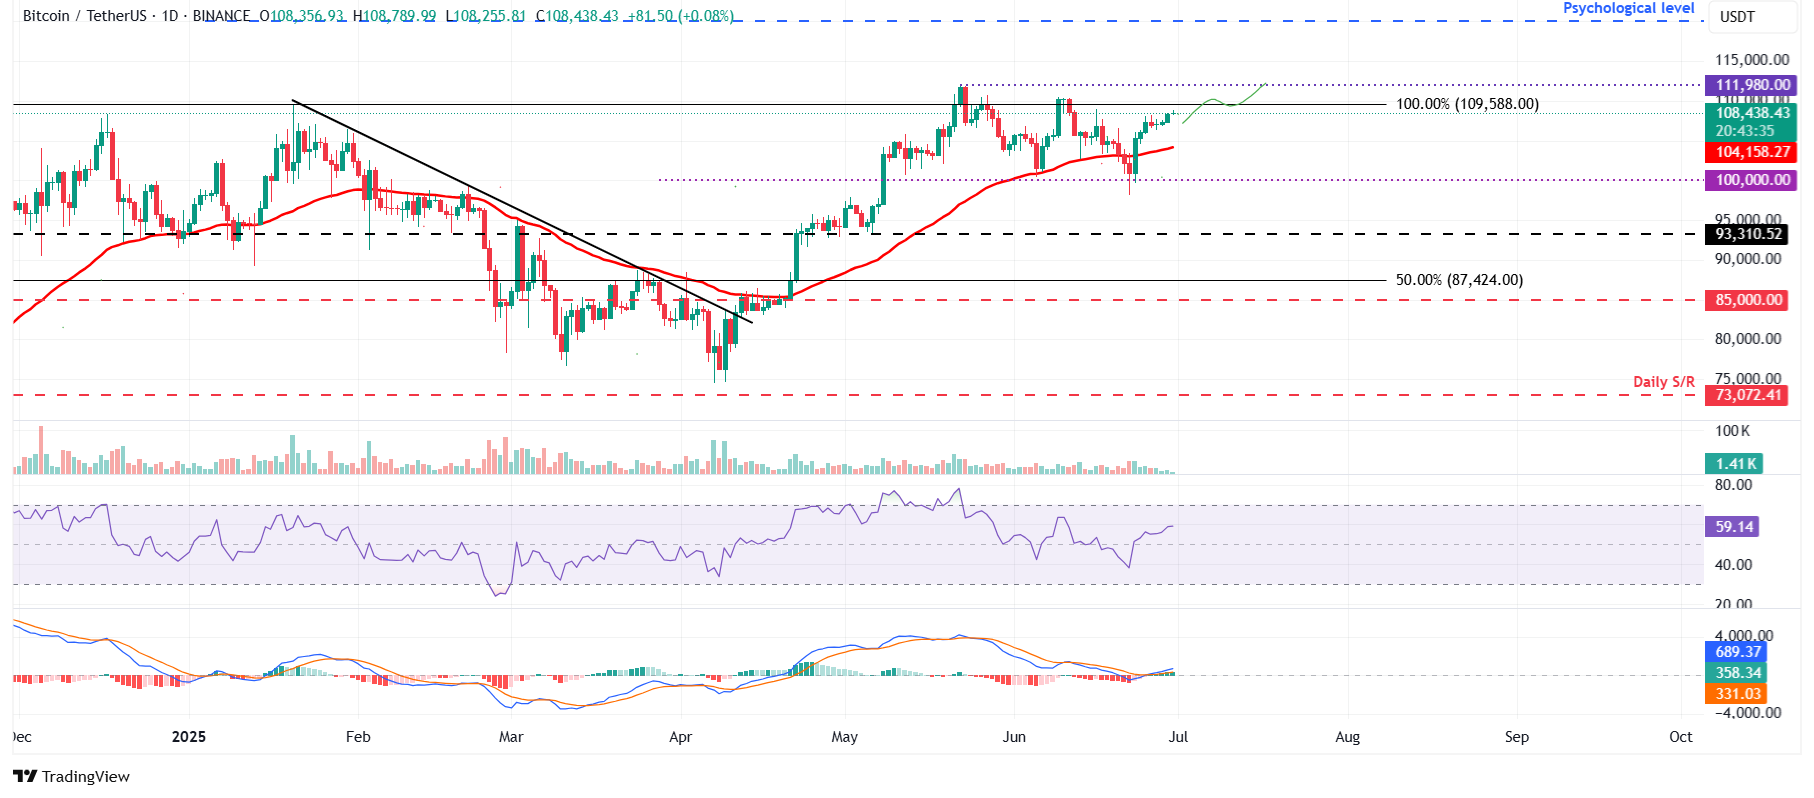
BTC/USDT daily chart
However, if BTC faces a correction, it could extend the decline to find support around the 50-day Exponential Moving Average (EMA) at $104,158.
Ethereum is set for an upleg as it closes above its key resistance
Ethereum price broke above its 50-day EMA at $2,429 on Tuesday and found support around this level, subsequently breaking above the key resistance at $2,461 on Sunday. At the time of writing on Monday, it trades around $2,498.
If ETH finds support around the $2,461 level, it could extend the rally toward its next daily resistance level at $2,724.
The RSI on the daily chart reads 52, above its neutral level of 50, indicating that bullish momentum is gaining traction. The MACD is hinting at a bullish crossover (the MACD line is close to crossing above the signal line), which, if completed, would give a buy signal.
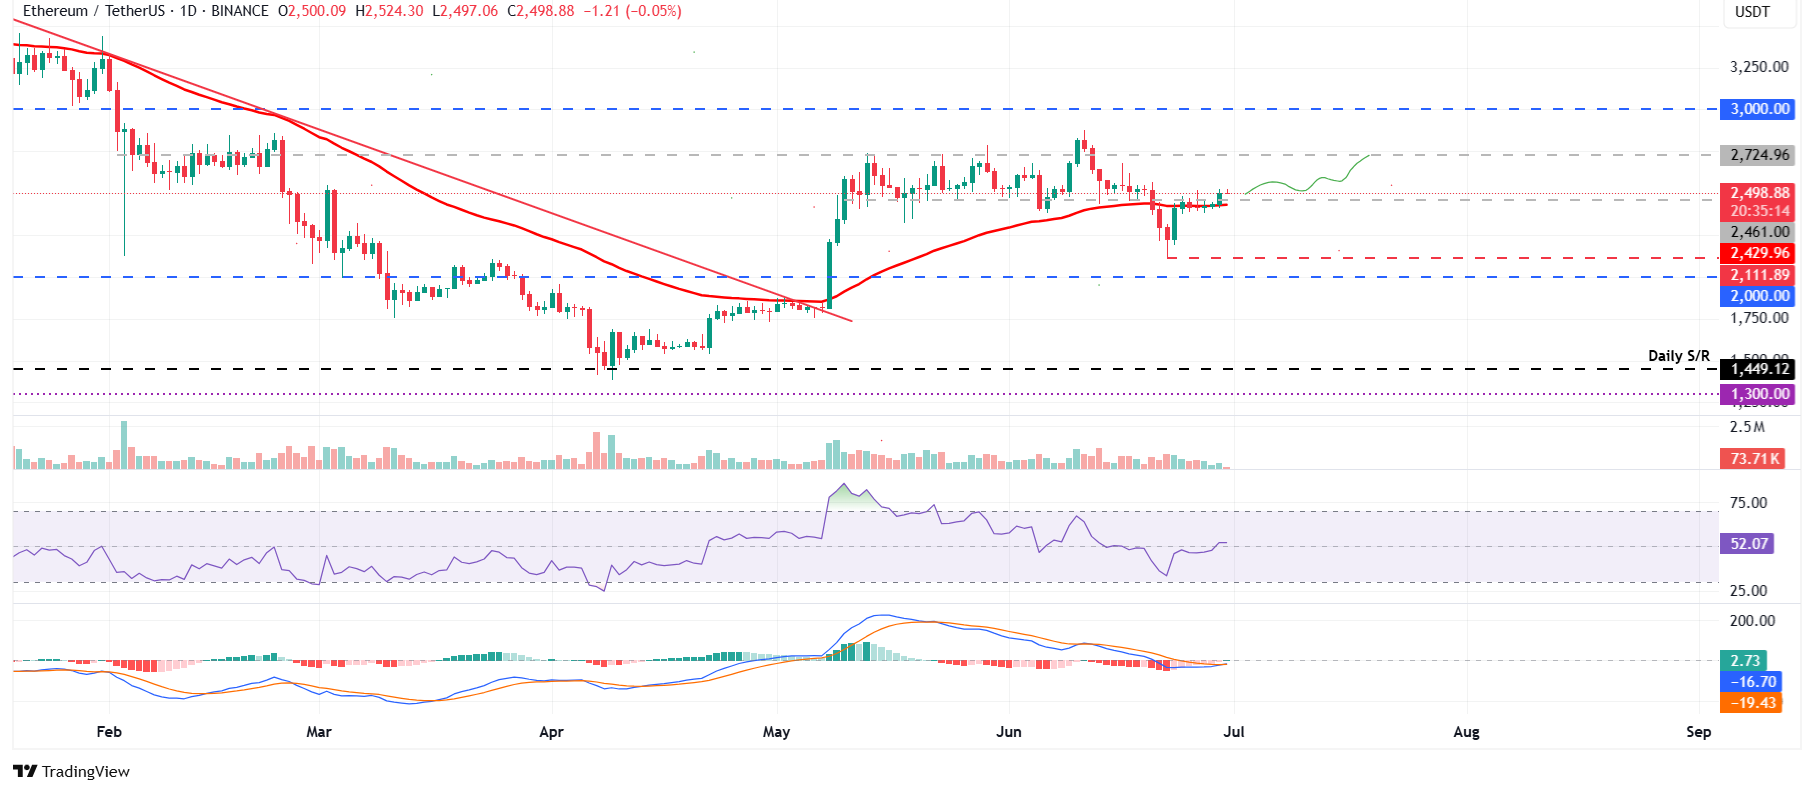
ETH/USDT daily chart
On the other hand, if ETH closes below the 2,461 level, it could extend the decline to find support around its 50-day EMA at $2,429.
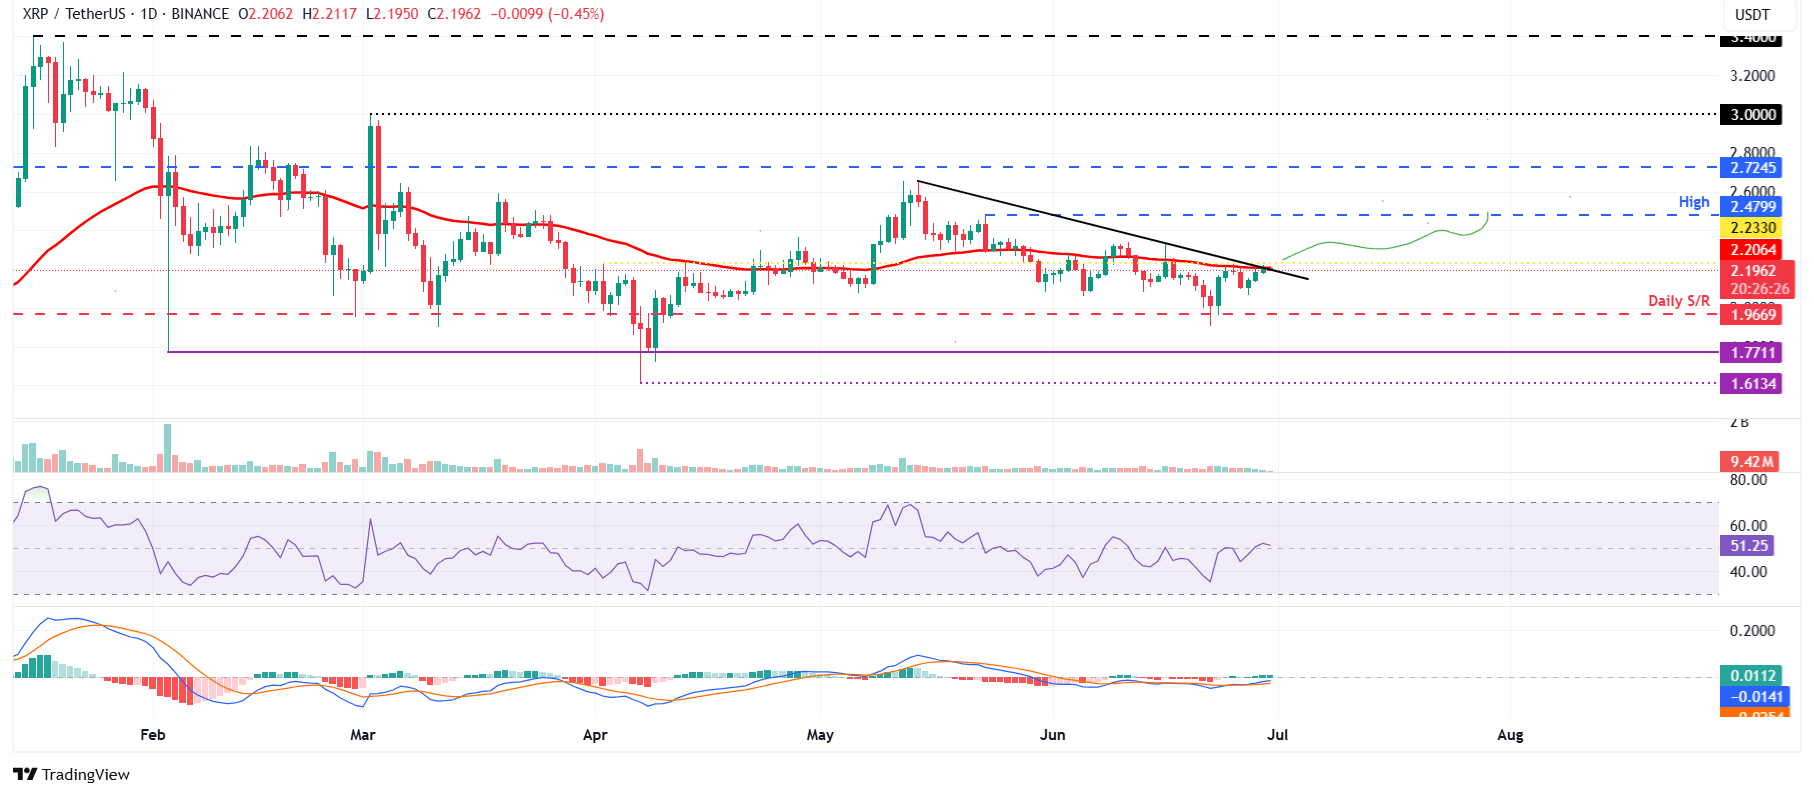
XRP is on the verge of a bullish breakout
Ripple price found support around its daily level of $1.96 last week and rallied by nearly 9%. At the time of writing on Monday, it is approaching its key resistance at $2.23.
If XRP breaks and closes above its daily resistance at $2.23, it could extend the rally toward its May 23 high of $2.47.
The RSI on the daily chart is approaching its neutral level of 50, indicating a fading bearish momentum. For the bullish momentum to be sustained, the RSI must move above its neutral level. The MACD indicator also displayed a bullish crossover on Friday, providing a buy signal and indicating an upward trend.
XRP/USDT daily chart
Conversely, if XRP continues its decline, it could extend the correction to retest its daily support at $1.96.


