Bitcoin Price Forecast: BTC slips below $107,000 even as exchange reserves hit 6-year low
- Bitcoin price edges below $107,000 on Tuesday, extending its mild decline from the previous day.
- Despite the pullback, corporate demand stays firm with fresh BTC buys from Strategy, the Blockchain Group and Metaplanet.
- CryptoQuant data shows that the BTC exchange reserve has dropped to 2.44 million, the lowest level since 2018.
Bitcoin (BTC) slips below $107,000 at the time of writing on Tuesday, continuing a mild pullback from the previous day. Despite the dip, the corporation demand remains bullish, with firms like Strategy, the Blockchain Group and Metaplanet increasing their BTC holdings in their treasury reserves. CryptoQuant data indicate that Bitcoin reserves across all centralized exchanges have declined to just 2.44 million — the lowest level since 2018 — suggesting reduced selling pressure and a potential setup for a longer-term bullish trend.
Bitcoin exchange reserve drops to 2.44 million BTC
CryptoQuant data indicate that the Bitcoin Exchange Reserve – All Exchanges chart below shows the reserve has dropped to 2.44 million as of Monday and has been consistently declining since mid-July 2024.
The BTC reserve at the exchange has reached its lowest level since 2018, indicating lower selling pressure from investors and a reduced supply available for trading.
Apart from reducing the selling pressure, a drop in reserve also signals an increasing scarcity of coins, an occurrence typically associated with bullish market movements.
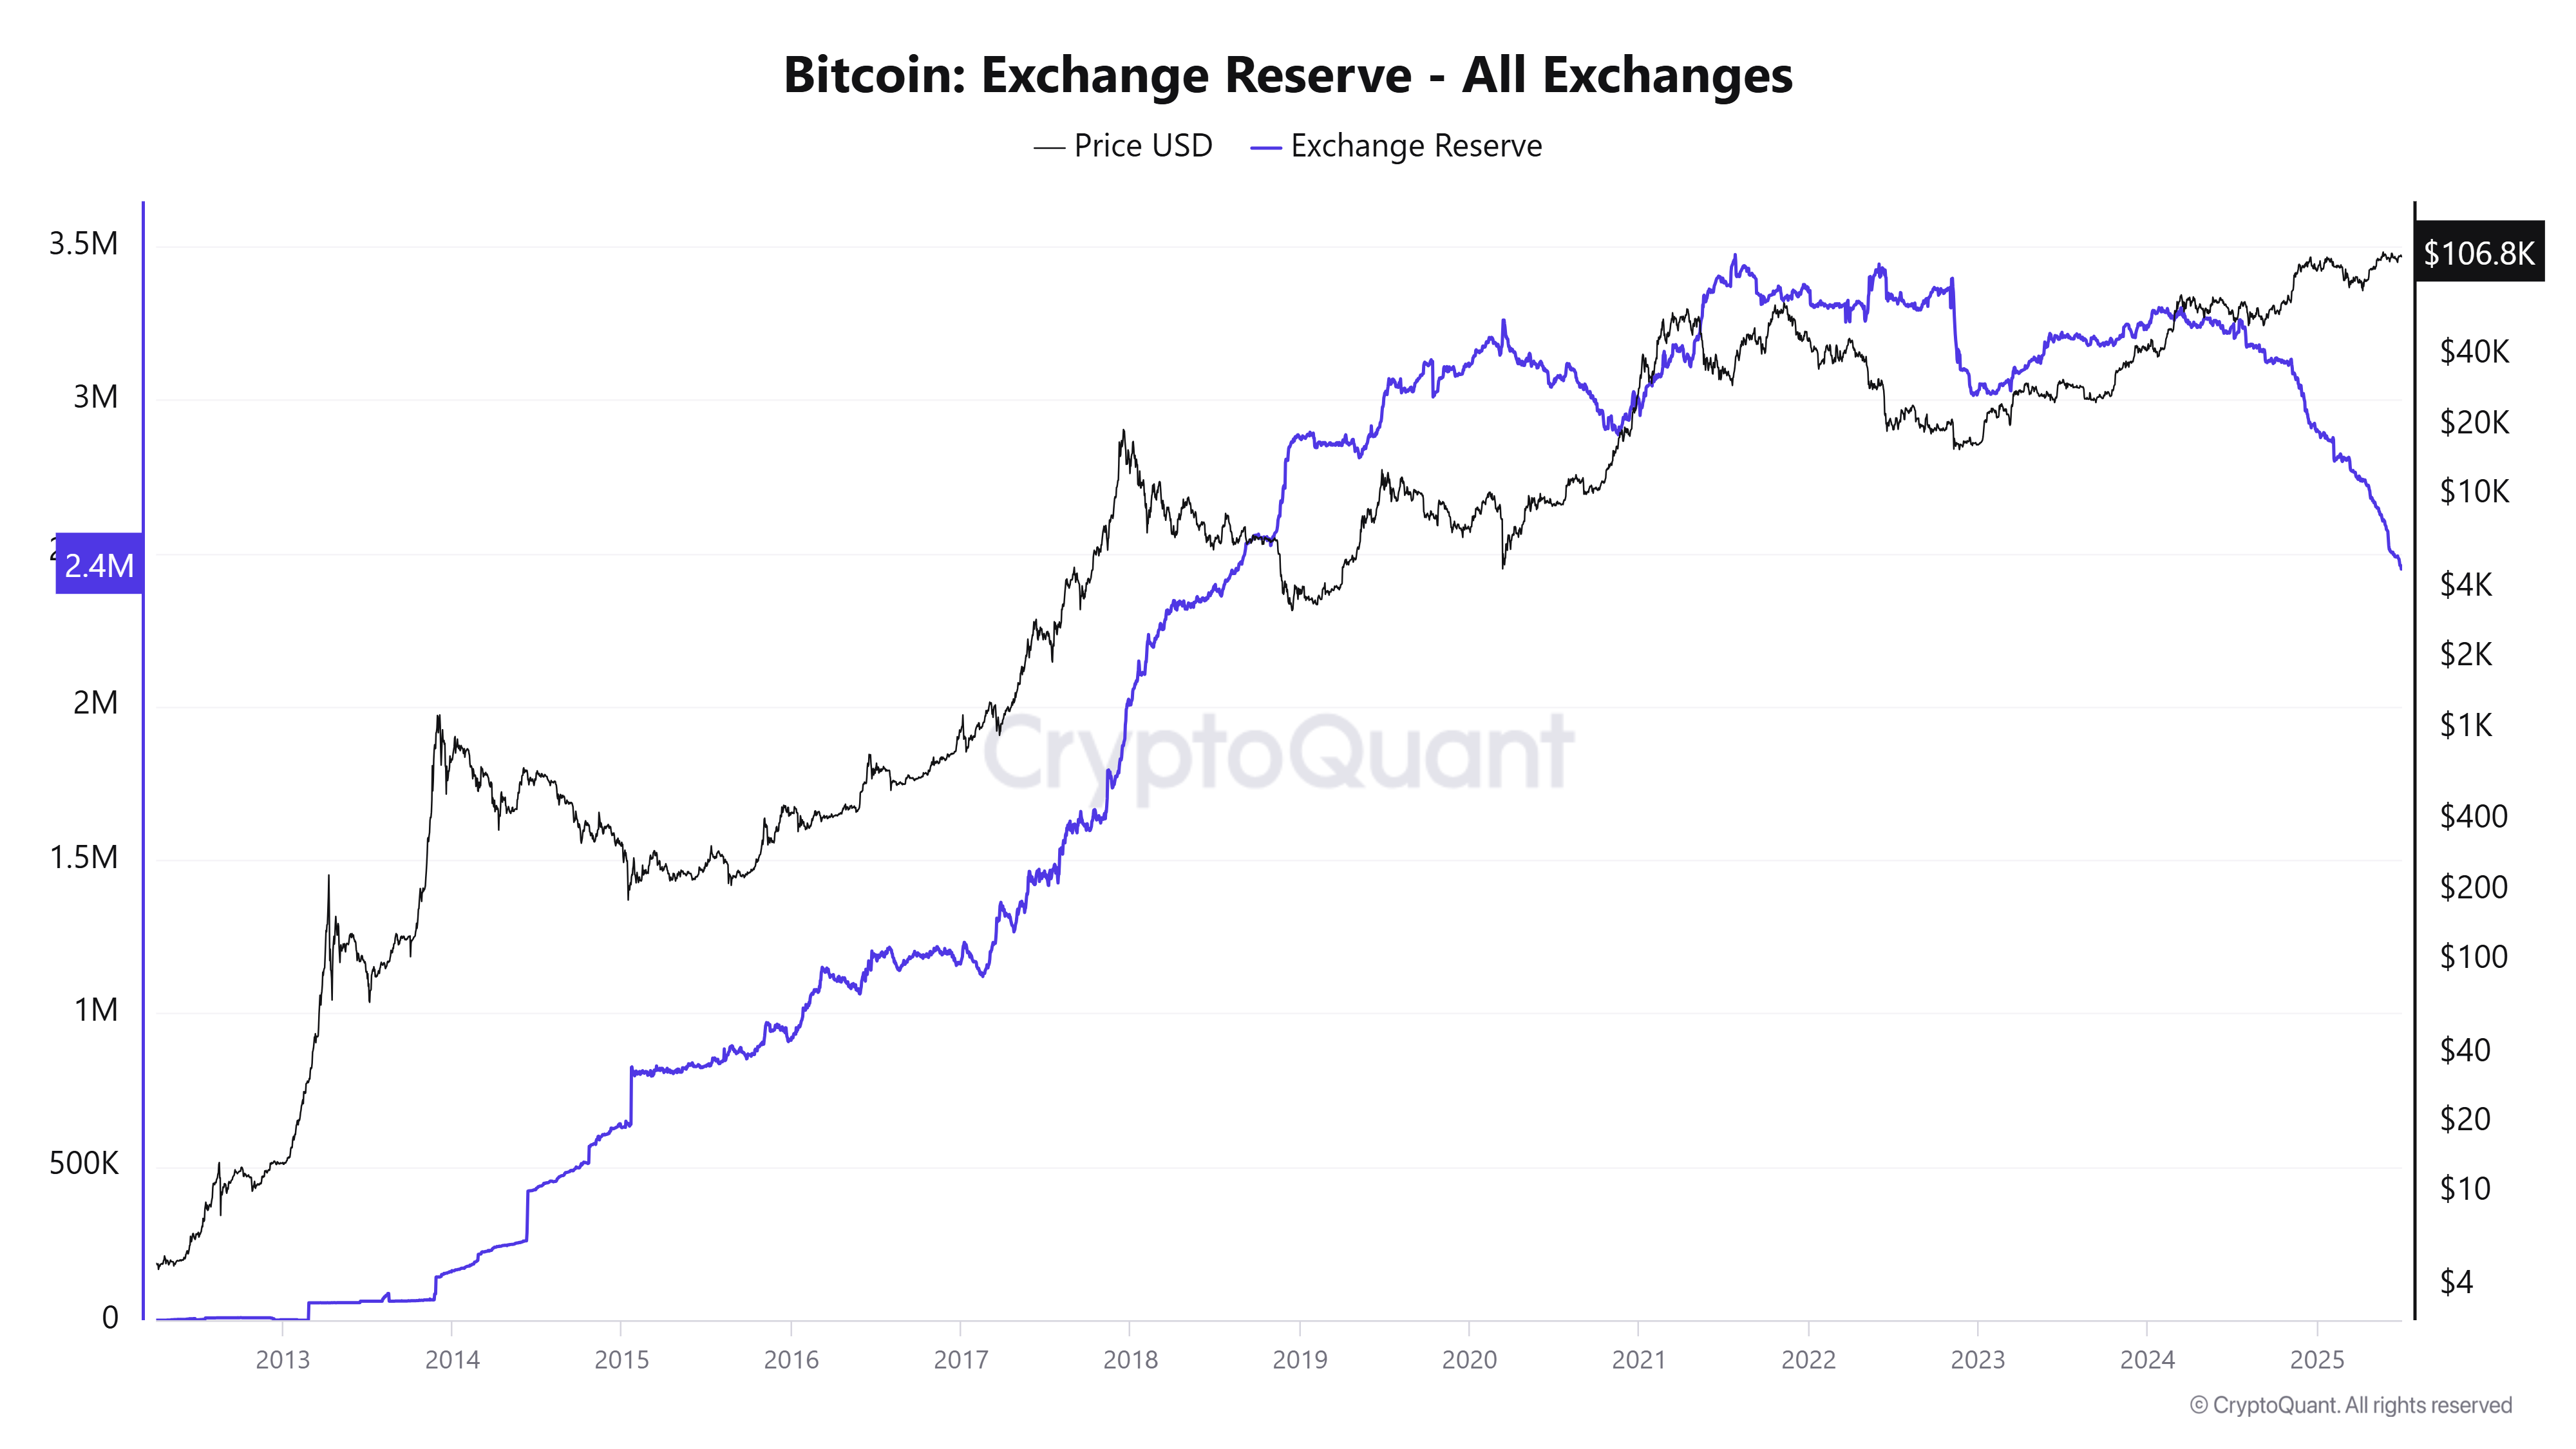
Bitcoin Exchange Reserve– All Exchanges chart. Source: CryptoQuant
Corporate demand continues to strengthen
Corporate demand started the week on a positive note. On Monday, Strategy announced that it has added 4,980 BTC and is holding a total of 597,325 BTC. On the same day, Japanese investment firm Metaplanet announced that it had purchased an additional 1,005 BTC, bringing the total holding to 13,350 BTC. Moreover, the Blockchain Group confirms the acquisition of 60 BTC, and the firm holds a total of 1,788 BTC.

Apart from the corporate demand, institutional demand also remained robust. According to SoSoValue data, the spot BTC ETFs recorded an inflow of $102.14 million on Monday, continuing its 15-day streak of inflows since June 9. If the inflow continues and intensifies, BTC could reach or even surpass its all-time highs.
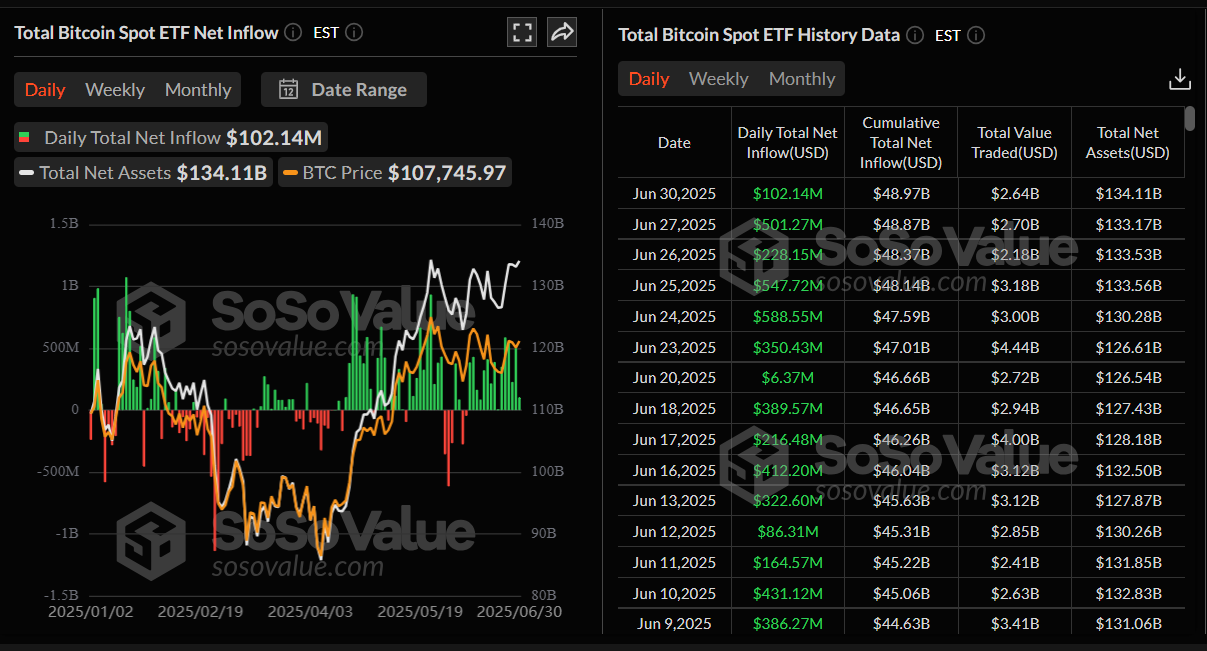
Total Bitcoin spot ETF net inflow daily chart. Source: SoSoValue
Bitcoin’s Q3 could remain in a range-bound period, says Bitfinex analyst
Bitfinex Alpha’s report on Monday highlighted that historical Q3 seasonality suggests a phase of lower volatility and muted directional movement. On average, Q3 has been Bitcoin’s weakest quarter, with historically low returns of just 6%, and price action tends to remain range-bound during this period.
Bitfinex analyst reports, “For now, Bitcoin is in a waiting game.”
The analyst continued saying that the structural positioning remains intact, and there’s no major breakdown risk as long as $94,000 and $99,000 hold. However, for new all-time highs to be reclaimed, a catalyst — either in the form of macroeconomic relief, strong ETF flow momentum or a breakout in global liquidity — will be necessary.
Bitcoin’s derivative data hints at a short-term correction. According to Coinglass, the long-to-short ratio has slipped below one, reading 0.90 on Tuesday. The ratio is nearing its lowest level in over a month, indicating bearish bets are increasing among traders.
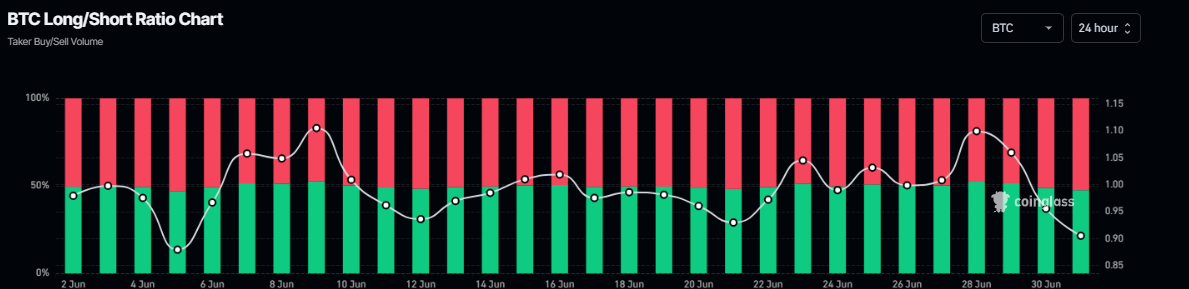
Bitcoin long-to-short ratio chart. Source: Coinglass
Bitcoin Price Forecast: BTC faces a slight pullback
Bitcoin price rose sharply by 7.32% last week, closing above $108,000. This Monday, it faced a slight decline of 1.12%. At the time of writing on Tuesday, it continues to face a mild pullback, trading below $107,000.
If the 50-day Exponential Moving Average (EMA) level at $104,219 remains strong as support, BTC could extend its rally toward the May 22 all-time high at $111,980.
The Relative Strength Index (RSI) on the daily chart reads 53, hovering above its neutral level of 50, indicating bulls are still in control of the momentum. However, for the bullish momentum to be sustained, the RSI must point upward and move above 60. The Moving Average Convergence Divergence (MACD) on the daily chart also displayed a bullish crossover on Thursday, providing a buy signal and indicating an upward trend.
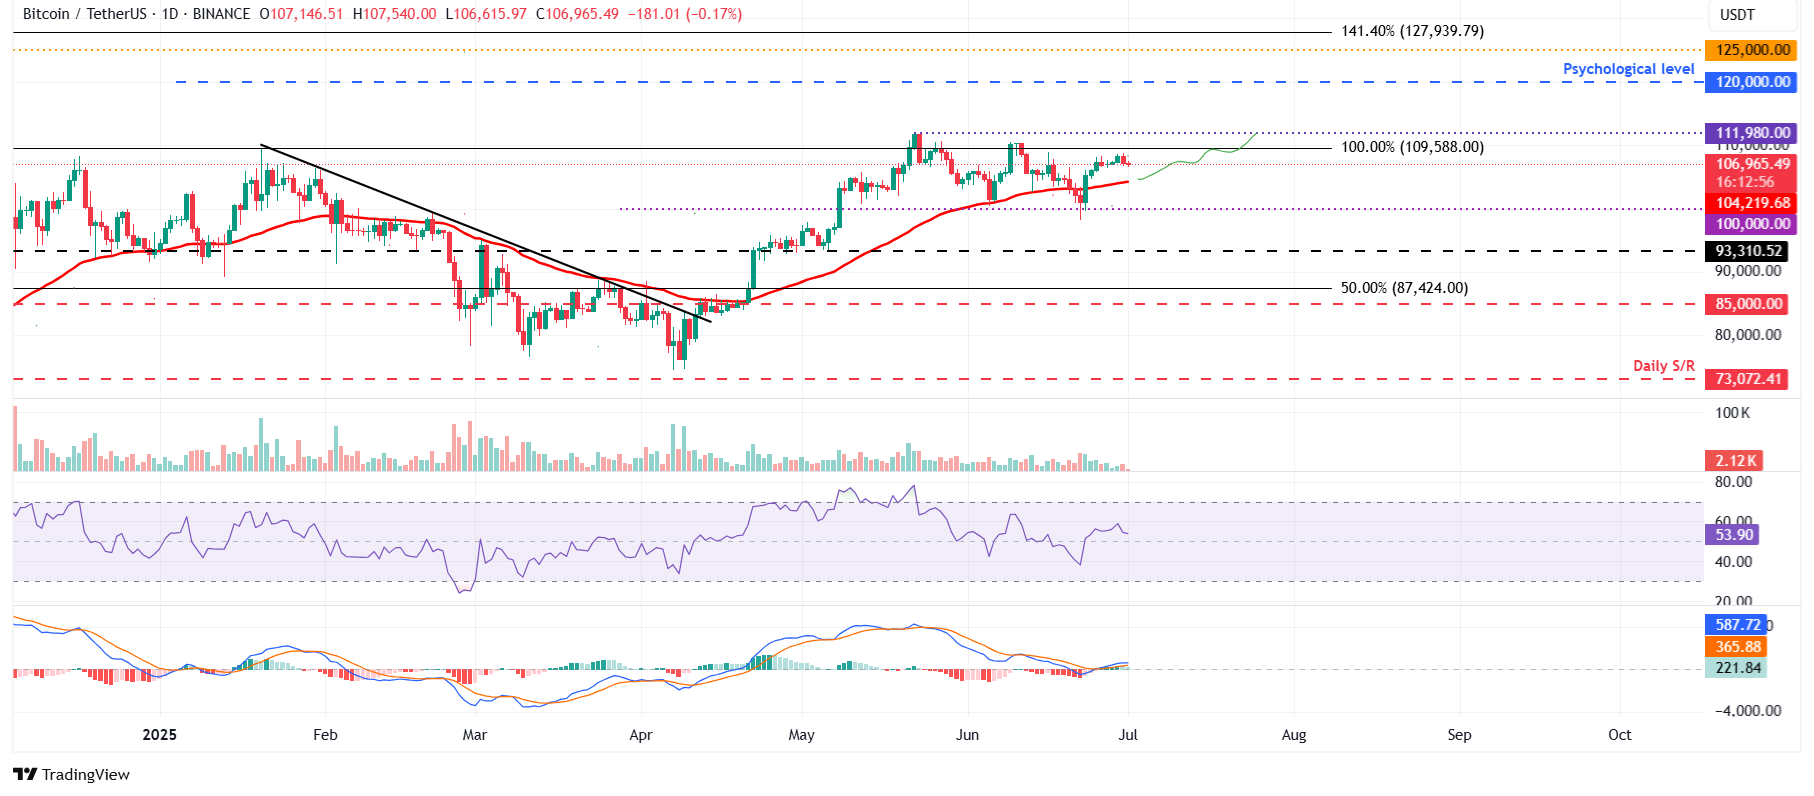
BTC/USDT daily chart
However, if BTC closes below its 50-day EMA at $104,219, it could extend the decline toward its psychological level of $100,000.


