Bitcoin Tries to Re-Gain Momentum, Ethereum Stabilizes After ETF Outflows
Cryptocurrencies are starting the new week calmly but on a positive note, with Bitcoin trading above $111,000 and Ethereum hovering around $4,300. Last week’s declines on Wall Street have eased, index futures are gaining, and the U.S. dollar is weakening. The biggest “pain point” for the cryptocurrency market remains the ongoing BTC sell-off from whale wallets. Their average BTC holdings per address have fallen below 500 BTC — the lowest level since 2018.
- Bitcoin and Ethereum are trading about 10% below their all-time highs, while sentiment toward altcoins remains muted. After BTC rebounded from around $108,000 to over $111,000, the market is waiting for a clear momentum signal. Whales sold about 115,000 BTC worth $12.7 billion in August — the largest outflow since 2022.
- The 7-day change indicator for the largest BTC addresses set a new record since March 2021. Whale selling is slowly losing steam: weekly BTC supply changes fell from 95,000 BTC in the week ending September 3 to 38,000 BTC between September 3–6.
- Markets now await U.S. CPI inflation data on Thursday — a reading below forecasts could act as a strong bullish catalyst for crypto. Meanwhile, MicroStrategy (MSTR.US) remains excluded from the S&P 500 index — its shares are down more than 2.5% in premarket trading.
- New Nasdaq regulations target “treasury” companies that accumulated crypto through bond (debt) issuance. These rules don’t ban such practices but require shareholder approval and lengthen the process.
- Bitcoin mining difficulty has reached a new record above 136 trillion, marking the fifth consecutive increase since June. Miner revenues have dropped to their weakest level since June, adding pressure on BTC mining profitability.
The LTH NUPL indicator for ETH, along with a two-month high in the Coin Days Destroyed metric, points to profit-taking by investors. Ethereum-based ETFs have seen five consecutive days of net outflows, signaling shifting investor sentiment toward risk and the broader crypto market. The key question: will this shift prove lasting?
Bitcoin and Ethereum (D1 interval)
Looking at BTC, we see the price moving within a short-term downward channel. Since February 2025, BTC has repeatedly broken out upward. A breakout above $115,000 could push Bitcoin toward new highs, while a drop below $107,000 could send the price back to the $95,000–$100,000 zone, where prior reactions were observed. Importantly, the price recently bounced from the key on-chain STH Realized Price of around $109,000, suggesting that short-term holders are once again posting “slight,” unrealized gains. A return below $108,000, however, could trigger a “capitulation” among this group.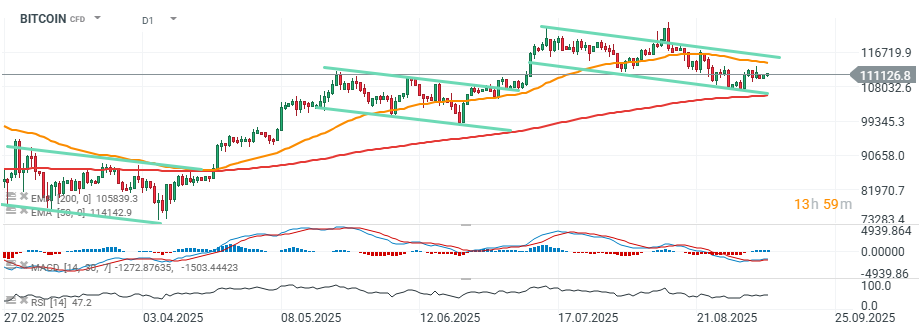
Source: xStation5
A move above $4,400 could lead ETH to retest its ATH — this time near $5,000 per token.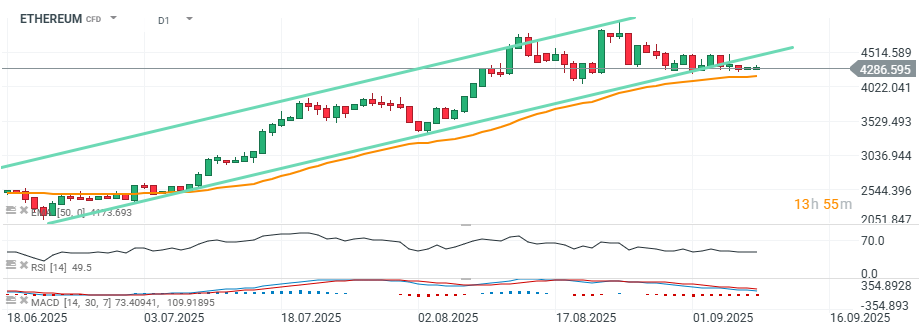
Source: xStation5
The M2 money supply across major central bank balance sheets is rising, which supports gold and, with some lag, should also support BTC.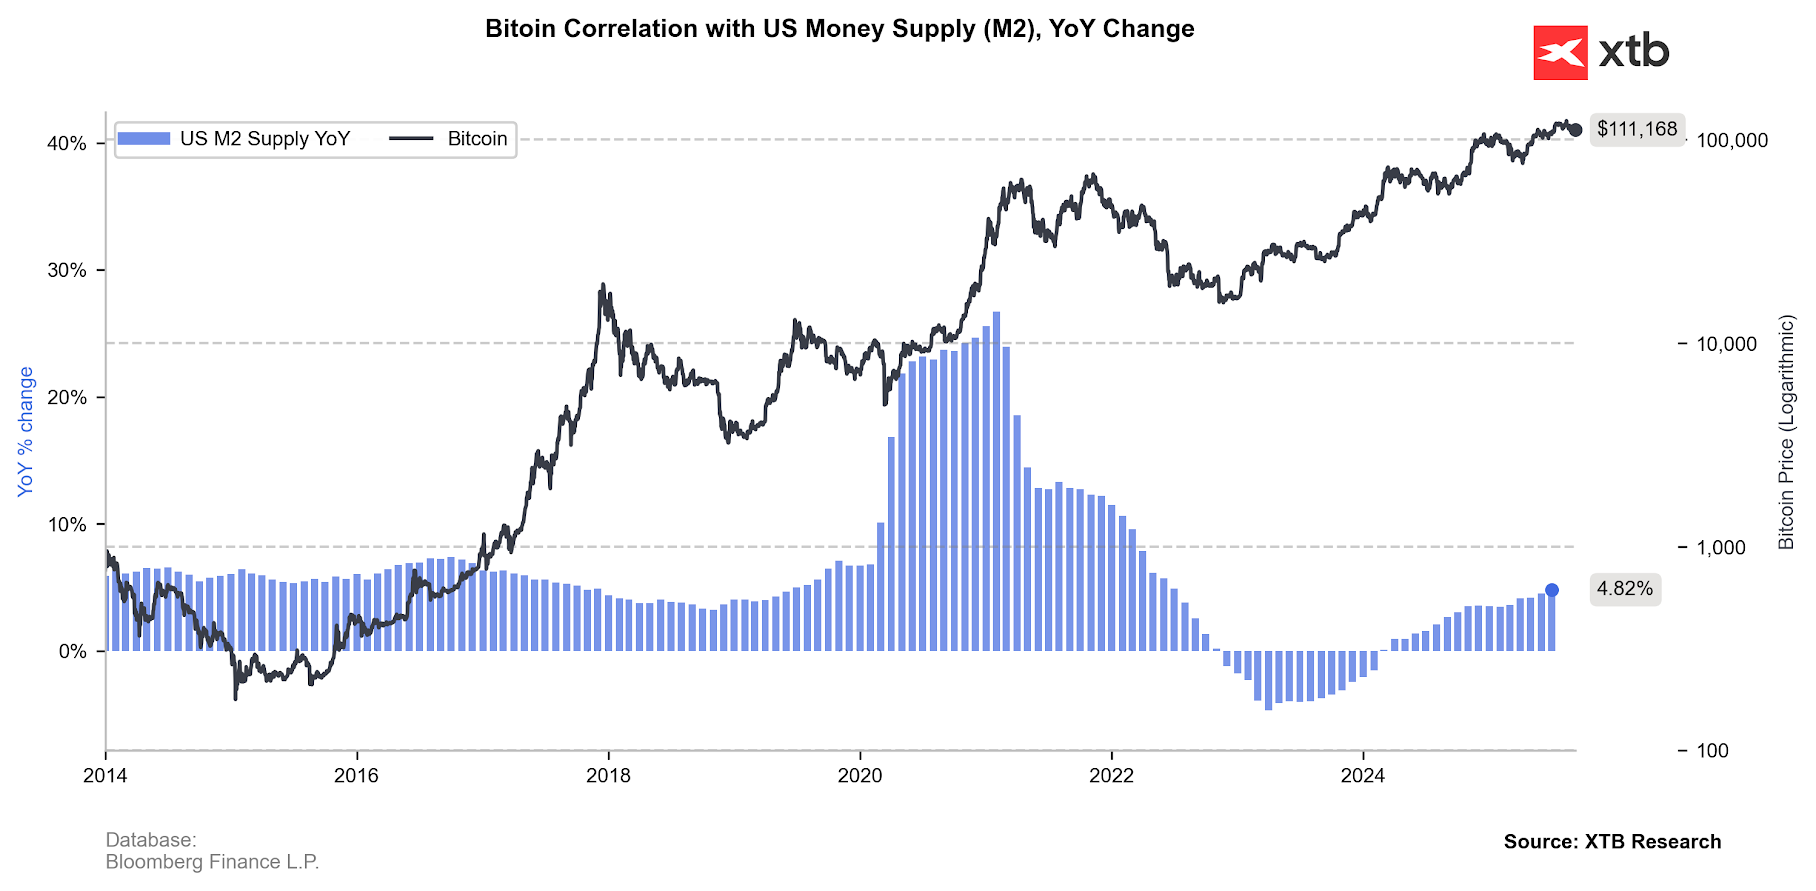
Source: XTB Research, Bloomberg Finance L.P.
ETF inflows weakening
The situation in Bitcoin ETFs points to some selling, though volumes remain relatively small. Overall activity in this group has slowed and currently does not exert a decisive impact on prices. On the other hand, a strong rise in net inflows could help Bitcoin climb to new ATHs. For now, whale supply is not being sufficiently “absorbed.”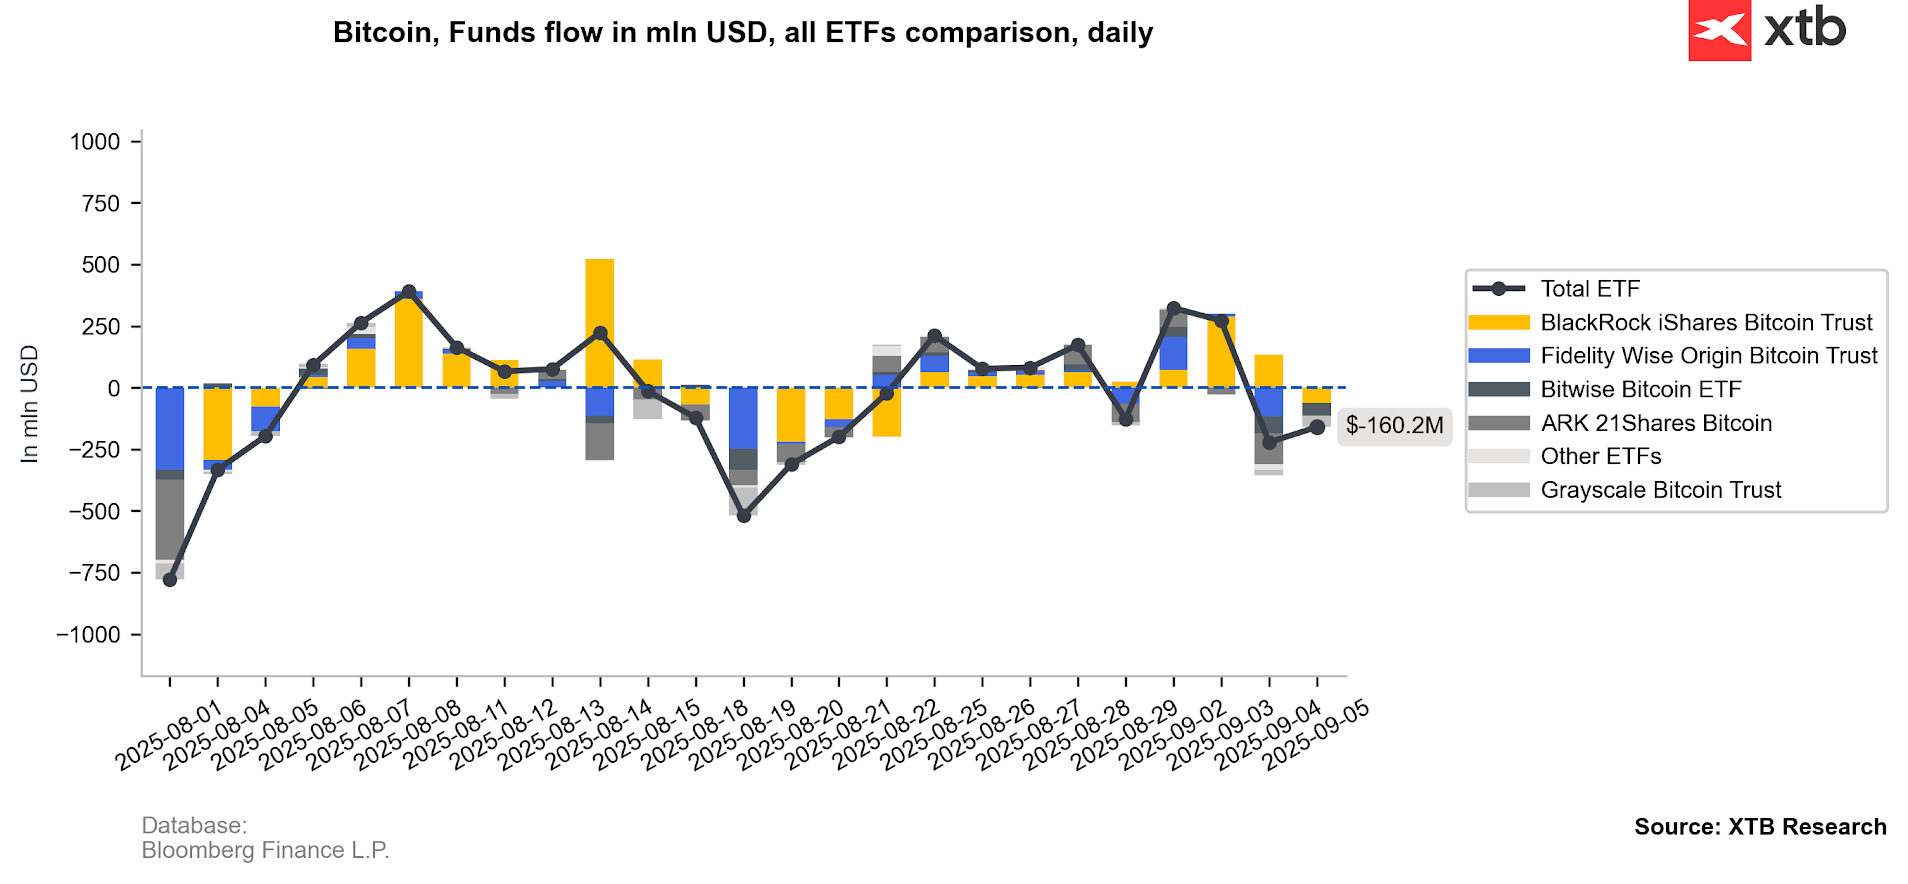
Source: XTB Research, Bloomberg Finance L.P.
Looking at Ethereum, we see five consecutive net outflow days. This should not be surprising, considering the scale of ETF accumulation in recent weeks. BlackRock’s ETF alone sold over $300 million worth of ETH. Still, this is not a reliable price predictor — around August 20 we saw a similar situation, followed by rising net inflows in subsequent sessions. All this suggests that the current cooling phase is natural and does not signal a strategic withdrawal of capital from crypto.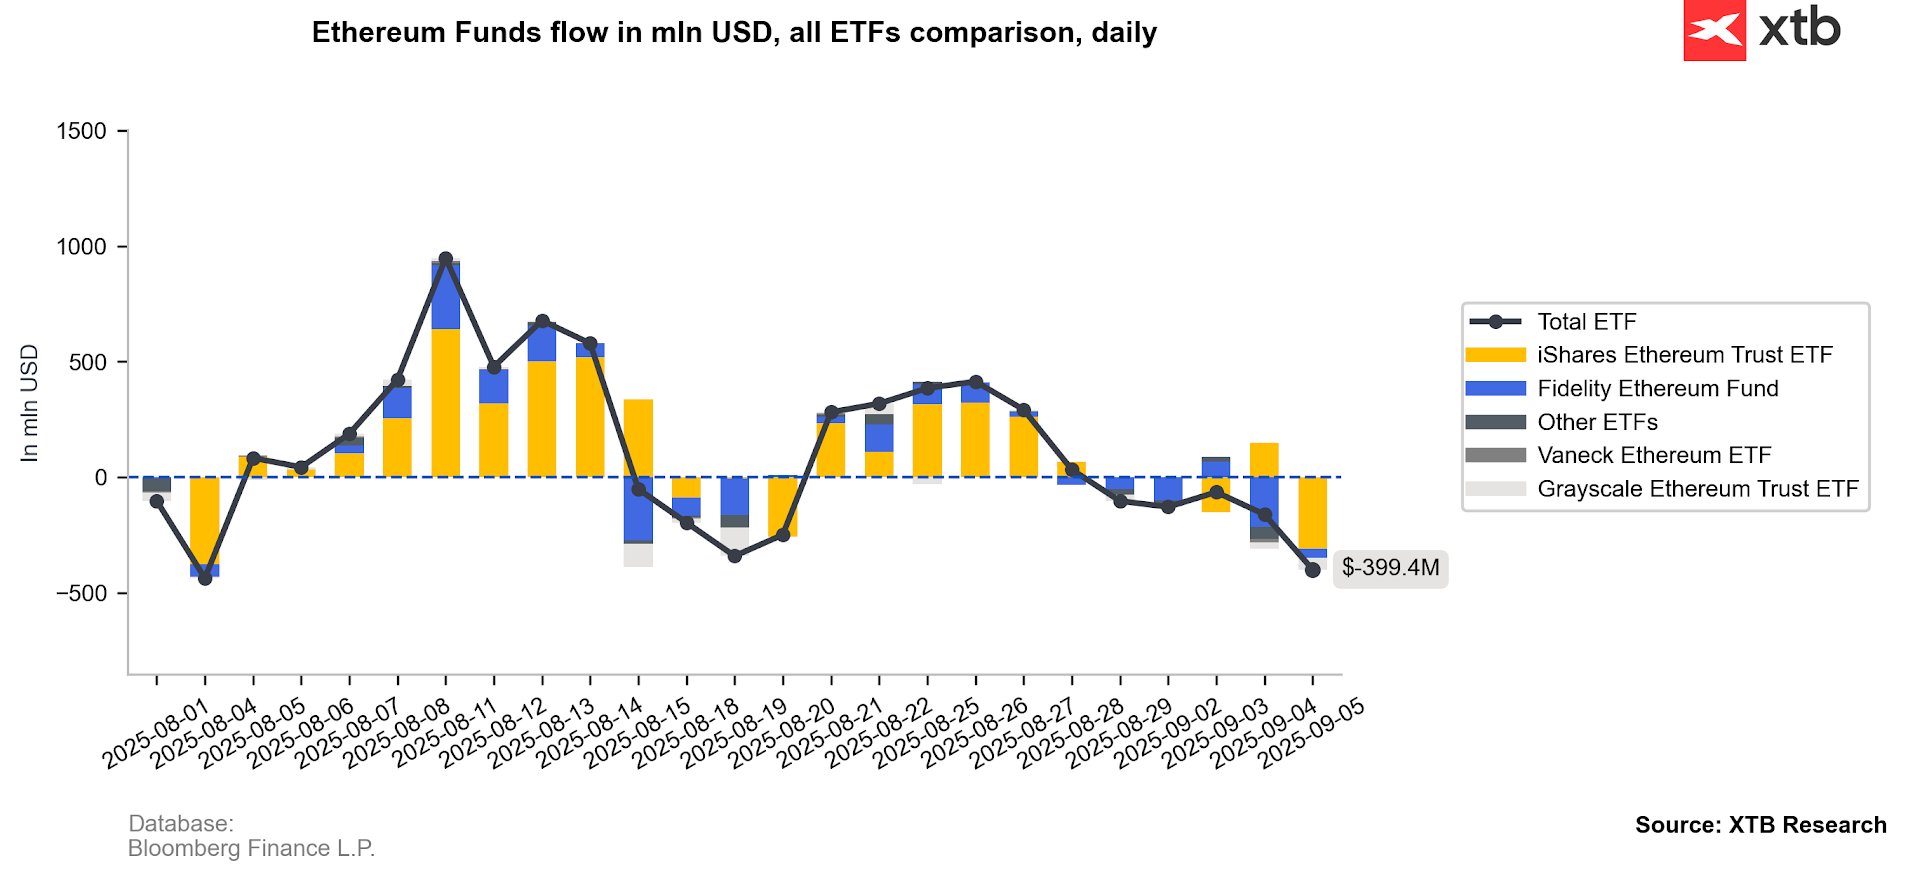
Source: XTB Research, Bloomberg Finance L.P.
Eryk Szmyd XTB Financial Markets Analyst
The material on this page does not constitute financial advice and does not take into account your level of understanding, investment objectives, financial situation or any other specific needs. All information provided, including opinions, market research, mathematical results and technical analyzes published on the Website or transmitted To you by other means, it is provided for information purposes only and should in no way be construed as an offer or solicitation for a transaction in any financial instrument, nor should the information provided be construed as advice of a legal or financial nature on which any investment decisions you make should be based exclusively To your level of understanding, investment objectives, financial situation, or other specific needs, any decision to act on the information published on the Website or sent to you by other means is entirely at your own risk if you In doubt or unsure about your understanding of a particular product, instrument, service or transaction, you should seek professional or legal advice before trading. Investing in CFDs carries a high level of risk, as they are leveraged products and have small movements Often the market can result in much larger movements in the value of your investment, and this can work against you or in your favor. Please ensure you fully understand the risks involved, taking into account investments objectives and level of experience, before trading and, if necessary, seek independent advice.


