BTC no longer correlates with global M2 – What does that mean for Bitcoin’s price?
The relationship between Bitcoin (BTC) and the global money supply M2 has always been a hot topic in the crypto community. Most analyses of this correlation show that both tend to rise together, often leading to optimistic conclusions.
However, September revealed signs that Bitcoin may no longer correlate with M2 supply. What do analysts say about this shift?
BTC lost correlation with global M2 in September
Experts usually argue that when M2 supply increases, liquidity flows into investment assets such as Bitcoin, fueling its price rally, and vice versa.
However, a recent observation by analyst Colin Talks Crypto showed that this positive correlation has weakened significantly.
His chart highlights a clear divergence between Bitcoin’s price (without lag) and Global M2 (shifted by 80 days).
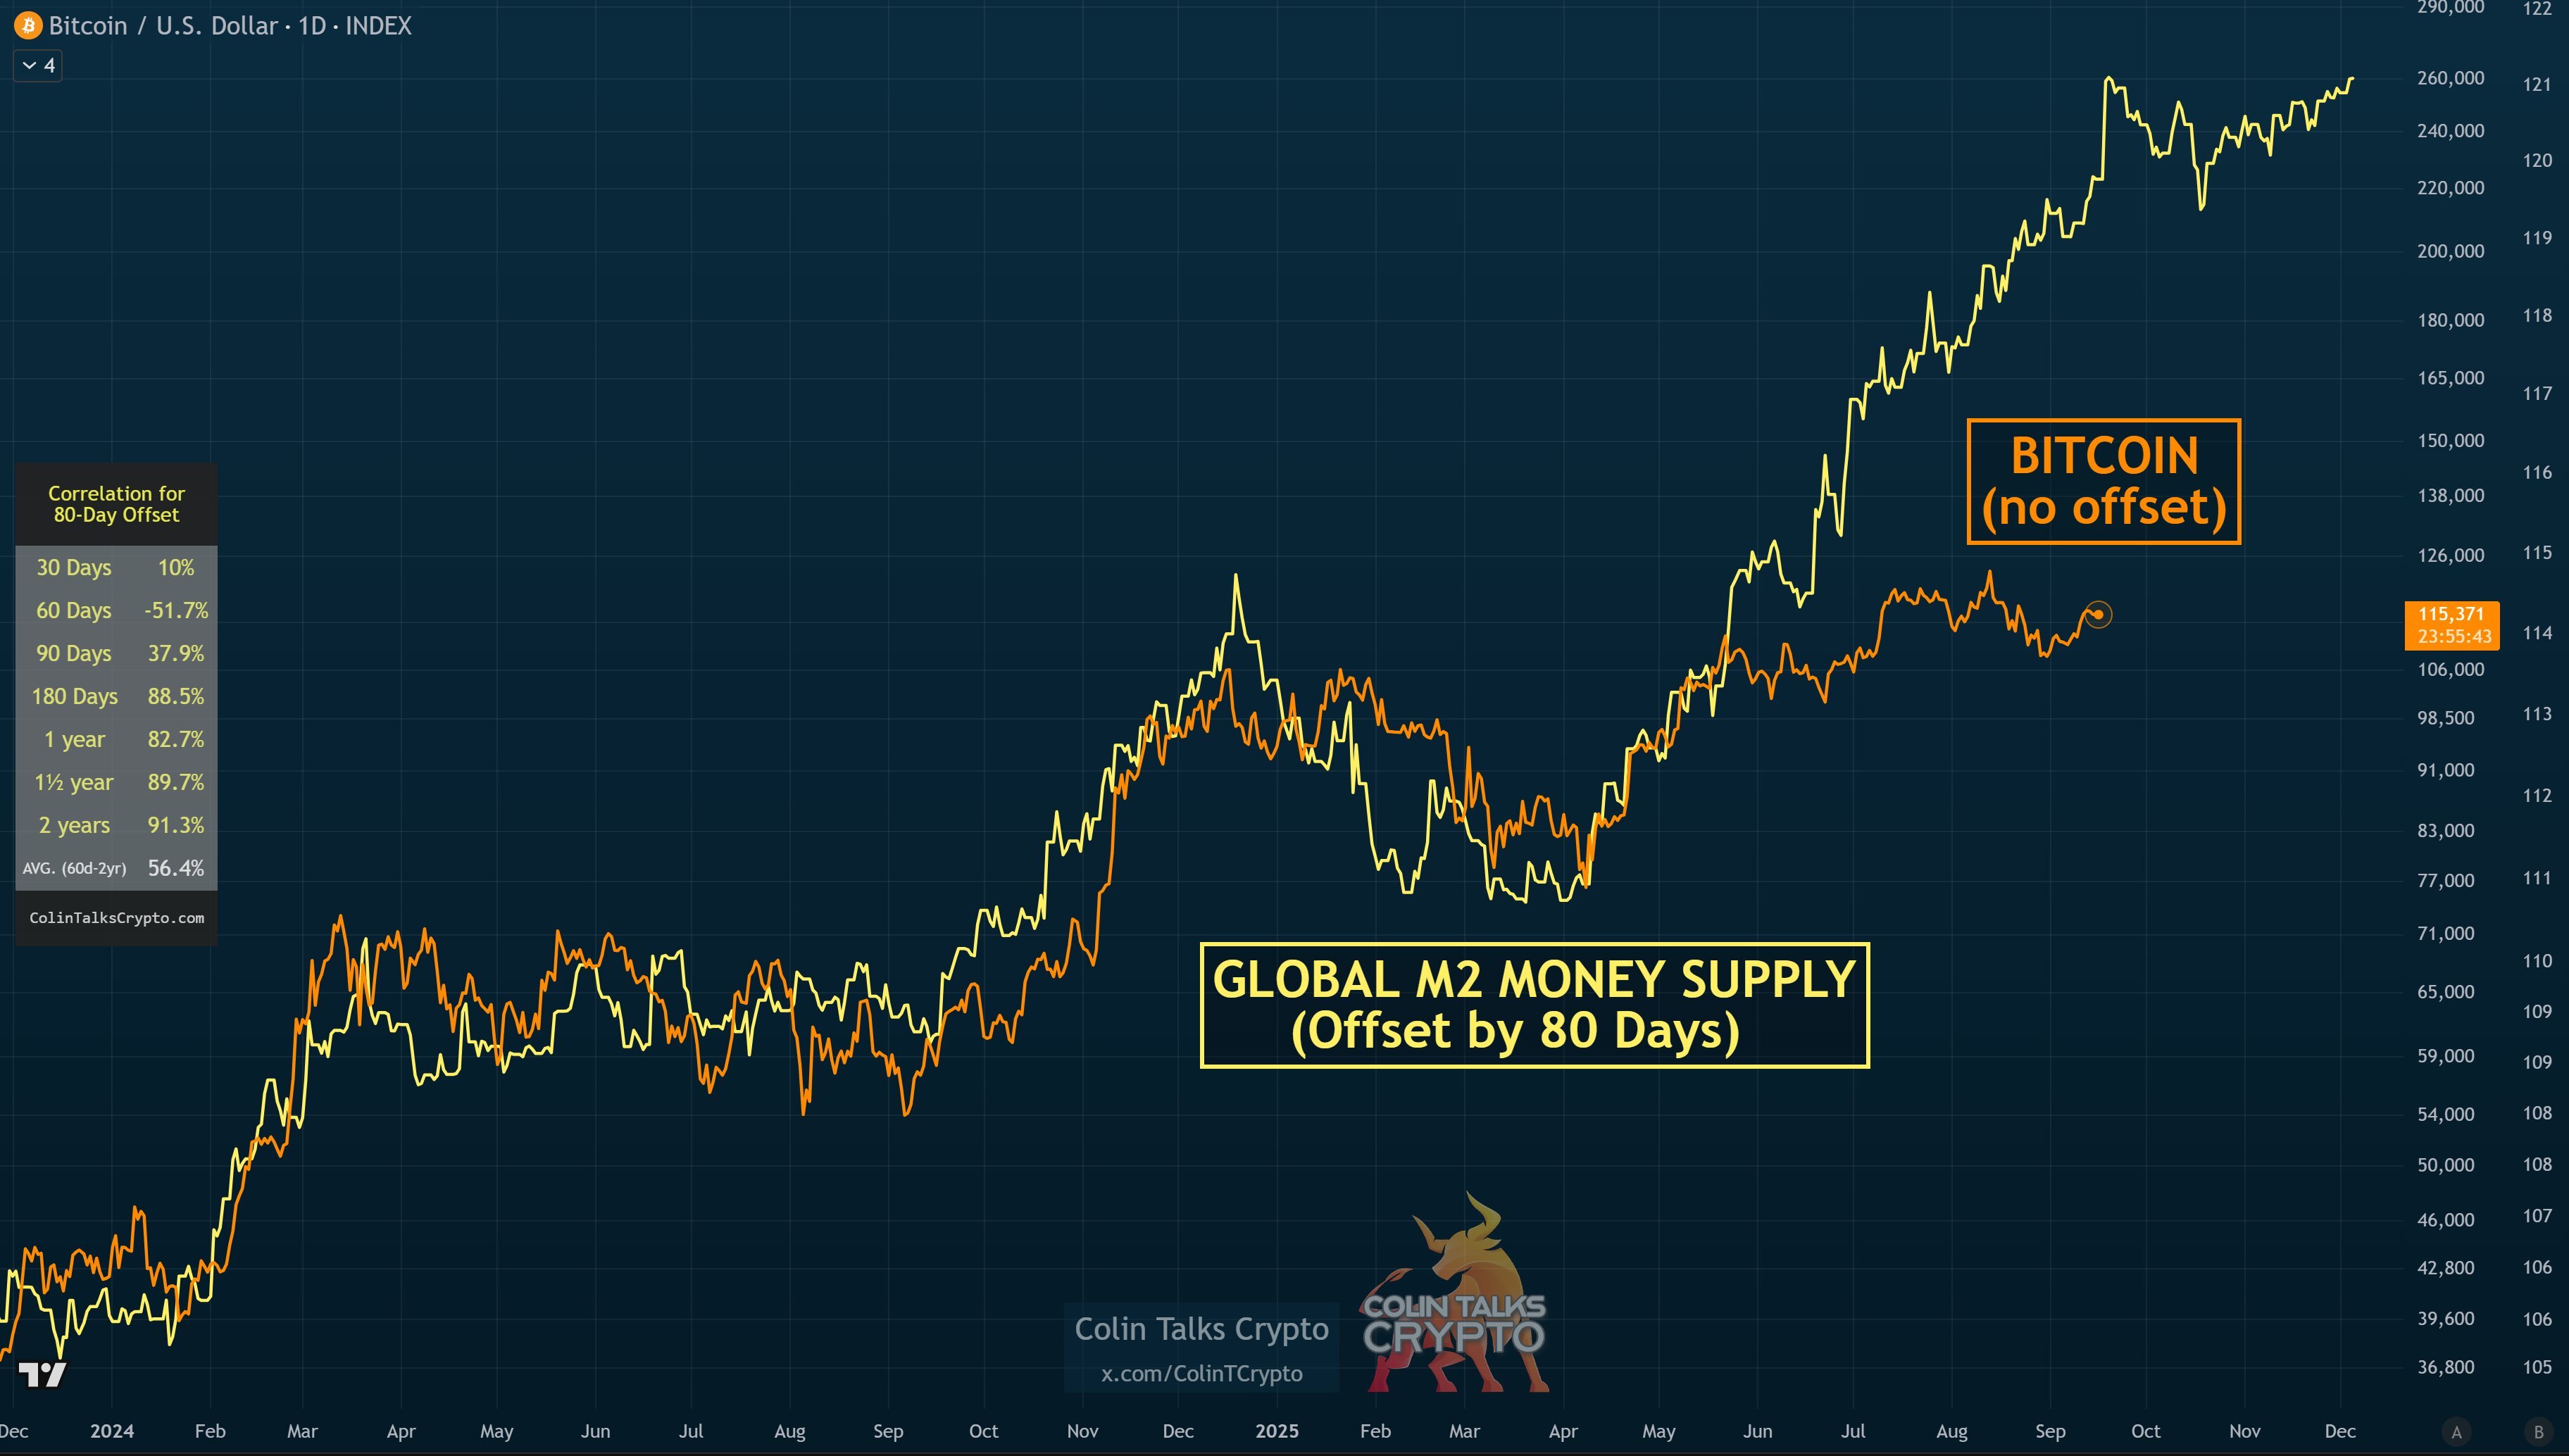
Bitcoin Price and Global M2 Money Supply. Source: Colin Talks Crypto
This divergence has become more pronounced over the past three months. It marks the weakest correlation since the launch of Bitcoin Spot ETFs in January 2024, when both indicators moved closely together.
Colin pointed out that in all three previous Bitcoin bull cycles, the correlation between BTC and Global M2 broke down as the market approached its peak.
He suggested the same pattern could be happening again, meaning Bitcoin might be nearing the top of its current cycle. Still, he admitted he is not certain.
I will keep a watchful eye on global M2. I think it has a chance to resume some increased level of correlation during BTC’s next, big, vertical leg up, but I can’t guarantee that, or that it will resume correlation at all this cycle,” Colin said.
The weakening correlation with M2 adds complexity for investors. Over the past year, many have placed this factor at the top of their decision-making when allocating Bitcoin in their portfolios.
Bitcoin also lost correlation with traditional assets like stocks and Gold
Bitcoin’s moves in September broke away from M2 supply and traditional assets such as the S&P 500, Nasdaq, and gold.
A recent CryptoQuant report showed Bitcoin’s correlation with the Nasdaq turned negative. The coefficient fell to its lowest level since September 2024. Meanwhile, by September 16, gold and the S&P 500 kept hitting new highs, while Bitcoin remained stuck below $120,000.
While investors kept pouring money into stocks and gold, on-chain data showed weaker buying pressure for Bitcoin. This appeared in the orange signals across all wallet cohorts in September on the “Trend Accumulation Score by Cohort” chart.
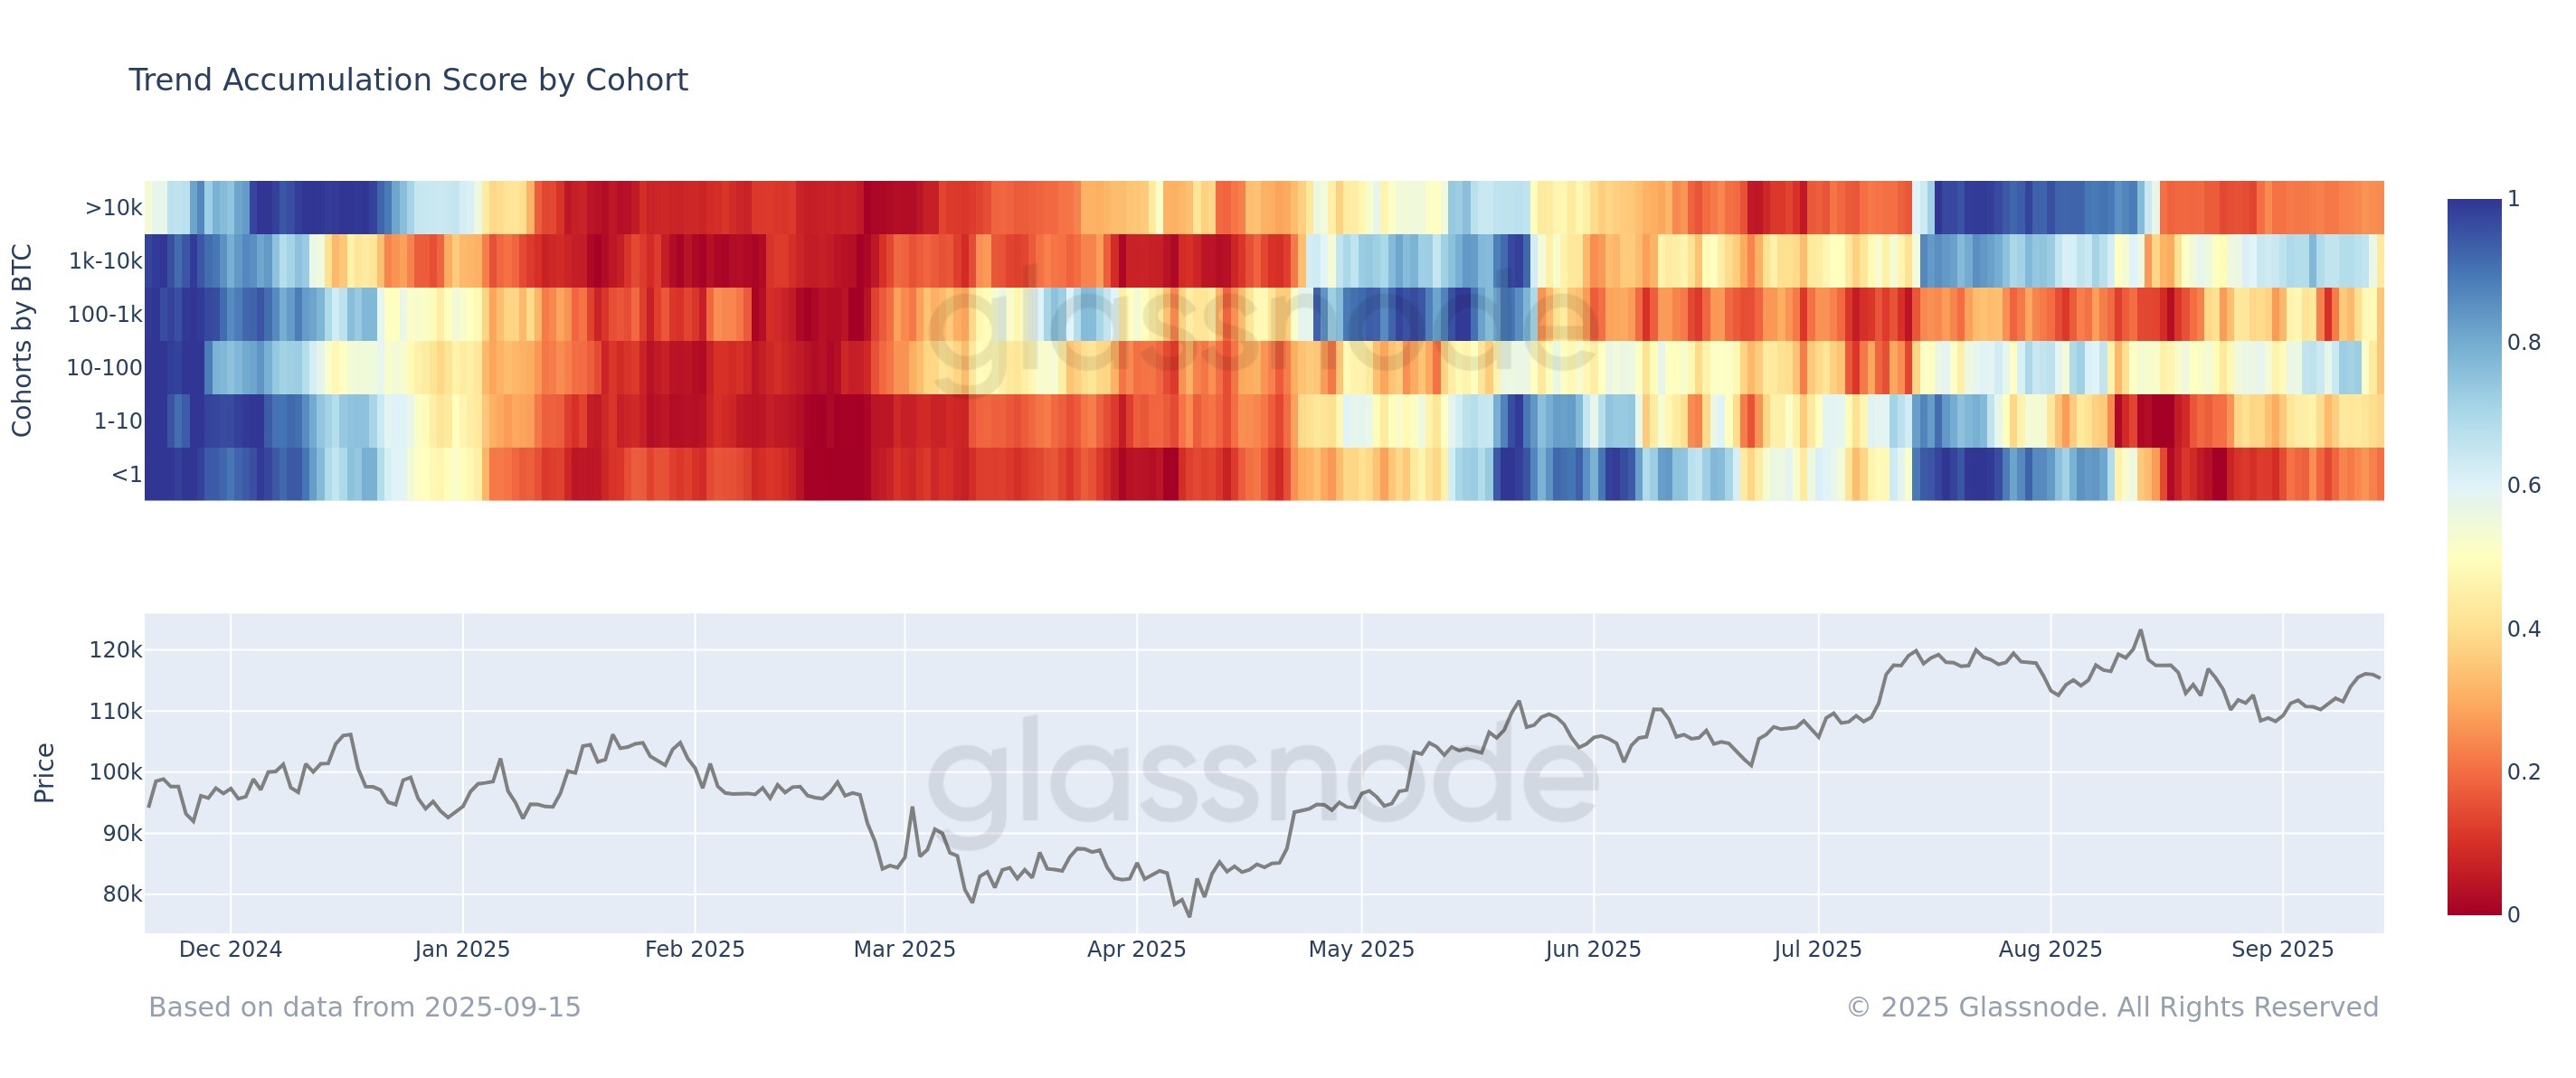
Trend Accumulation Score by Cohort. Source: Glassnode.
“Most BTC cohorts remain below the 0.5 threshold, indicating sell-side pressure persists. No group is showing strong accumulation (>0.8). The market remains in a broadly neutral-to-distribution regime,” Glassnode reported.
These signals call for investors and analysts to reassess all correlation factors. Capital inflows into Bitcoin are slowing, raising the possibility that the market may be approaching a local top.


