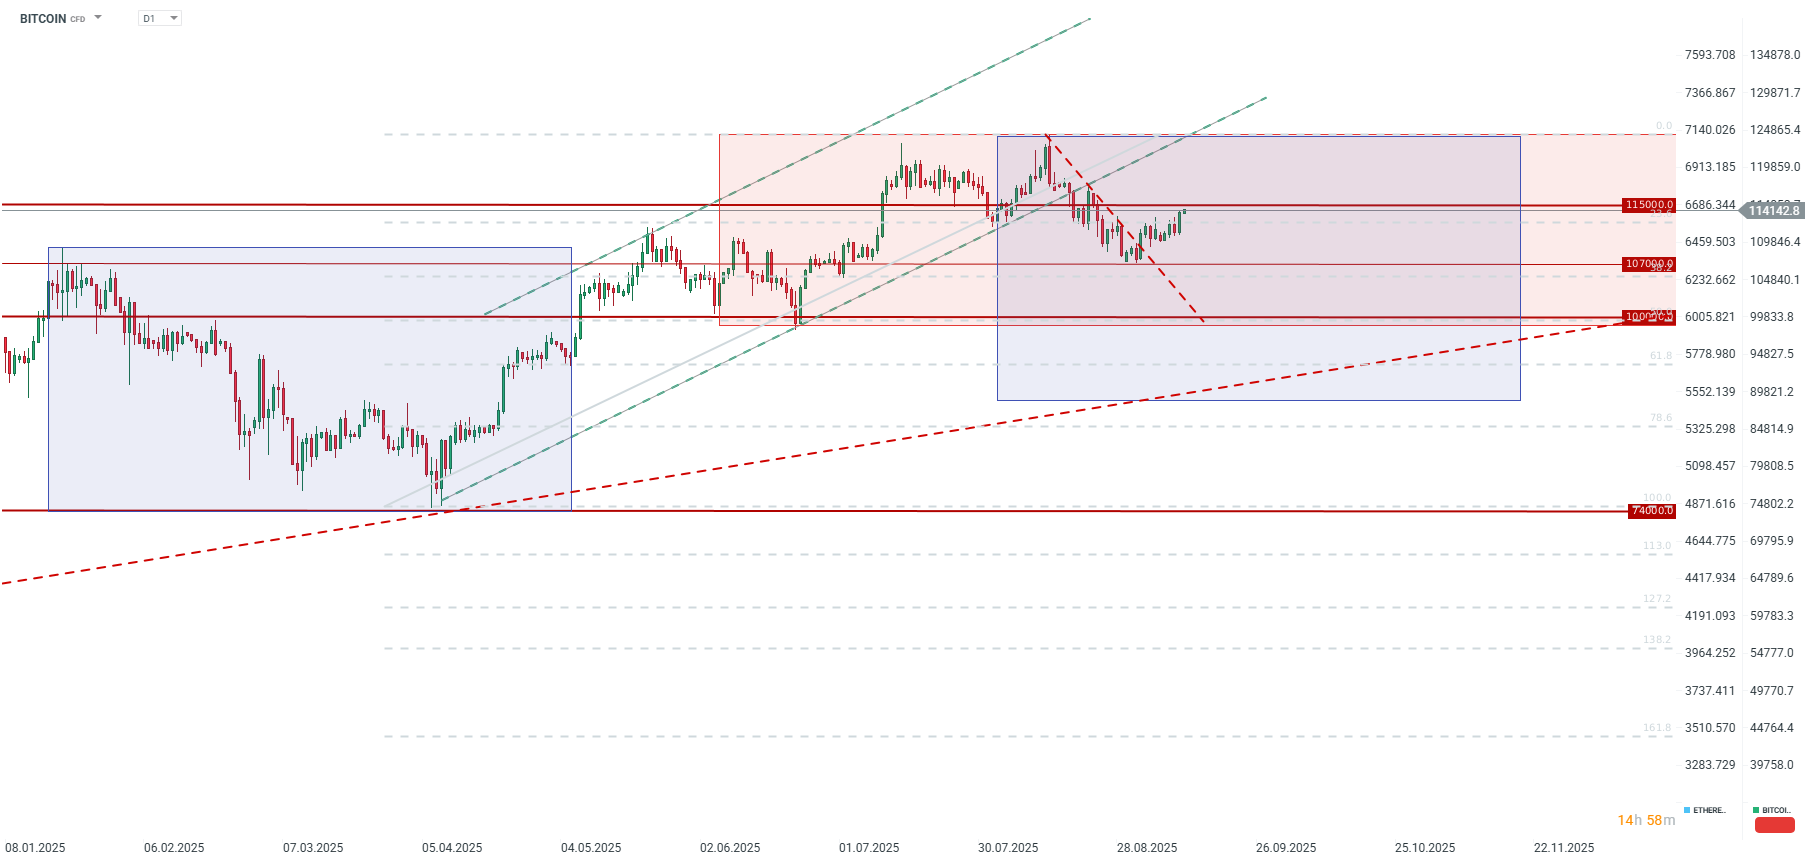
Yesterday, Bitcoin broke through its short-term resistance around $113,000, simultaneously breaching the 23.6% Fibonacci retracement of its most recent major downward impulse. This move follows a breakout from a downward correction at the beginning of September, which negated a potential double-top formation above the $120,000 level.
One of the key drivers behind this rally is anticipation of a larger rate cut from the Fed, which could lead to a weaker dollar. Although the EURUSD pair ultimately retreated below the 1.1700 level, the potential for a more aggressive cut could weigh on the dollar. Yesterday’s PPI inflation data fueled hopes for a larger cut, and today at 1:30 PM BST, we will get the crucial CPI inflation figures. While inflation is expected to rise to 2.9% year-on-year due to tariffs, a lower PPI reading may suggest less upward pressure than previously thought.
What else could be fueling Bitcoin’s momentum?
- ETF Inflows: Bitcoin ETFs saw inflows of over $750 million on Wednesday, September 10.
- Net inflows for September have already surpassed $1 billion, reversing the outflows seen in August.
- Whale Accumulation: On-chain data reveals “massive” accumulation by “whale” investors in August, amounting to approximately $3 billion. The number of addresses holding at least 100 BTC has reached a record 19,130, surpassing the previous peak from 2017.
- Shrinking Exchange Supply: The available supply of Bitcoin on exchanges is dwindling. Bitcoin now accounts for less than 11% of cryptocurrencies on exchanges, the lowest level since 2018. About 70% of the total Bitcoin supply has not changed hands for at least a year, signaling accumulation by long-term investors.
- Corporate Adoption: A growing number of companies are opting to hold a portion of their assets in Bitcoin. According to AInvest data, corporations and related institutions (ETFs, governments, etc.) now hold 3.7 million BTC.
- Reduced Leverage: Glassnode data indicates that the leverage ratio used for Bitcoin trading has fallen significantly this year, suggesting a shift from speculation towards long-term institutional allocation.
The material on this page does not constitute financial advice and does not take into account your level of understanding, investment objectives, financial situation or any other specific needs. All information provided, including opinions, market research, mathematical results and technical analyzes published on the Website or transmitted To you by other means, it is provided for information purposes only and should in no way be construed as an offer or solicitation for a transaction in any financial instrument, nor should the information provided be construed as advice of a legal or financial nature on which any investment decisions you make should be based exclusively To your level of understanding, investment objectives, financial situation, or other specific needs, any decision to act on the information published on the Website or sent to you by other means is entirely at your own risk if you In doubt or unsure about your understanding of a particular product, instrument, service or transaction, you should seek professional or legal advice before trading. Investing in CFDs carries a high level of risk, as they are leveraged products and have small movements Often the market can result in much larger movements in the value of your investment, and this can work against you or in your favor. Please ensure you fully understand the risks involved, taking into account investments objectives and level of experience, before trading and, if necessary, seek independent advice.


