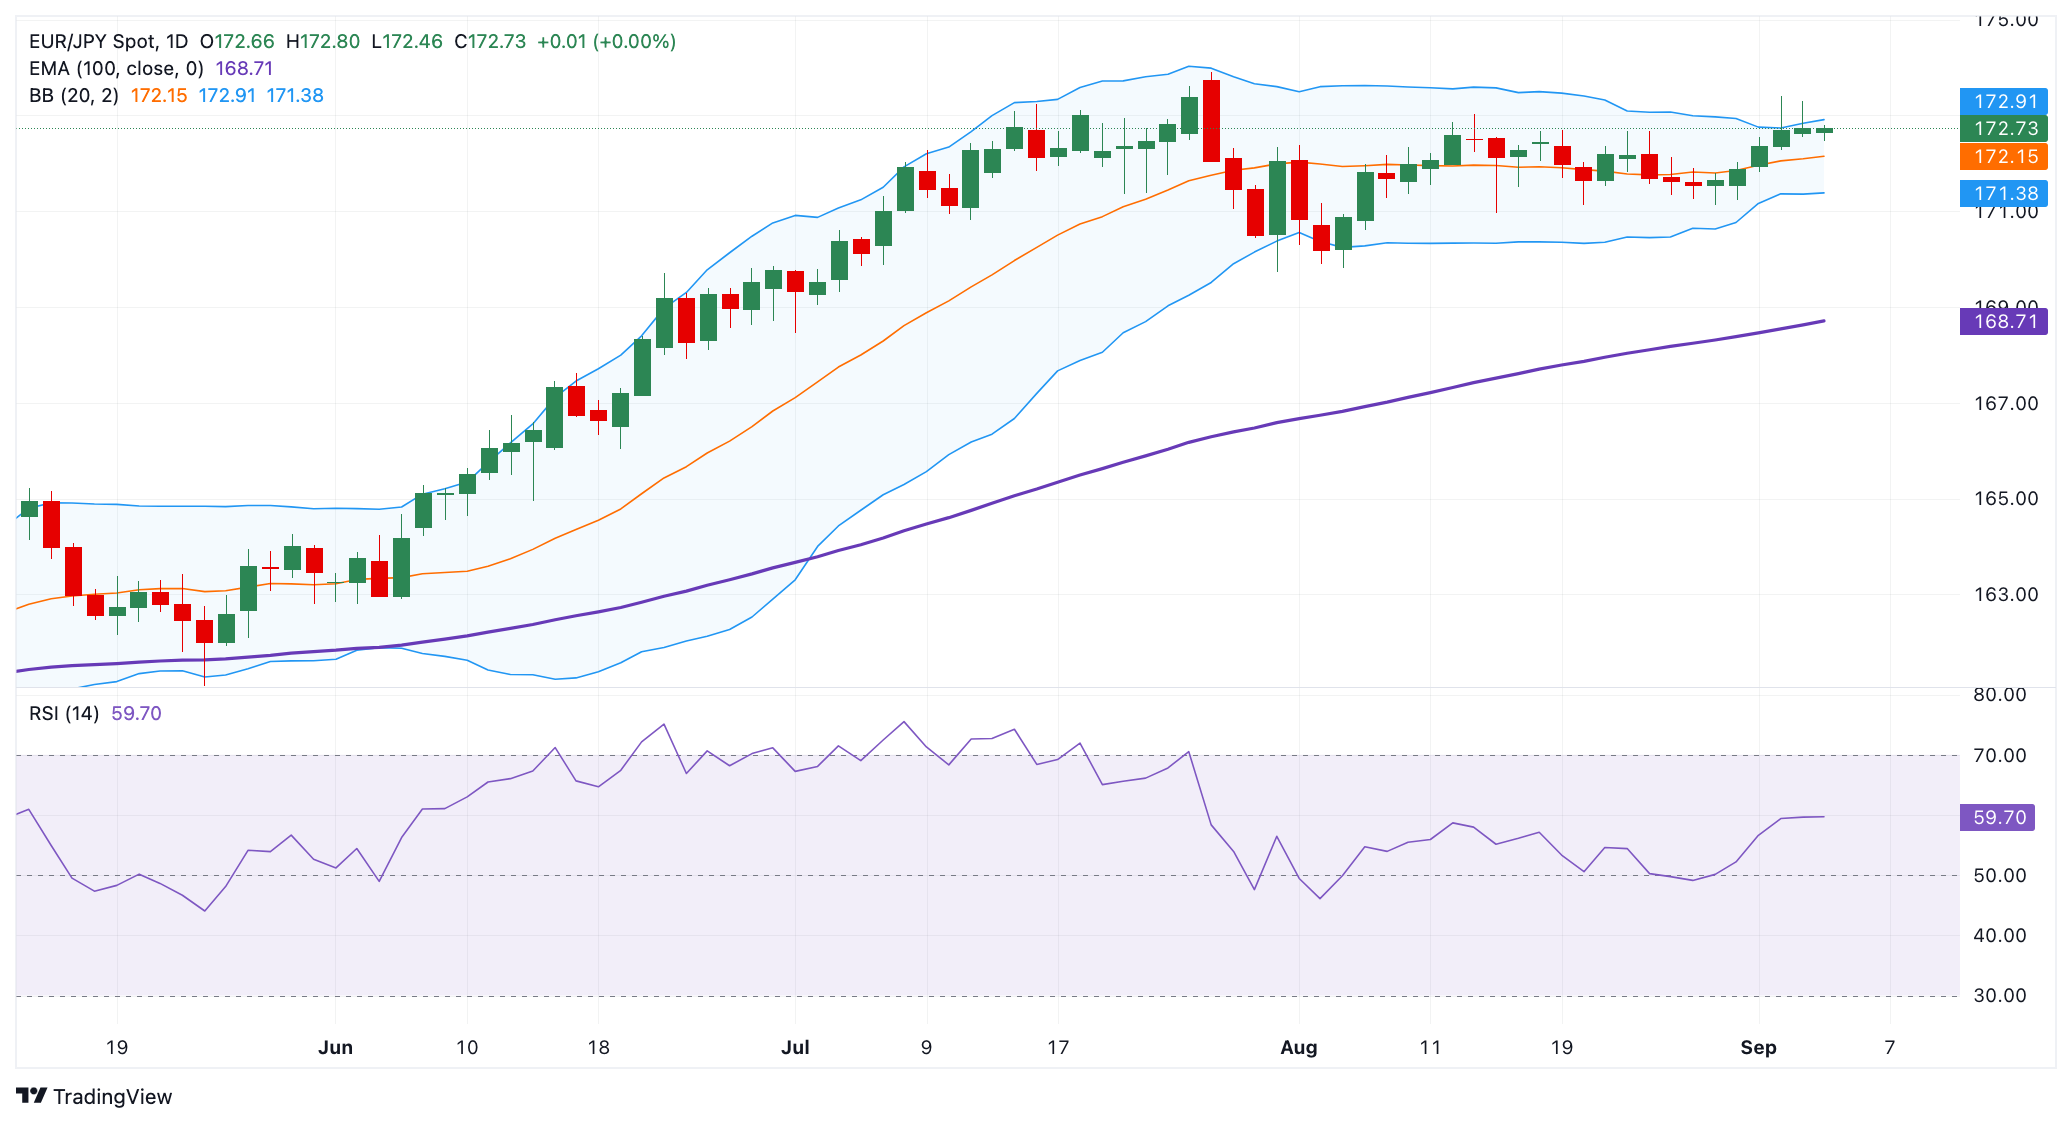
- EUR/JPY flat lines around 172.65 in Thursday’s early European session.
- Positive view of the cross prevails above the 100-day EMA, with the bullish RSI indicator.
- The immediate resistance level emerges at the 172.90-173.00 region; the first support level to watch is 172.28.
The EUR/JPY cross trades on a flat note near 172.65 during the early European session on Thursday. Traders remain divided over the likely timing and pace of Bank of Japan (BoJ) rate hikes amid tariff-related uncertainties. The Eurozone Retail Sales report will be in the spotlight later on Thursday, which is expected to see an increase of 2.4% YoY in July.
Technically, the constructive outlook of EUR/JPY remains in place as the cross is well-supported above the key 100-day Exponential Moving Average (EMA) on the daily chart. The path of least resistance is to the upside, with the 14-day Relative Strength Index (RSI) standing above the midline near 59.30. This displays the bullish momentum in the near term.
On the bright side, the crucial upside barrier emerges in the 172.90-173.00 zone, representing the upper boundary of the Bollinger Band and a psychological level. Sustained trading above this level could pick up more momentum and aim for 173.41, the high of September 2. Further north, the next resistance level is seen at 173.90, the high of July 28.
In the bearish case, the low of September 2 at 172.28 acts as an initial support level for EUR/JPY. A breach of this level could drag the cross toward 171.38, the lower limit of the Bollinger Band. The additional downside filter to watch is 170.44, the low of August 6.
EUR/JPY daily chart