- GBP/JPY retraces to near 197.35 after revisiting an almost six-month high around 198.20.
- Lower Oil price has strengthened the demand of the Japanese Yen.
- Upbeat flash UK PMI data for June has supported the Pound Sterling.
The GBP/JPY pair corrects slightly to near 197.35 during European trading hours on Tuesday after revisiting an almost six-month high around 198.20 the previous day. The cross faces slight selling pressure as the Japanese Yen (JPY) gains due to a sharp decline in the Oil price, following the Israel-Iran ceasefire.
Japanese Yen PRICE Today
The table below shows the percentage change of Japanese Yen (JPY) against listed major currencies today. Japanese Yen was the strongest against the US Dollar.
| USD | EUR | GBP | JPY | CAD | AUD | NZD | CHF | |
|---|---|---|---|---|---|---|---|---|
| USD | -0.29% | -0.33% | -0.51% | -0.11% | -0.57% | -0.61% | 0.03% | |
| EUR | 0.29% | -0.08% | -0.24% | 0.17% | -0.28% | -0.76% | 0.33% | |
| GBP | 0.33% | 0.08% | -0.16% | 0.26% | -0.20% | -0.67% | 0.26% | |
| JPY | 0.51% | 0.24% | 0.16% | 0.41% | -0.10% | -0.14% | 0.42% | |
| CAD | 0.11% | -0.17% | -0.26% | -0.41% | -0.47% | -0.93% | 0.00% | |
| AUD | 0.57% | 0.28% | 0.20% | 0.10% | 0.47% | -0.48% | 0.46% | |
| NZD | 0.61% | 0.76% | 0.67% | 0.14% | 0.93% | 0.48% | 0.94% | |
| CHF | -0.03% | -0.33% | -0.26% | -0.42% | -0.00% | -0.46% | -0.94% |
The heat map shows percentage changes of major currencies against each other. The base currency is picked from the left column, while the quote currency is picked from the top row. For example, if you pick the Japanese Yen from the left column and move along the horizontal line to the US Dollar, the percentage change displayed in the box will represent JPY (base)/USD (quote).
The Japanese currency underperformed its peers on Monday after Iran threatened to close the Strait of Hormuz, which led to a sharp increase in the Oil price. Given that the Japanese economy addresses its Oil requirements from imports, higher energy prices diminish the Japanese Yen’s appeal.
Meanwhile, the Pound Sterling trades higher against its major peers, except Asia-Pacific currencies, due to upbeat preliminary United Kingdom (UK) S&P Global Purchasing Managers’ Index (PMI) data for June released on Monday. The data showed that the Composite PMI grew at a faster-than-expected pace due to outperformance in both the manufacturing and the service sector activity.
The Service PMI grew expectedly to 51.3, higher than 50.9 in May. While the Manufacturing PMI declined to near 47.7 but at a slower-than-anticipated pace.
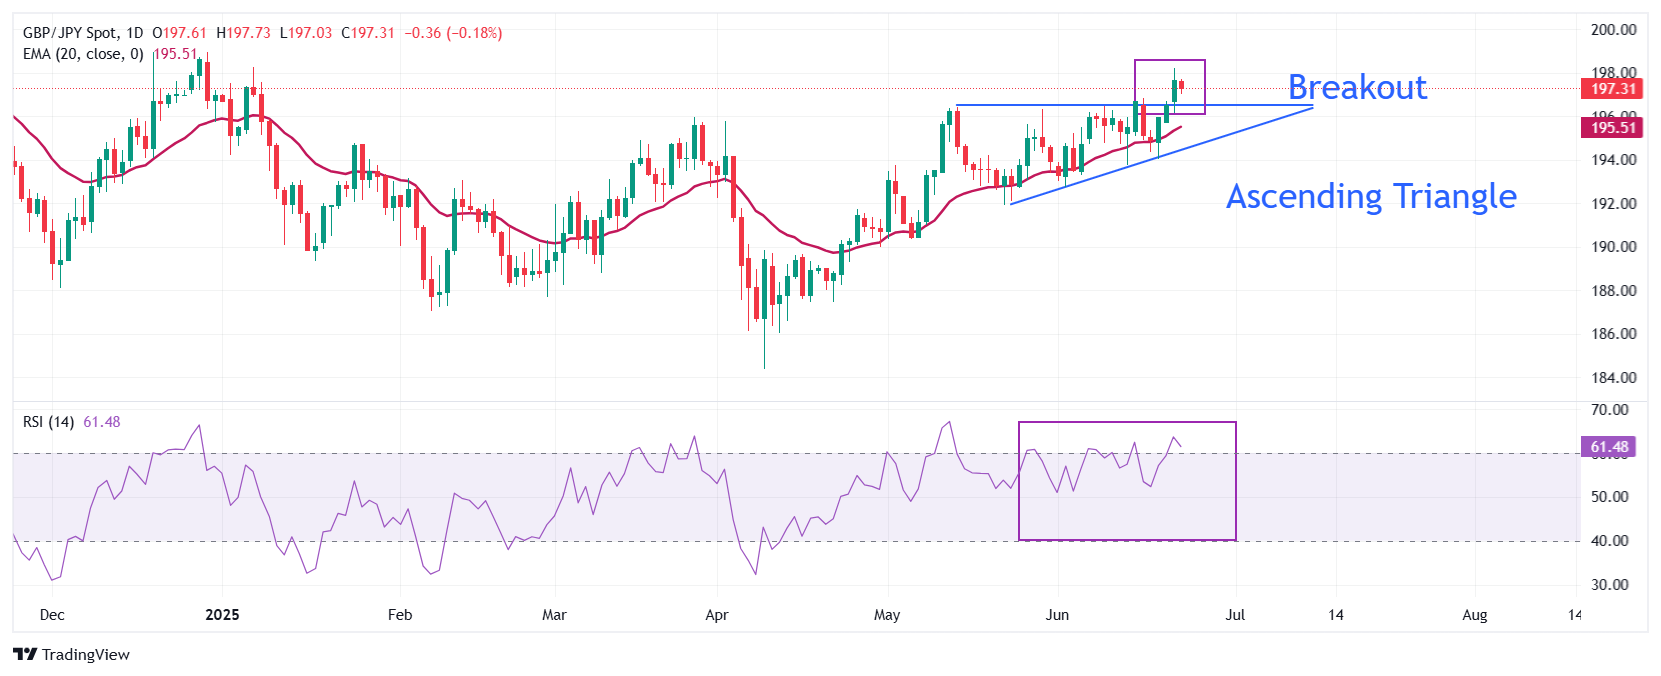
GBP/JPY retraces after a breakout of the Ascending Triangle formation on a daily timeframe, which leads to wider ticks and heavy volume on the upside. The horizontal resistance of the above-mentioned chart pattern is plotted from the May 14 high around 196.41, while the upward-sloping trendline is placed from the May 22 low of 191.90.
Upward-sloping 20-day Exponential Moving Average (EMA) around 195.50 suggests that the near-term trend is bullish.
The 14-day Relative Strength Index (RSI) breaks above 60.00. A fresh bullish momentum would emerge if the RSI holds above that level.
The pair could extend its upside towards the psychological level of 200.00 and the 23 July 2024 high of 203.16 after breaking above Monday’s high of 198.20.
On the flip side, a downside move by the pair below the May 6 low of 190.33 will expose it to the March 11 low of 188.80, followed by the February 7 low of 187.00.
GBP/JPY daily chart