GBP/USD Price Forecast: Rebounds toward 1.3750 near multi-year highs
- GBP/USD may find resistance at 1.3770, the highest since October 2021.
- A break above the 70 mark would signal overbought conditions, suggesting a potential downward correction ahead.
- The primary support appears at the nine-day EMA of 1.3635.
The GBP/USD pair retraces its recent losses from the previous session, trading around 1.3730 during the Asian hours on Monday. The bullish bias persists as the daily chart’s technical analysis indicates that the pair moves upwards within the ascending channel pattern.
The 14-day Relative Strength Index (RSI) remains slightly below the 70 level, strengthening the bullish bias. However, a breach above the 70 mark would indicate an oversold situation and a downward correction soon. Additionally, the GBP/USD pair rises above the nine-day Exponential Moving Average (EMA), suggesting the short-term price momentum is stronger.
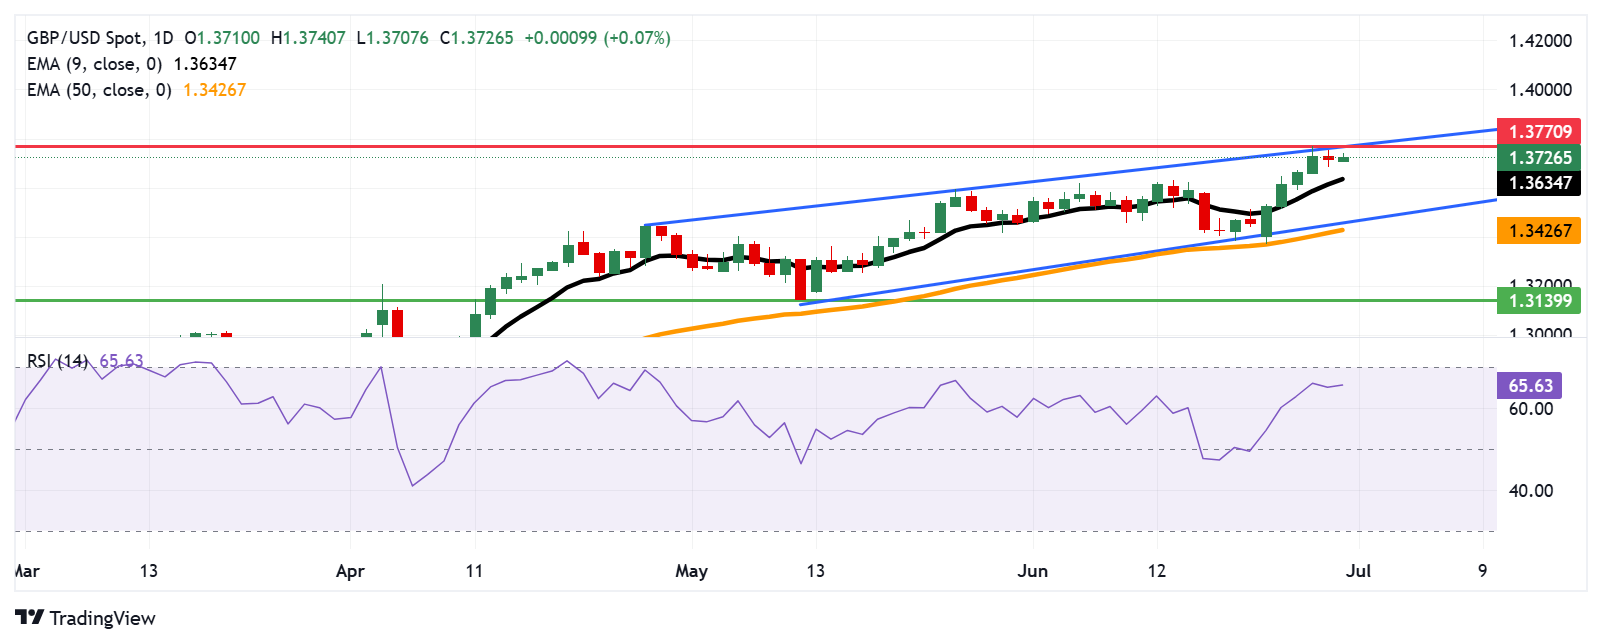
On the upside, the GBP/USD pair is poised to test the 1.3770, the highest since October 2021, which was recorded on June 26, aligned with the upper boundary of the ascending channel. A successful breach above this crucial resistance zone could reinforce the bullish bias and support the pair to approach the psychological level of 1.3800.
The GBP/USD pair could find the initial support at the nine-day EMA of 1.3634. A break below this level could weaken the short-term price momentum and put downward pressure on the pair to test the ascending channel’s lower boundary around 1.3460, followed by the 50-day EMA at 1.3426. Further declines could open the doors for the pair to navigate the region around the two-month low at 1.3139, recorded on May 12.
GBP/USD: Daily Chart