JPY strengthens amid softer risk tone, modest USD downtick ahead of US PCE data
- The Japanese Yen attracts some safe-haven flows amid a slight deterioration in the risk sentiment.
- The USD pauses for a breather ahead of the US PCE data and exerts some pressure on USD/JPY.
- Expectations that the BoJ might delay rate hikes warrant some caution for aggressive JPY bulls.
The Japanese Yen (JPY) recovers slightly from a three-week low touched against its American counterpart during the Asian session on Friday, though the upside seems capped. US President Donald Trump announced a new round of punishing tariffs on a broad range of imported goods, tempering investors’ appetite for riskier assets amid persistent geopolitical risks. This, in turn, is seen driving some safe-haven flows towards the JPY. The US Dollar (USD), on the other hand, pauses its recent rally to a three-week high as traders opt to move to the sidelines ahead of the key US inflation data, and contributes to the USD/JPY pair’s modest pullback.
Meanwhile, data released earlier today showed that consumer prices in Japan’s capital city, Tokyo, rose less than expected in September. This comes on top of domestic political uncertainty and concerns about economic headwinds stemming from US tariffs, which could allow the Bank of Japan (BoJ) to delay raising interest rates and act as a headwind for the JPY. Hence, it will be prudent to wait for strong follow-through buying before confirming that the JPY has bottomed out. Traders might also opt to wait for the release of the US Personal Consumption Expenditure (PCE) Price Index, which should influence the USD and the USD/JPY pair.
Japanese Yen attracts some buyers as safe-haven flow offset BoJ rate hike uncertainty
- The Statistics Bureau of Japan reported earlier this Friday that the headline Tokyo Consumer Price Index (CPI) rose 2.5% from a year earlier in September, down slightly compared to 2.6% in the previous month and missing consensus estimates. Adding to this, Tokyo CPI ex Fresh Food remained unchanged and rose 2.5% YoY during the reported month against 2.8% expected.
- Furthermore, a core gauge, which excludes both Fresh Food and Energy prices, and is closely watched by the Bank of Japan as a gauge of underlying inflation, eased to 2.5% in September from 3.0% in the previous month. This undermines the Japanese Yen and drags it to a fresh low since early August against a broadly firmer US Dollar during the Asian session on Friday.
- Japan’s Liberal Democratic Party (LDP) leadership election will take place on 4 October and the outcome could delay the next interest rate hike by the BoJ if a candidate with dovish views is selected. This adds a layer of uncertainty amid concerns about economic headwinds stemming from US President Donald Trump’s 15% baseline tariff on most Japanese imports.
- Meanwhile, Trump on Thursday announced a 100% tariff on imports of branded or patented pharmaceutical products, 25% levies on imports of all heavy-duty trucks, and 50% tariffs on kitchen cabinets from October 1. Trump also said he would start charging a 30% tariff on upholstered furniture next week. This underpins the JPY’s safe-haven status and limits losses.
- The US Dollar, on the other hand, holds steady near a three-week high, as stronger-than-expected US economic data released on Thursday fueled uncertainty over the pace of interest rate cuts by the Federal Reserve. The revised US GDP print showed that the economy grew at an annualised 3.8% pace during the second quarter compared to the 3.3% estimated initially.
- Adding to this, the US Labor Department reported that Initial Jobless Claims fell to 218K for the week ending September 20, well below the 235K expected and the previous week’s 232K (revised from 231K). This helps ease concerns about a softening labor market and raises questions as to how much the Fed may cut interest rates again by the end of this year.
- Nevertheless, traders are still pricing in a greater chance that the US central bank will lower borrowing costs again in October and December. This keeps a lid on any further USD gains and caps the USD/JPY pair. Traders also seem reluctant to place fresh bullish bets and opt to wait for the release of the US Personal Consumption Expenditure (PCE) Price Index.
USD/JPY bullish setup backs case for emergence of dip-buying at lower levels
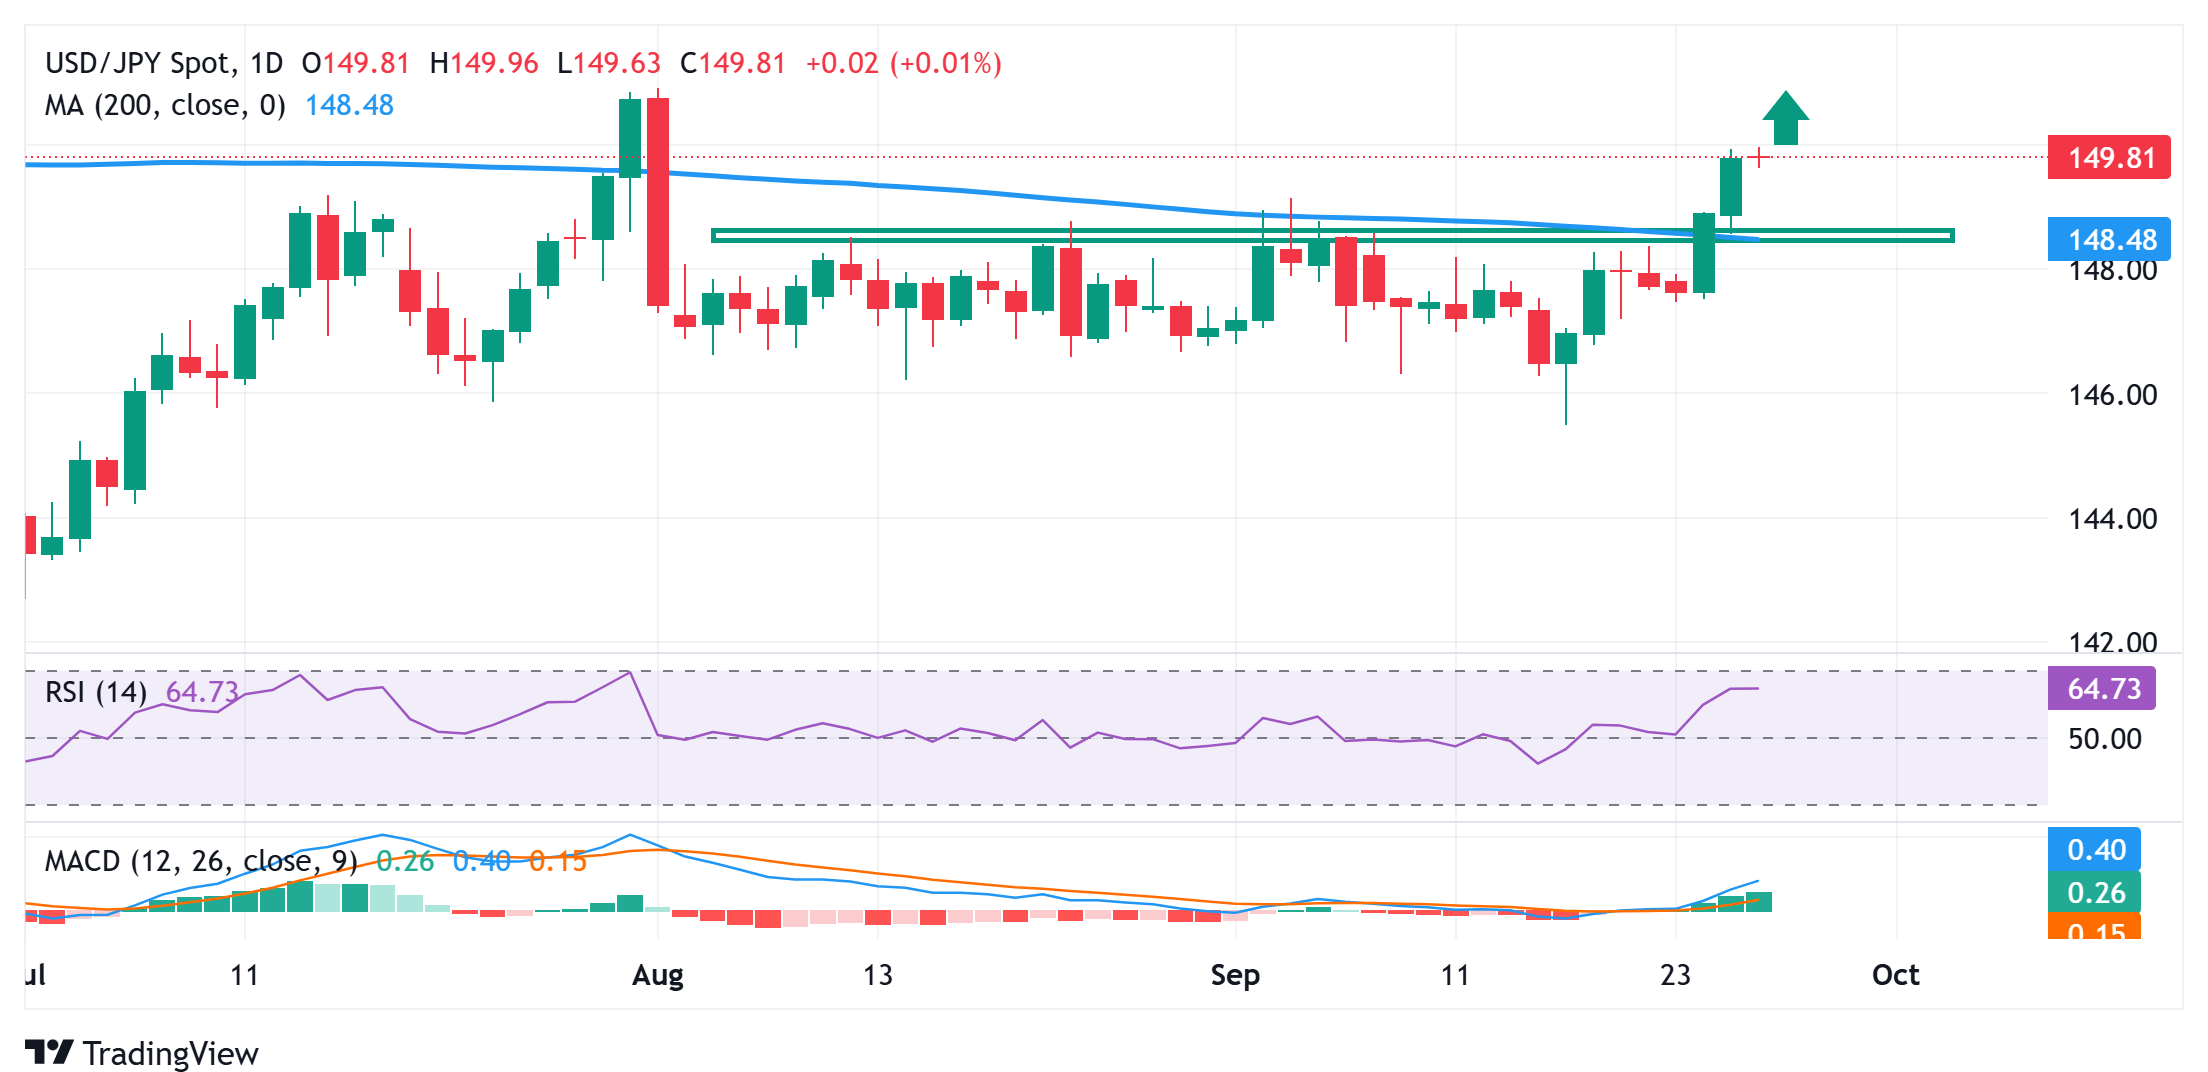
The USD/PY pair’s strong rise on Thursday reaffirmed this week’s breakout through a technically significant 200-day Simple Moving Average (SMA) hurdle. Given that oscillators on the daily chart are holding comfortably in positive territory and are still away from being in the overbought zone, some follow-through buying beyond the 150.00 psychological mark should pave the way for additional gains. Spot prices might then aim towards testing the August monthly swing high, around the 151.00 neighborhood, with some intermediate hurdle near the 150.55-150.60 region.
On the flip side, any meaningful corrective pullback might now find decent support and attract fresh buyers near the 149.15 region. This should help limit the downside for the USD/JPY pair near the 149.00 mark, which, if broken, could pave the way for a slide towards retesting the 200-day SMA, currently pegged near mid-148.00s. Failure to defend the said support levels might negate the near-term positive outlook and drag spot prices below the 148.00 round figure, towards testing the weekly swing low, around the 147.50-147.45 region.
Japanese Yen Price Today
The table below shows the percentage change of Japanese Yen (JPY) against listed major currencies today. Japanese Yen was the strongest against the US Dollar.
| USD | EUR | GBP | JPY | CAD | AUD | NZD | CHF | |
|---|---|---|---|---|---|---|---|---|
| USD | -0.12% | -0.07% | -0.19% | 0.02% | -0.15% | -0.04% | -0.09% | |
| EUR | 0.12% | 0.08% | 0.00% | 0.19% | 0.04% | 0.15% | 0.05% | |
| GBP | 0.07% | -0.08% | 0.00% | 0.09% | 0.04% | 0.06% | -0.06% | |
| JPY | 0.19% | 0.00% | 0.00% | 0.17% | 0.00% | 0.12% | -0.05% | |
| CAD | -0.02% | -0.19% | -0.09% | -0.17% | -0.17% | -0.02% | -0.17% | |
| AUD | 0.15% | -0.04% | -0.04% | -0.00% | 0.17% | 0.10% | -0.02% | |
| NZD | 0.04% | -0.15% | -0.06% | -0.12% | 0.02% | -0.10% | -0.01% | |
| CHF | 0.09% | -0.05% | 0.06% | 0.05% | 0.17% | 0.02% | 0.01% |
The heat map shows percentage changes of major currencies against each other. The base currency is picked from the left column, while the quote currency is picked from the top row. For example, if you pick the Japanese Yen from the left column and move along the horizontal line to the US Dollar, the percentage change displayed in the box will represent JPY (base)/USD (quote).


