Oil:
- Oil continues to recover losses after China and the U.S. reached an agreement to significantly reduce tariffs. Since hitting lows on May 5, oil prices have already rebounded by over 13%.
- Recently, there was a significant drop in the number of vessels traveling from China to the U.S., clearly indicating reduced demand for crude oil.
- However, the preliminary trade agreement provides hope for improved demand prospects. Leading global energy agencies expect demand conditions to gradually improve.
- The oil market remains very tight for the coming months, as illustrated by a strong backwardation structure extending through January. Contract rollover is scheduled for May 15, after which the opening price is expected to drop by around 50 cents.
- OPEC+ decided to proceed with its previously planned production increases, intending to boost output by another 411,000 barrels per day in June.
- Demand outlook in the U.S. remains robust. According to the American Automobile Association (AAA), nearly 40 million Americans plan road trips over the Memorial Day weekend, marking a 3.1% year-over-year increase. Gasoline prices are currently around 50 cents lower on average than a year ago, although they have gradually risen since the beginning of this year.
- U.S. crude inventories remain below last year’s levels and below the 5-year average. Seasonal declines in oil inventories started about two weeks earlier than usual this year.

The oil market remains exceptionally tight in the short term, illustrated by significant backwardation. Source: Bloomberg Finance LP, XTB.

Crude oil prices have bounced approximately 13% from their May 5 low. The price recently broke above the 25-period moving average and is heading toward the 50-period moving average. However, reaching this level before the May 15 rollover, which will reduce the price by approximately 50 cents, seems unlikely. Source: xStation5.
Natgas
- U.S. natural gas production reached 105.6 bcfd on Monday, representing a nearly 5% increase year-over-year. Demand was just 62.8 bcfd, roughly unchanged from last year’s levels.
- LNG exports reached 15.2 bcfd, up approximately 5% compared to the previous week.
- Last week’s storage injection totaled 104 bcf, exceeding market expectations and surpassing the 5-year average injection of 79 bcf.
- Currently, storage levels have risen above the 5-year average but remain around 15% below year-ago levels. If summer brings heightened demand from power plants and LNG exports rise towards 20 bcfd, inventories could again fall below the 5-year average.
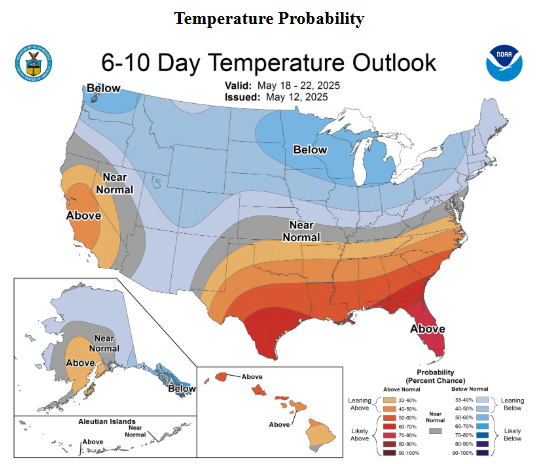
Temperatures across most U.S. states are currently near or slightly below average. However, key cooling regions like California, Texas, and Florida are forecast to experience above-normal temperatures. Despite this, short-term demand outlook remains moderate. Source: NOAA.
June natural gas contracts currently trade near $4 USD/MMBTU, with the forward curve flattening until October. Prices may rise during this period if storage rebuild rates remain insufficient—particularly due to elevated demand from power plants. Source: Bloomberg Finance LP, XTB.
Natural gas opened the week lower, pressured by weak demand and inventory levels climbing above the 5-year average. Nevertheless, summer outlook suggests a potentially slower inventory rebuild. Following the upcoming contract rollover (and possible gap closure), a new bullish phase may develop, consistent with typical seasonal patterns indicating upward momentum from mid-June. The second half of May, however, could see elevated volatility. Source: xStation5.
Cocoa:
- U.S. cocoa inventories continue to rise, exceeding 2.1 million bags. Conversely, European inventories have recently started to decline slightly.
- Cocoa deliveries to Ivory Coast ports rose by 24,180 tonnes, reaching 1.56 million tonnes—higher than the 1.4 million tonnes delivered by the same period last year.
- Cocoa processors still report issues regarding bean quality from Ivory Coast.
- Nestlé plans to raise prices for its products in the U.S. due to rising cocoa costs.
- Cocoa prices broke through the key resistance level at $9,400 per tonne and surpassed the Fibonacci 38.2% retracement level, currently testing a resistance zone linked to December and February local lows. Buyers’ next target could be resistance around $10,300 per tonne.

Cocoa inventories have risen rapidly since the start of the year, similar to patterns seen in 2020 and 2021—years when prices remained in sideways trends. Source: Bloomberg Finance LP, XTB.
The cocoa futures curve shifted upward across all maturities, particularly at the short end, highlighting continued market tightness regarding availability. Source: Bloomberg Finance LP, XTB.
Cocoa prices broke above crucial resistance associated with recent local peaks. The next important target for buyers could be the 50.0% Fibonacci retracement level near $10,300 per tonne. Source: xStation5.
Wheat
- Wheat prices plunged dramatically to new 5-year lows following the release of the May WASDE report and updated crop progress data.
- Monday’s USDA Crop Progress report indicated that spring wheat planting reached 66%, significantly above the 5-year average of 59%. Additionally, emergence rates were quicker than normal.
- Winter wheat condition ratings improved to 54% rated “good or excellent,” up from 51% reported in the previous week.
- The recent WASDE report forecasted wheat production at 1.921 billion bushels for the 2025/26 season—far exceeding market expectations and closely matching last year’s level

The wheat futures curve remains in clear contango. The sharper decline at the short end of the curve signals expectations of significant oversupply. Source: Bloomberg Finance LP, XTB.
Following the latest WASDE data, wheat prices declined to their lowest level in five years. Source: Bloomberg Finance LP, XTB.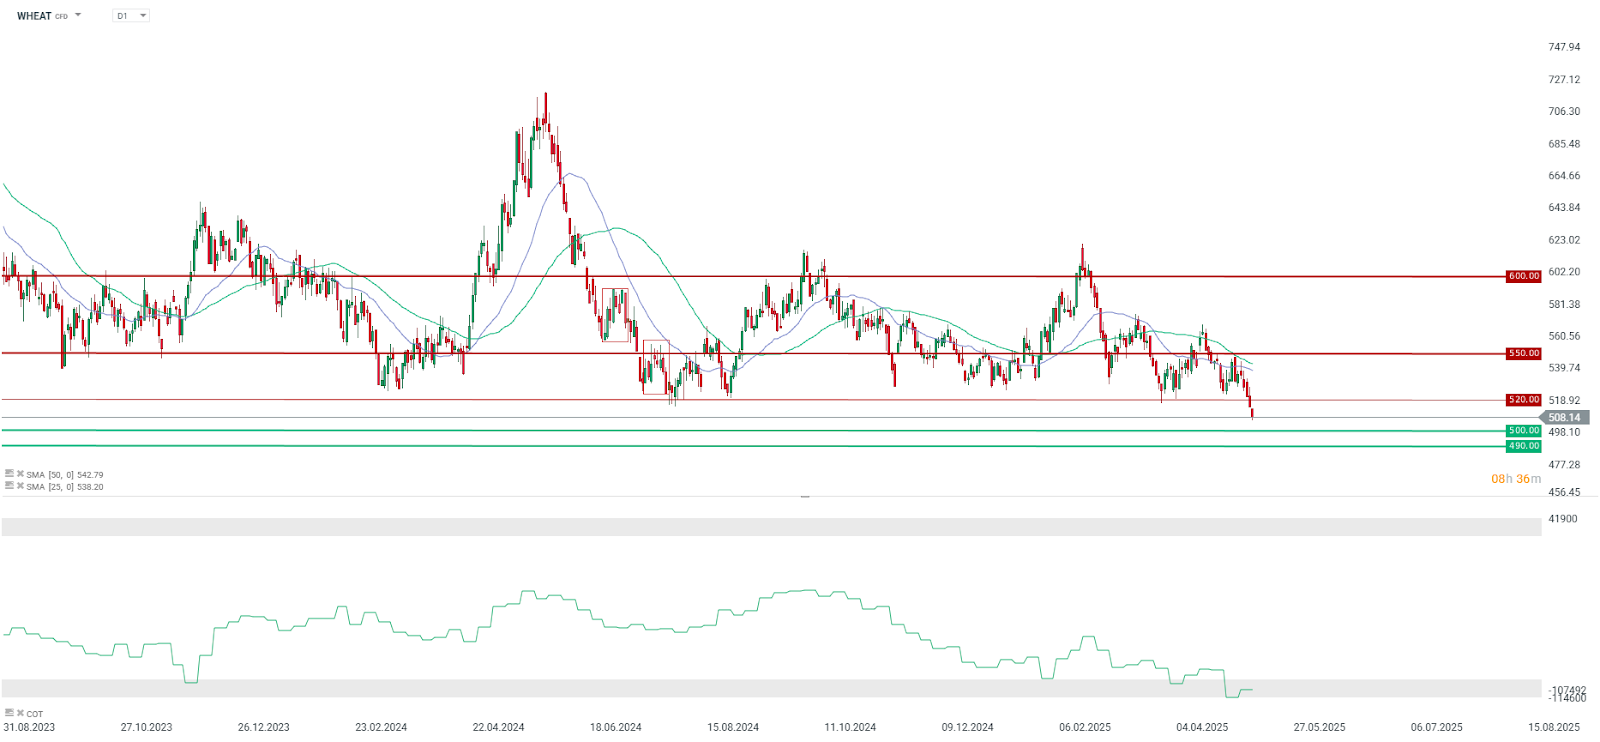
Wheat reached its lowest point since 2020, approaching critical support at 500 cents per bushel. Source: xStation5.
Recently, there has been a significant build-up in short positions, causing the net positions to reach oversold territory. Historically, similar oversold levels were observed in 2017 and 2018, and while these were contrarian signals, the actual price rebound did not occur until 2020. Source: Bloomberg Finance LP, XTB.
The material on this page does not constitute financial advice and does not take into account your level of understanding, investment objectives, financial situation or any other specific needs. All information provided, including opinions, market research, mathematical results and technical analyzes published on the Website or transmitted To you by other means, it is provided for information purposes only and should in no way be construed as an offer or solicitation for a transaction in any financial instrument, nor should the information provided be construed as advice of a legal or financial nature on which any investment decisions you make should be based exclusively To your level of understanding, investment objectives, financial situation, or other specific needs, any decision to act on the information published on the Website or sent to you by other means is entirely at your own risk if you In doubt or unsure about your understanding of a particular product, instrument, service or transaction, you should seek professional or legal advice before trading. Investing in CFDs carries a high level of risk, as they are leveraged products and have small movements Often the market can result in much larger movements in the value of your investment, and this can work against you or in your favor. Please ensure you fully understand the risks involved, taking into account investments objectives and level of experience, before trading and, if necessary, seek independent advice.


