Mexican Peso plunges as US-China trade war escalates, Powell pushes back on rate cuts
- Mexican Peso tanks as USD/MXN spikes to 20.45 after China retaliates with 34% tariffs
- China strikes back with 34% duties on US goods; Trump’s fiery response heightens market tensions.
- JPMorgan raises US recession odds to 60%; strong jobs report and Powell’s hawkish tone fuel USD strength.
The Mexican Peso (MXN) depreciates sharply against the US Dollar (USD) on Friday, erasing Thursday’s gains, which drove the exchange rate below the crucial 20.00 figure towards testing the 200-day Simple Moving Average (SMA) at 19.78. The escalation of the trade war between the United States (US) and China and goodish data from the US drive the rally in USD/MXN, which trades at 20.45, up more than 2.60%.
Risk aversion is the name of the game in the financial markets. Earlier, China announced that it would impose tariffs of 34% on all US goods as retaliation for Trump’s decision. This was followed by Trump’s reaction, in which he posted, “CHINA PLAYED IT WRONG; THEY PANICKED – THE THING THEY CANNOT AFFORD TO DO!” on his Truth Social network.
In the meantime, a strong US jobs report did nothing to fade global recession fears, even though the Unemployment Rate ticked up. Friday’s data, along with Federal Reserve (Fed) Chair Jerome Powell’s hawkish tilt, boosted the Greenback despite falling US Treasury yields.
JPMorgan Chase has increased its probability of a recession in the US to 60%, blaming tariffs announced by Trump, a 20 percentage point rise since March.
US equities are feeling the pain, posting substantial losses as the Volatility Index (VIX) hit an eight-month peak at 45.56, a level last seen in August 2024.
In Mexico, Consumer Confidence in March deteriorated, as revealed by the Instituto Nacional de Estadística Geografía e Informática (INEGI). Even though President Claudia Sheinbaum was optimistic about the US tariff treatment of Mexico, the market mood weighed on the Peso.
Next week, Mexico’s economic docket will feature the Banco de Mexico’s (Banxico) last meeting minutes and inflation data. Across the northern border, the US schedule will feature Fed speakers, the latest Federal Open Market Committee (FOMC) minutes, and the release of inflation numbers on the consumer and producer side.
Daily digest market movers: Mexican Peso hit by Powell hawkish tilt
- Mexico’s Consumer Confidence deteriorated in March. INEGI revealed the index fell from 46.3 to 46.
- Banxico’s Governor, Victoria Rodríguez Ceja, stated that the central bank will remain attentive to US trade policies and their impact on the country, with a primary focus on inflation, as she noted in an interview with El Financiero.
- Data-wise, Nonfarm Payrolls for March in the US exceeded estimates of 135K, with figures rising to 228K, significantly surpassing February’s 151K.
- US Unemployment Rate edged up from 4.1% to 4.2%, according to Bloomberg, which noted that “it was mostly a rounding error.”
- Federal Reserve Chair Jerome Powell stated that the current monetary policy is well-positioned to allow the Fed to wait for greater clarity before making any adjustments. He warned that tariffs are likely to push inflation higher in the coming quarters, with the possibility of more persistent effects over time.
- Regarding the economic outlook, Powell acknowledged that while the economy remains in a strong position, uncertainty has increased and downside risks are mounting, underscoring a more cautious tone from the central bank.
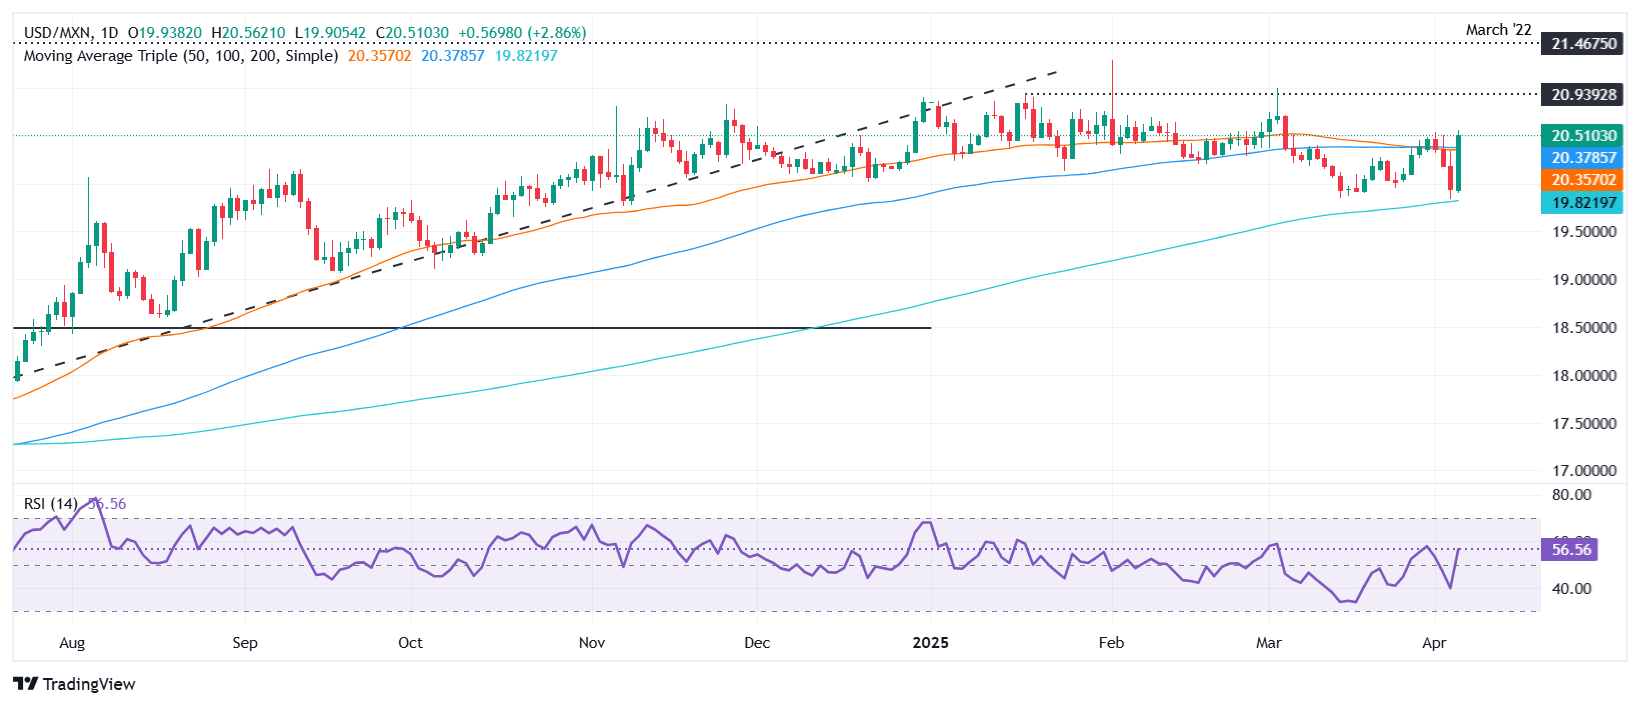
USD/MXN technical outlook: Mexican Peso treads water as USD/MXN climbs above 20.40
USD/MXN uptrend remains intact after briefly testing the 200-day Simple Moving Average (SMA) on Thursday, before buyers reclaimed the 20.00 mark. As the exotic pair has hit a new weekly high, the bulls’ outlook looks constructive.
Notably, the Relative Strength Index (RSI) has turned bullish, indicating that buyers are gaining momentum.
Therefore, the first resistance for USD/MXN will be the March 4 peak at 20.99. A breach of the latter will expose 21.00, followed by the February 3 high of 21.28. Conversely, the first support is the confluence of the 50 and 100-day Simple Moving Averages (SMAs) around 20.35/36, followed by the 20.00 mark. A breach of the latter will expose the 200-day SMA at 19.76.