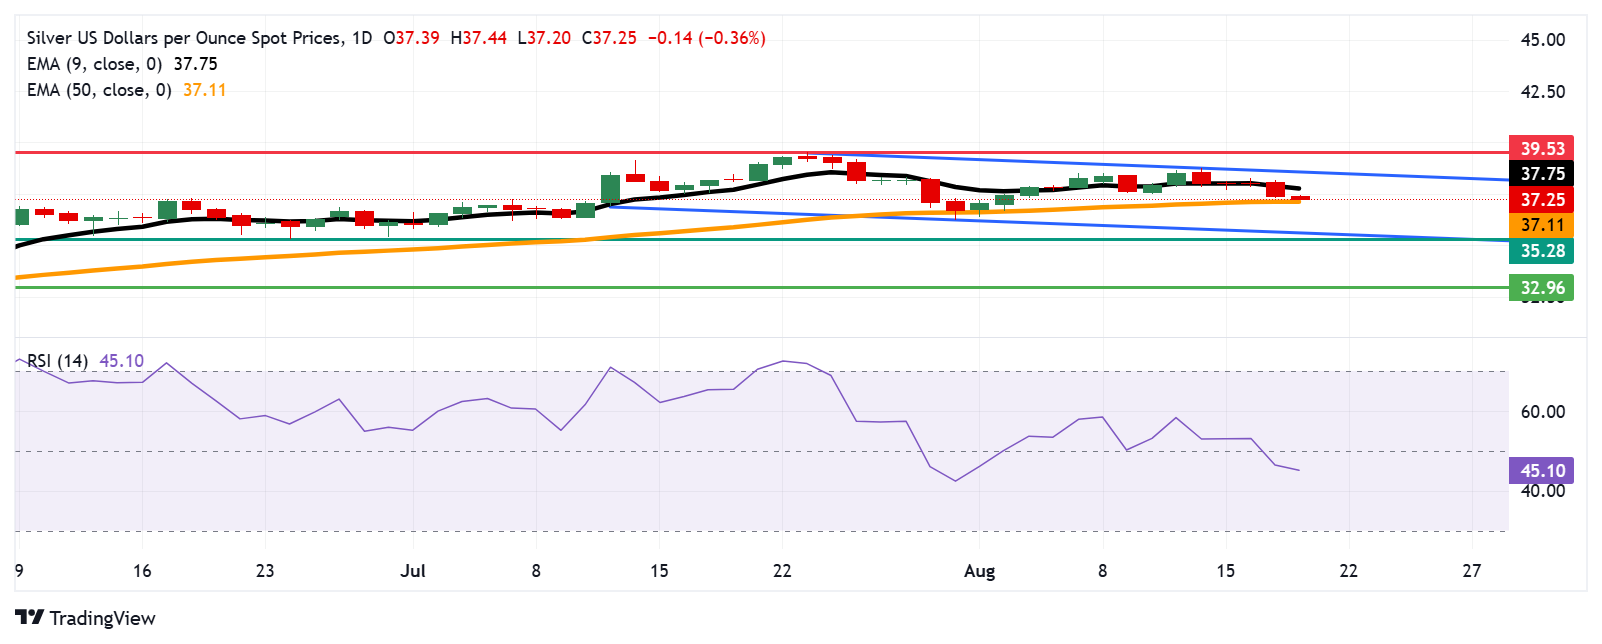
Silver Price Forecast: XAG/USD dips toward 50-day EMA near $37.00
- Silver price may test the immediate support at the 50-day EMA of $37.11.
- The bearish bias strengthens as the 14-day Relative Strength Index remains below the 50 level.
- The primary barrier appears at the nine-day EMA of $37.75.
Silver price (XAG/USD) extends its losing streak for the fifth consecutive session, trading around $37.20 per troy ounce during the Asian hours on Wednesday. The technical analysis of the daily chart suggests the price of the precious metal consolidates within a descending channel pattern, indicating a prevailing bearish bias.
The 14-day Relative Strength Index (RSI) is positioned below the 50 level, strengthening the bearish bias. Additionally, the Silver price is trading below the nine-day Exponential Moving Average (EMA), indicating that short-term price momentum is weaker.
On the downside, the Silver price may target the immediate support at the 50-day EMA of $37.11. A break below this level would weaken the medium-term price momentum and put downward pressure on the XAG/USD pair to the descending channel’s lower boundary around $35.70, followed by the 11-week low at $35.28, recorded on June 24. Further declines would strengthen the bearish bias and prompt the Silver price to a three-month low at $32.96.
The XAG/USD pair may find its initial barrier at the nine-day EMA of $37.75, followed by the upper boundary of the descending channel around $38.70. A break above this crucial resistance zone could cause the emergence of the bullish bias and support the Silver price to explore the region around $39.53, the highest since September 2011, reached on July 23.
XAG/USD: Daily Chart


