Silver Price Forecast: XAG/USD wobbles near $38.00 as trade optimism dulls safe-haven demand
- Silver trades flat near $38.00 in Monday’s European session, pressured by improving global risk sentiment.
- A bullish cup and handle pattern on the 4-hour chart was invalidated Friday as the price broke below the $38.70 handle support.
- On a 4-hour chart, RSI is hovering near oversold levels at 32.00; ADX rises to 36.86, signaling strong bearish momentum.
Silver (XAG/USD) is treading water near $38.00 on Monday, struggling to regain momentum after last week’s technical breakdown. Although prices are holding steady on the day, broader market sentiment is weighing on the metal. With global trade optimism on the rise, particularly the US-EU trade agreement, investors are shifting their focus to risk assets and stepping away from traditional safe havens, such as Silver.
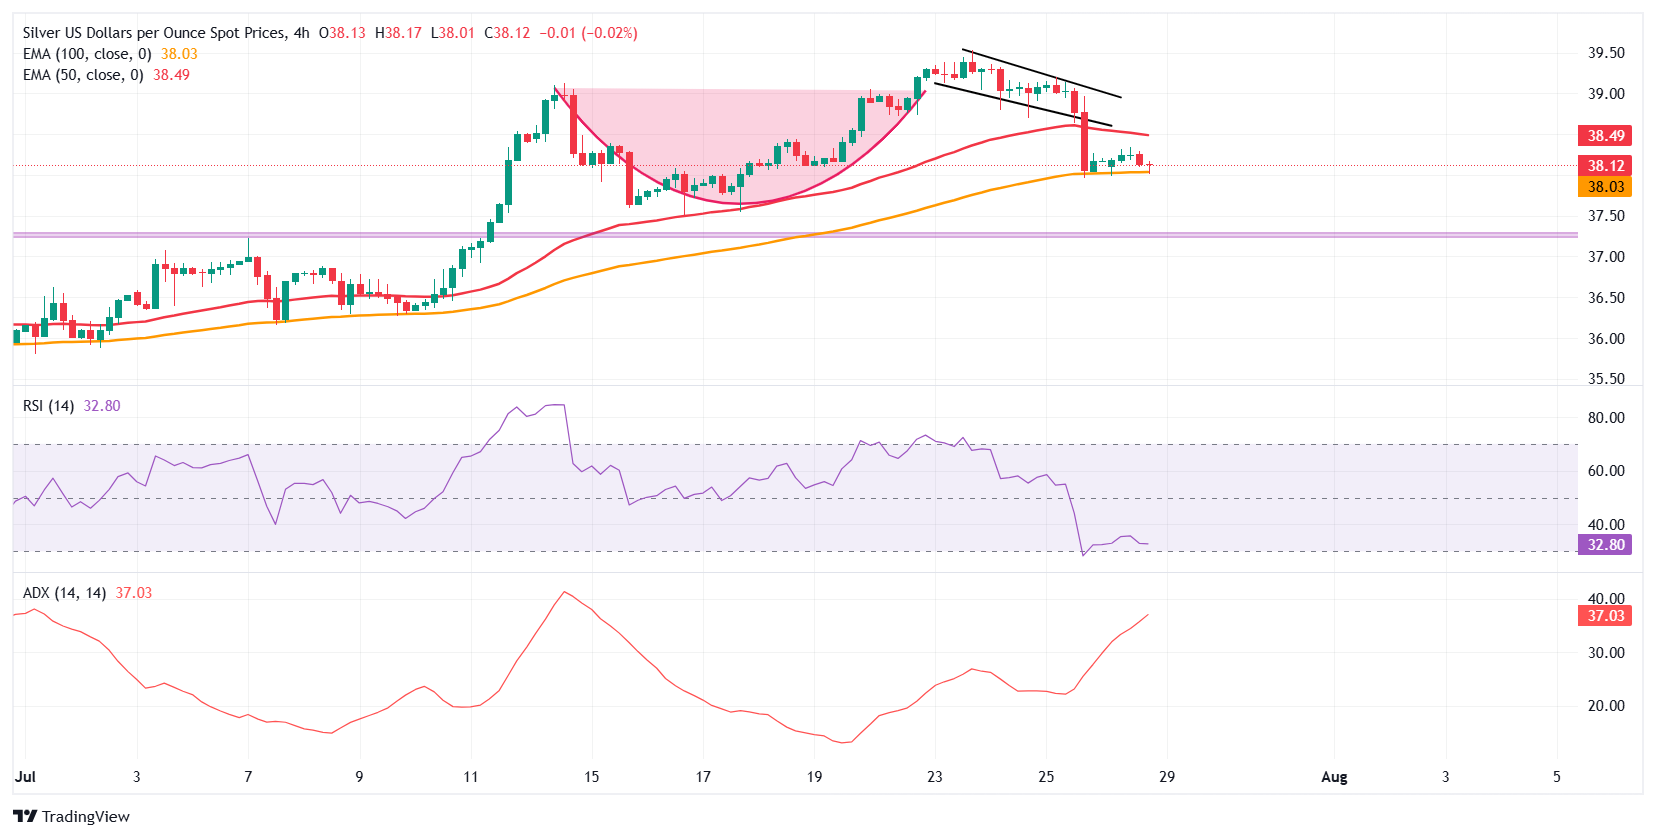
The sluggish action comes after a failed bullish setup on the 4-hour chart. A cup and handle pattern had been forming throughout last week, typically a bullish continuation signal, but that pattern broke down on Friday. Price slipped below the lower edge of the handle at around $38.70, turning the near-term outlook more bearish.
Following Friday’s decline of more than 2.0%, the spot price has dipped below the 50-period Exponential Moving Average (EMA), which stands around $38.49, and is now testing the 100-period EMA near $38.03. Momentum indicators are also backing the downside pressure. The Relative Strength Index (RSI) currently sits at 32.00, just above the oversold territory, while the Average Directional Index (ADX) has climbed to 36.86, indicating strong directional momentum favoring further downside. Immediate support lies at the psychological $38.00 level, followed by the July 16 low at $37.50, a key level to watch for potential breakdown or bounce.
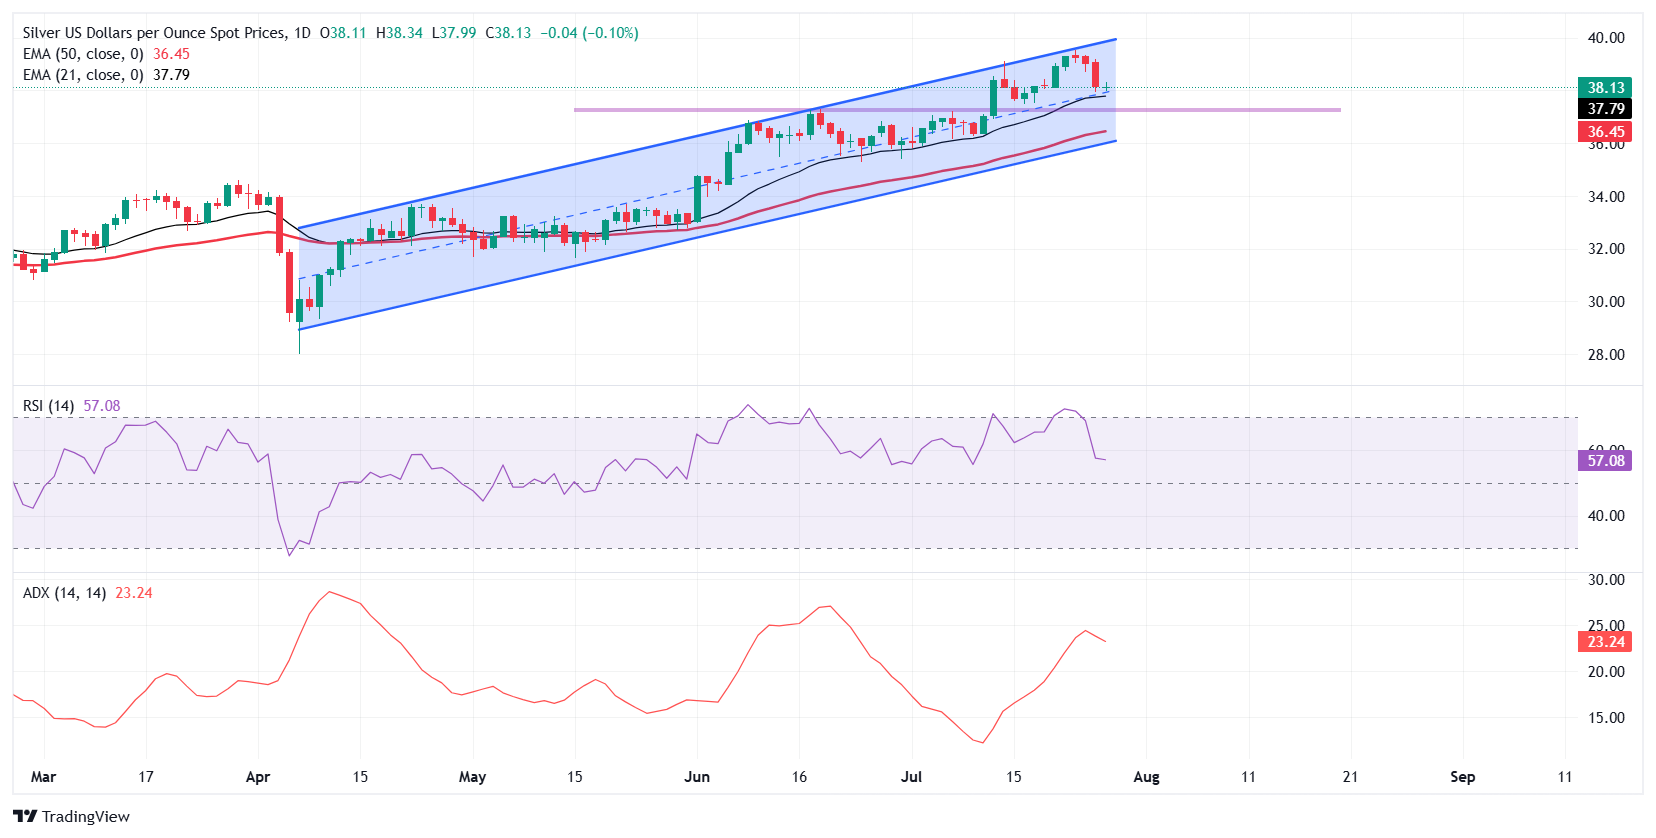
Zooming out on the daily timeframe, though, the bigger picture still leans bullish. Silver remains within a rising price channel that’s been in place since April. The metal is also holding above both the 21-day EMA at $37.78 and the 50-day EMA at $36.45, suggesting that medium-term buyers haven’t given up yet. On the daily chart, RSI is still healthy at 56.72, and the ADX remains subdued at 23.24, so the uptrend structure is still intact, for now.
Overall, while the long-term bullish setup remains valid, the invalidated cup and handle formation on the lower timeframe adds near-term caution. A sustained move below $37.50 could pave the way for a deeper pullback toward the $36.40-$36.00 region, where the 50-day EMA and the lower boundary of the ascending channel converge. On the other hand, a decisive recovery above $38.50 is necessary to restore bullish momentum and open the door for a potential retest of the 14-year highs at $39.53.


