The AUD remains subdued due to lacking clarity on Trump’s tariff plans
- The Australian Dollar declines against the US Dollar as solid US labor market data weaken hopes of Fed rate cuts.
- The House of Representatives passed President Trump’s “One Big Beautiful Bill Act, and sent it to him for signing into law.
- The US Nonfarm Payrolls came in at 147,000 new jobs added in June, exceeding the expected 110,000.
The Australian Dollar (AUD) extends its losses against the US Dollar (USD) on Friday, as stronger-than-expected US job growth and a surprise drop in the unemployment rate data overshadow investors’ hopes for a Federal Reserve (Fed) interest rate cut.
The US Nonfarm Payrolls (NFP) report took center stage on Thursday, as it fell on a shortened week in observance of the US Independence Day. However, markets appear more focused on the broader trend, with political and fiscal concerns deterring investors. Strong jobs numbers might typically support the US Dollar and put downward pressure on the AUD/USD pair.
The Chinese Commerce Ministry said in a statement on Friday that “China and the US are stepping up efforts to implement the outcomes of the London framework.” The US has notified China of canceling restrictive measures against Chinese exports. China is reviewing applications for export licenses of controlled items under laws and regulations.
Traders will likely observe the upcoming monthly household spending indicator from Australia, due later in the day. The focus will shift toward the Reserve Bank of Australia’s (RBA) monetary policy meeting next week. Markets broadly anticipate a 25 basis point rate cut, which would lower the cash rate to 3.60%.
Australian Dollar declines against US Dollar following labor market data
- The US Dollar Index (DXY), which measures the value of the US Dollar against six major currencies, is trading lower at around 97.00 at the time of writing. Traders seek clarity on US President Donald Trump’s plans for tariffs on various countries.
- On Thursday, Trump told reporters that he “will begin sending letters on trade tariffs starting Friday.” He added that he would send letters to 10 countries at a time, laying out tariff rates of 20% to 30%, reported by Reuters.
- President Trump’s “one, big, beautiful” tax bill passed the House of Representatives and was sent to him for signing into law. The legislation includes significant tax cuts designed to stimulate economic growth. Trump hailed the bill’s passage on Truth Social, calling it a “historic victory for American workers, families, and businesses.”
- NFP indicated that the US labor force grew by 147,000 jobs, surpassing the anticipated 110,000 in June. Additionally, the Unemployment Rate declined to 4.1% from 4.2%. Meanwhile, weekly Jobless Claims fell to 233,000, down from 237,000, reflecting a resilient US labor market.
- US ADP Employment Change fell for the first time in more than two years in June. The private-sector payrolls decreased by 33,000 in June after a downwardly revised 29,000 gain in May. This figure came in below the market consensus of 95,000.
- US ISM Manufacturing PMI advanced to 49.0 from 48.5 in May, coming in above experts’ expectations of 48.8. The readings indicated that economic activity in the United States (US) manufacturing sector improved in June. Meanwhile, US JOLTS Job Openings rose to 7.76 million in May, compared to 7.395 million reported in April. This figure came in above the market expectation of 7.3 million.
- In Australia’s close trading partner, China, Caixin Services PMI declined to 50.6 in June from 51.1 in May, missing the market forecast of 51.0. China’s Caixin Manufacturing Purchasing Managers’ Index improved to 50.4 in June from 48.3 in May, according to the latest data released on Tuesday. The reading surpassed the market forecast of 49.0.
- Australian Bureau of Statistics (ABS) reported that trade surplus narrowed to 2,238M month-over-month in May, against 5,091M expected and 4,859M (revised from 5,431M) in April. Meanwhile, Exports fell by 2.7% MoM from -1.7% (revised from -2.4%) prior. Imports increased by 3.8% MoM, against the previous increase of 1.6% (revised from 1.1%).
- The S&P Global Australia Composite Purchasing Managers’ Index (PMI) climbed to 51.6 in June from the previous reading of 50.5. The reading has marked a ninth successive month of growth and the fastest pace since March. Meanwhile, Services PMI rose to 51.8 from 50.6 prior, indicating the fastest pace of expansion since May 2024.
- The Australian Bureau of Statistics (ABS) showed that Retail Sales rose 0.2% month-over-month in May, compared to a flat 0% in April (revised from -0.1%). The reading came in below the market expectations of 0.4%. Meanwhile, Building Permits rose by 3.2% in May, as compared to the previous decline of 4.1%, but fell short of the expected 4.8% increase.
- Australia’s S&P Global Manufacturing Purchasing Managers’ Index (PMI) fell to 50.6 in June from the previous 51.0. The output declined to its lowest reading since February due to adequate client inventories and weaker market conditions, data showed on Tuesday.
Australian Dollar remains below eight-month highs near 0.6600
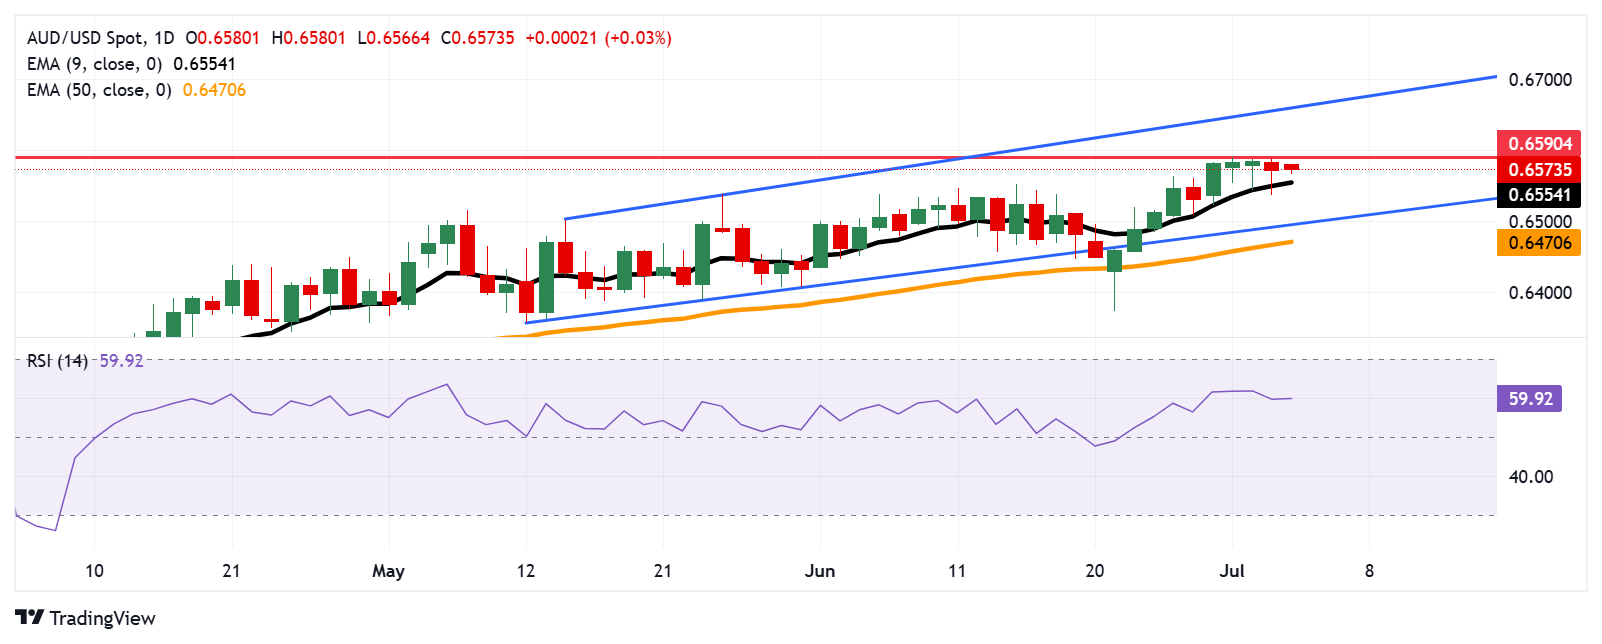
AUD/USD is trading around 0.6570 on Friday. The technical analysis of the daily chart suggests a prevailing bullish bias as the pair moves upwards within the ascending channel pattern. The 14-day Relative Strength Index (RSI) remains above the 50 mark, reinforcing the bullish sentiment. Additionally, the pair stays above the nine-day Exponential Moving Average (EMA), suggesting that short-term price momentum is stronger.
On the upside, the AUD/USD pair could retest the eight-month high of 0.6590, which was marked on July 1. A successful breach above this level could support the pair to test the upper boundary of the ascending channel around 0.6660.
The nine-day EMA at 0.6553 appears as the primary support. A break below this level would weaken the short-term price momentum and put downward pressure on the AUD/USD pair to test the lower boundary of the ascending channel around 0.6500, aligned with the 50-day EMA at 0.6470.
AUD/USD: Daily Chart
Australian Dollar PRICE Today
The table below shows the percentage change of Australian Dollar (AUD) against listed major currencies today. Australian Dollar was the weakest against the Japanese Yen.
| USD | EUR | GBP | JPY | CAD | AUD | NZD | CHF | |
|---|---|---|---|---|---|---|---|---|
| USD | -0.19% | -0.18% | -0.39% | -0.08% | 0.07% | -0.04% | -0.30% | |
| EUR | 0.19% | 0.04% | -0.17% | 0.14% | 0.14% | 0.13% | -0.07% | |
| GBP | 0.18% | -0.04% | -0.22% | 0.10% | 0.12% | 0.10% | -0.11% | |
| JPY | 0.39% | 0.17% | 0.22% | 0.32% | 0.32% | 0.27% | -0.01% | |
| CAD | 0.08% | -0.14% | -0.10% | -0.32% | -0.00% | -0.00% | -0.21% | |
| AUD | -0.07% | -0.14% | -0.12% | -0.32% | 0.00% | -0.06% | -0.23% | |
| NZD | 0.04% | -0.13% | -0.10% | -0.27% | 0.00% | 0.06% | -0.21% | |
| CHF | 0.30% | 0.07% | 0.11% | 0.01% | 0.21% | 0.23% | 0.21% |
The heat map shows percentage changes of major currencies against each other. The base currency is picked from the left column, while the quote currency is picked from the top row. For example, if you pick the Australian Dollar from the left column and move along the horizontal line to the US Dollar, the percentage change displayed in the box will represent AUD (base)/USD (quote).


