USD/CAD Price Forecast: Hangs near two-week low, seems vulnerable around 1.3600
- USD/CAD consolidates its recent losses to over a two-week low touched on Wednesday.
- The technical setup favors bearish traders and backs the case for a further depreciation.
- Any attempted recovery might still be seen as a selling opportunity and remain capped.
The USD/CAD pair enters a bearish consolidation phase during the Asian session and oscillates in a narrow trading band around the 1.3600 mark, near a two-week low touched earlier this Wednesday.
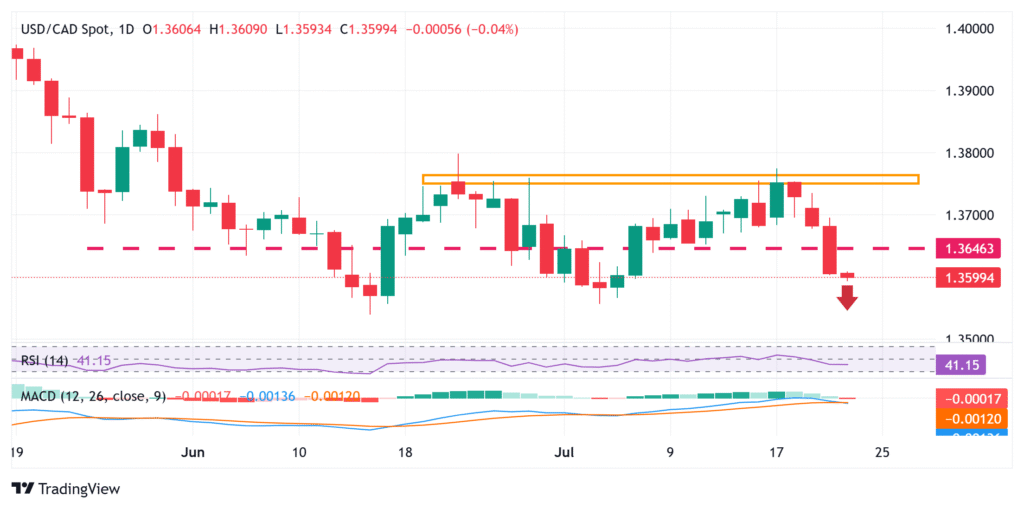
From a technical perspective, the overnight breakdown below the 1.3650 horizontal support was seen as a fresh trigger for the USD/CAD bears. Moreover, oscillators on the daily chart have just started gaining negative traction and suggest that the path of least resistance for spot prices remains to the downside. Some follow-through selling below the 1.3575 horizontal support will reaffirm the negative bias and expose the year-to-date low, around the 1.3540-1.3535 region touched in June.
The downward trajectory could extend further towards the 1.3500 psychological mark. A convincing break below the latter would set the stage for the resumption of the prior well-established descending trend from the vicinity of the 1.4800 mark, or over a two-decade high touched in February.
On the flip side, any attempted recovery might now confront immediate resistance near the 1.3650 support breakpoint. A further move up could be seen as a selling opportunity and remain capped near the 1.3700 round figure. A sustained strength beyond the latter, however, might trigger a short-covering rally and lift the USD/CAD pair to the monthly swing high, around the 1.3775 zone. Some follow-through buying might then negate the negative outlook and pave the way for additional gains.
USD/CAD daily chart
US Dollar PRICE This week
The table below shows the percentage change of US Dollar (USD) against listed major currencies this week. US Dollar was the strongest against the Japanese Yen.
| USD | EUR | GBP | JPY | CAD | AUD | NZD | CHF | |
|---|---|---|---|---|---|---|---|---|
| USD | -0.89% | -0.82% | -0.71% | -0.85% | -0.78% | -0.74% | -0.95% | |
| EUR | 0.89% | 0.15% | 0.21% | 0.02% | 0.08% | -0.02% | -0.10% | |
| GBP | 0.82% | -0.15% | -0.16% | -0.08% | -0.04% | 0.04% | -0.05% | |
| JPY | 0.71% | -0.21% | 0.16% | -0.15% | -0.04% | -0.09% | -0.09% | |
| CAD | 0.85% | -0.02% | 0.08% | 0.15% | 0.14% | 0.12% | -0.15% | |
| AUD | 0.78% | -0.08% | 0.04% | 0.04% | -0.14% | -0.02% | -0.07% | |
| NZD | 0.74% | 0.02% | -0.04% | 0.09% | -0.12% | 0.02% | -0.10% | |
| CHF | 0.95% | 0.10% | 0.05% | 0.09% | 0.15% | 0.07% | 0.10% |
The heat map shows percentage changes of major currencies against each other. The base currency is picked from the left column, while the quote currency is picked from the top row. For example, if you pick the US Dollar from the left column and move along the horizontal line to the Japanese Yen, the percentage change displayed in the box will represent USD (base)/JPY (quote).


