USD/CNH Price Remains above 7.3500 near two-year highs
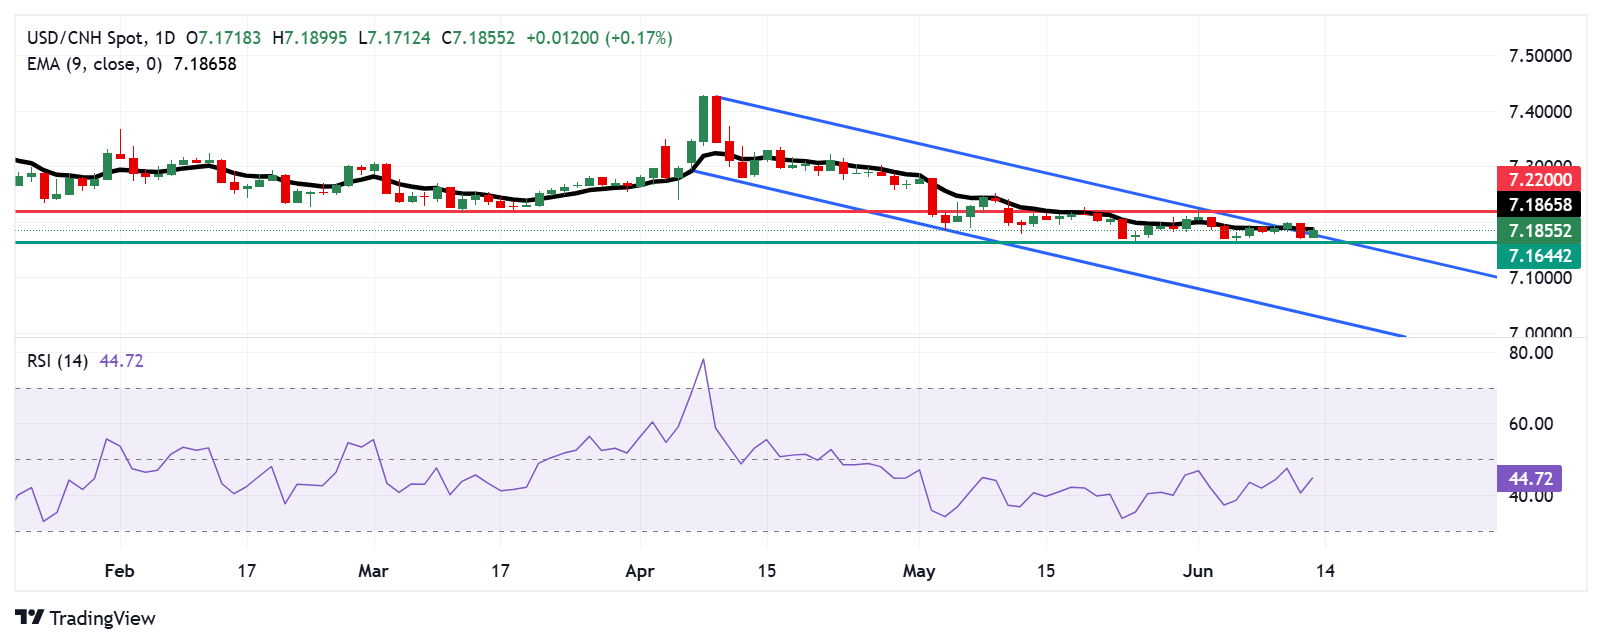
- USD/CNH tests the immediate barrier at the upper boundary of the descending channel.
- The 14-day Relative Strength Index remains below the 50 level, indicating an ongoing bearish bias.
- The initial support appears at the seven-month low of 7.1644.
The USD/CNH pair recovers its recent losses registered in the previous session, trading around 7.1860 during the Asian hours on Friday. An analysis of the daily chart indicates that the pair price testing to break above the descending channel pattern, which points to a weakening bearish trend.
However, the 14-day Relative Strength Index (RSI), a key momentum indicator, still holds below the 50 level, suggesting an ongoing bearish momentum. Additionally, the USD/CNH pair trades below the nine-day Exponential Moving Average (EMA), further suggesting weaker short-term price momentum.
On the upside, the upper boundary of the descending channel appears as the immediate resistance, aligned with the nine-day EMA at 7.1865. A break above this crucial resistance zone would cause the emergence of the bullish bias and support the USD/CNH pair to retest the “pullback resistance” around 7.2200.
The USD/CNH pair could target the primary support at the seven-month low of 7.1644, which was recorded on June 5. A break below this could reinforce the bearish bias and put downward pressure on the pair to navigate the region around the descending channel’s lower boundary at 7.0350.
USD/CNH: Daily Chart

US Dollar PRICE Today
The table below shows the percentage change of US Dollar (USD) against listed major currencies today. US Dollar was the strongest against the New Zealand Dollar.
| USD | EUR | GBP | JPY | CAD | AUD | NZD | CHF | |
|---|---|---|---|---|---|---|---|---|
| USD | 0.42% | 0.44% | 0.01% | 0.26% | 0.80% | 0.88% | -0.04% | |
| EUR | -0.42% | 0.07% | -0.35% | -0.09% | 0.47% | 0.44% | -0.46% | |
| GBP | -0.44% | -0.07% | -0.49% | -0.24% | 0.32% | 0.35% | -0.51% | |
| JPY | -0.01% | 0.35% | 0.49% | 0.29% | 0.82% | 0.87% | -0.03% | |
| CAD | -0.26% | 0.09% | 0.24% | -0.29% | 0.52% | 0.63% | -0.27% | |
| AUD | -0.80% | -0.47% | -0.32% | -0.82% | -0.52% | 0.05% | -0.82% | |
| NZD | -0.88% | -0.44% | -0.35% | -0.87% | -0.63% | -0.05% | -0.87% | |
| CHF | 0.04% | 0.46% | 0.51% | 0.03% | 0.27% | 0.82% | 0.87% |
The heat map shows percentage changes of major currencies against each other. The base currency is picked from the left column, while the quote currency is picked from the top row. For example, if you pick the US Dollar from the left column and move along the horizontal line to the Japanese Yen, the percentage change displayed in the box will represent USD (base)/JPY (quote).


