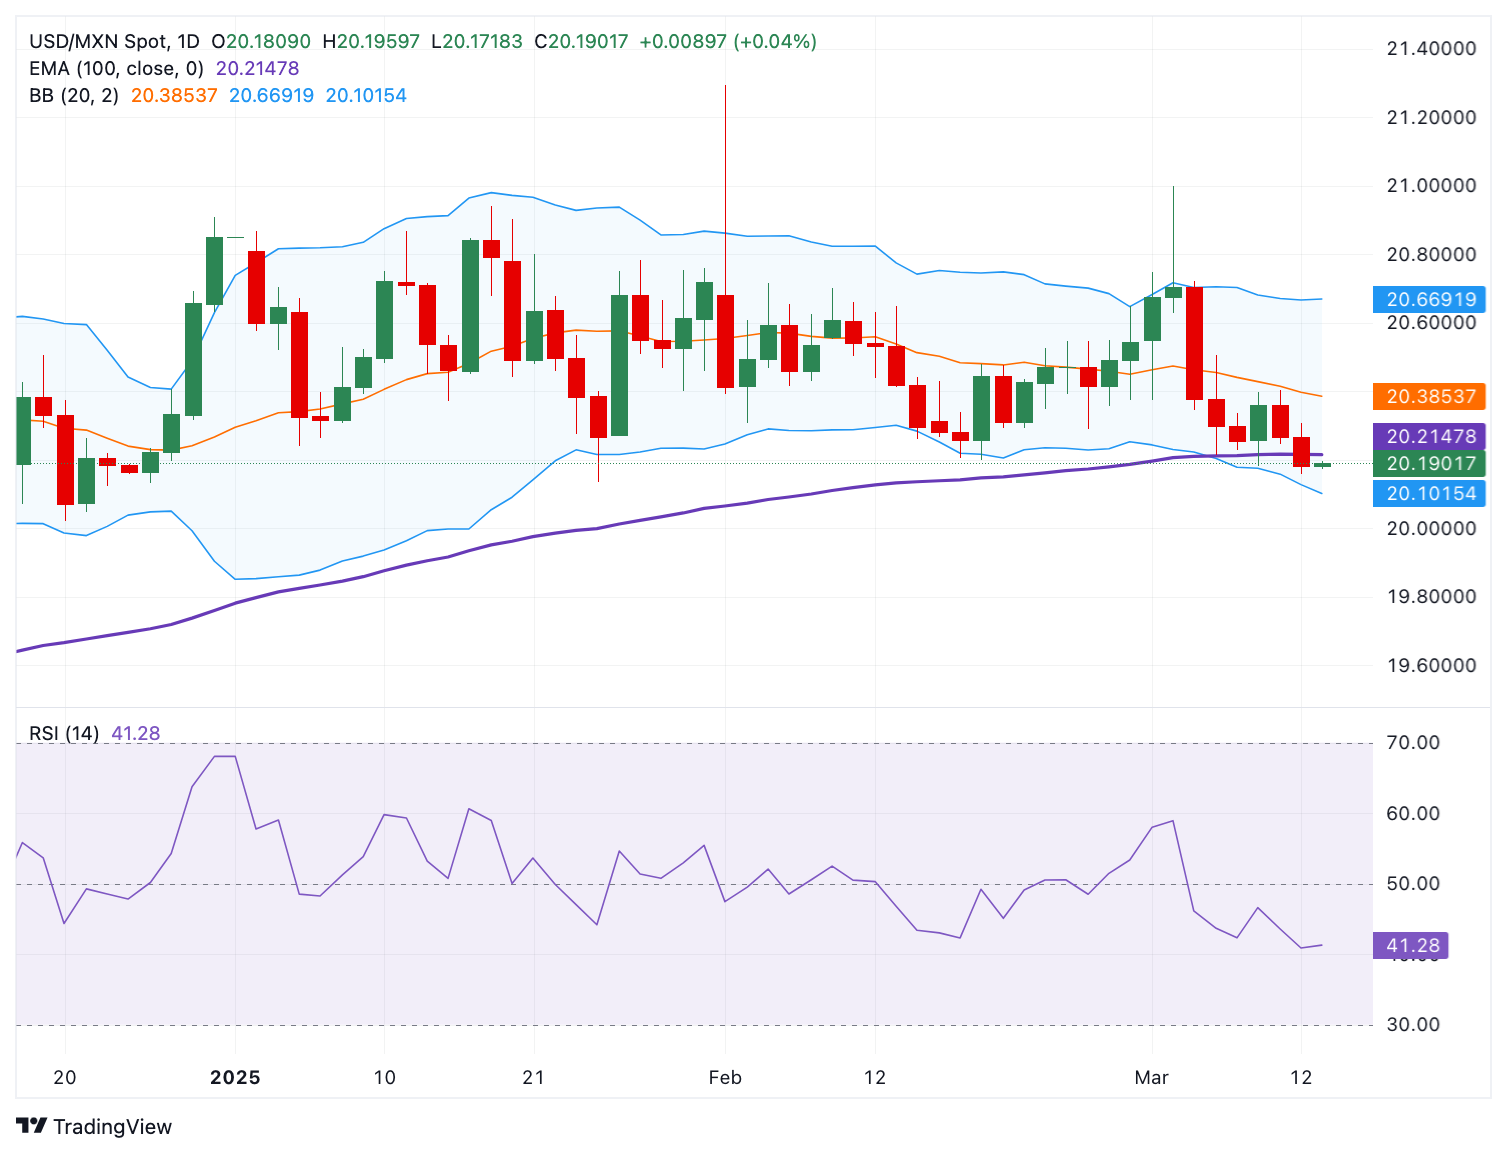
- USD/MXN trades in positive territory around 20.20 in Thursday’s early European session.
- The pair resumes its downside as the pair is below the 100-day EMA with a bearish RSI indicator.
- The first downside target to watch is the 20.10-20.00 region; the immediate resistance level emerges at 20.40.
The USD/MXN pair edges higher to near 20.20 during the early European session on Thursday, bolstered by a modest recovery of the US Dollar (USD). However, Mexico’s strong external accounts, including a trade surplus and robust remittances, might boost the Mexican Peso (MXN) and create a headwind for the pair in the near term.
Technically, EUR/USD resumes its downside journey after crossing below the key 100-day Exponential Moving Average (EMA) on the daily chart. Additionally, the downward momentum is supported by the 14-day Relative Strength Index (RSI), which is located below the midline around 41.40, indicating that the path to the least resistance level is to the downside.
The initial support level for USD/MXN emerges at the 20.10-20.00 zone, representing the lower limit of the Bollinger Band and the psychological level. A breach of this level could expose 19.25, the low of October 11, 2024. Extended losses could push prices lower toward 18.60, the low of October 16, 2024.
On the upside, the first upside barrier is seen at 20.40, the high of March 11. Sustained bullish momentum could see a rally to 20.66, the upper boundary of the Bollinger Band. Further north, the next hurdle to watch is the 21.00 psychological level.
USD/MXN daily chart