XAG/USD breaks below $32.00 with developing bearish bias
- Silver may fluctuate around the eight-month low of $28.00, last touched on April 7.
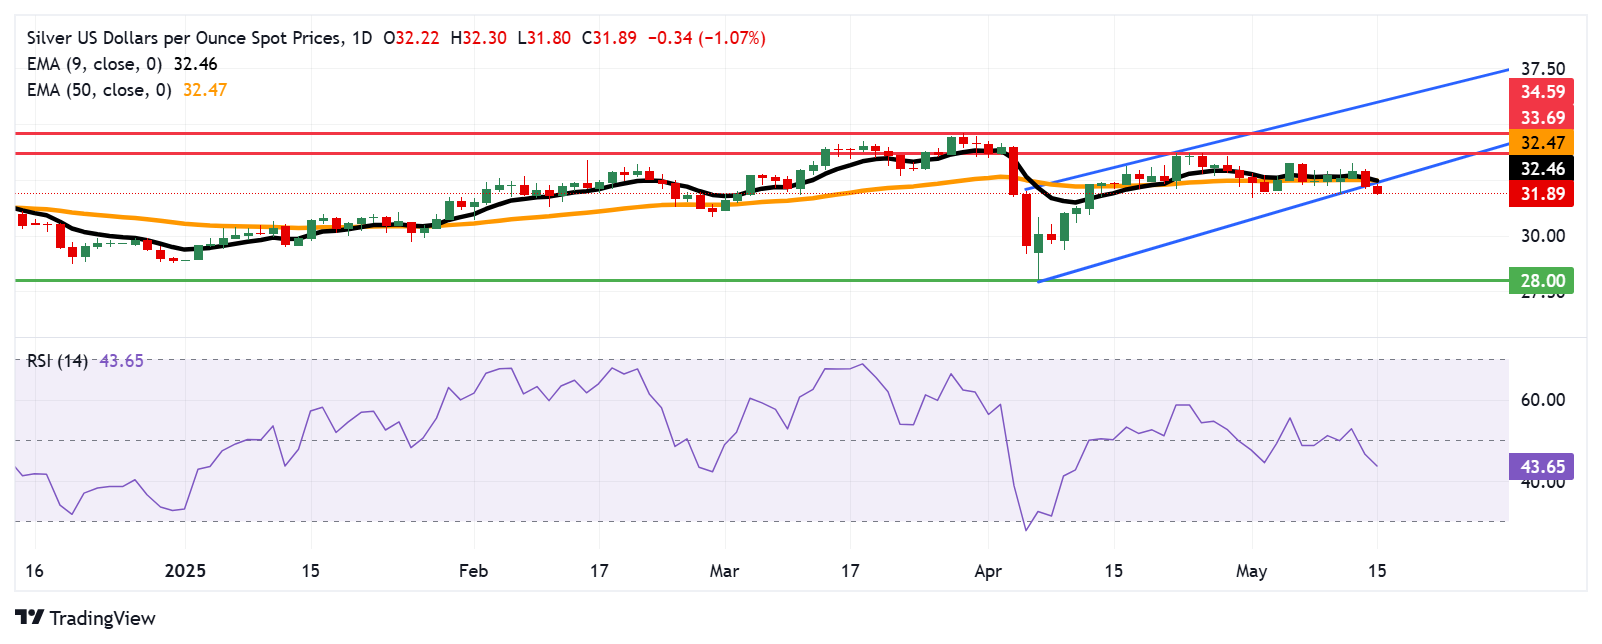
- The 14-day RSI has dipped below the 50 mark, signaling increasing bearish momentum.
- Initial resistance could emerge near the nine-day EMA at $32.46, which is closely aligned with the 50-day EMA at $32.47.
Silver price (XAG/USD) is extending its losses for the second successive session, trading around $31.90 per troy ounce during the Asian hours on Thursday. Technical analysis of the daily chart indicates a weakening of a bullish outlook, as the precious metal price has broken below the ascending channel pattern.
The 14-day Relative Strength Index (RSI) has slipped below the 50 level, indicating a growing bearish bias. Additionally, the Silver price has fallen beneath both the nine-day and 50-day Exponential Moving Averages (EMAs), further highlighting the fading strength of its short-term upward momentum.
On the downside, the Silver price could navigate the region around the eight-month low of $28.00, marked on April 7.
The XAG/USD pair may initially aim for resistance near the nine-day EMA at $32.46, closely aligned with the 50-day EMA at $32.47. A decisive break above these levels could reinforce the bullish outlook, paving the way for Silver to retest the six-week high of $33.69, marked on April 24.
A further breakout beyond this point may attract additional buying interest, potentially driving the price toward the seven-month high of $34.59, last seen on March 28.
XAG/USD: Daily Chart