XAG/USD slips as US yields rebound, hovers below $32.50
- XAG/USD capped at $32.73 (50-day SMA), supported by 100-day SMA near $31.88 amid choppy trade.
- RSI flat near neutral; a break above $33.00 is needed to turn bias bullish toward $33.50–$34.51
- A drop below $32.00 may expose $31.65 and the 200-day SMA at $31.23 as bearish pressure builds.
Silver prices edged lower on Friday, with losses of over 1%, set to end the week on a negative note amid rising US Treasury yields, which staged a comeback late during the North American session. XAG/USD trades at $32.26 after hitting a daily peak of $32.68 at the time of writing.
XAG/USD Price Forecast: Technical outlook
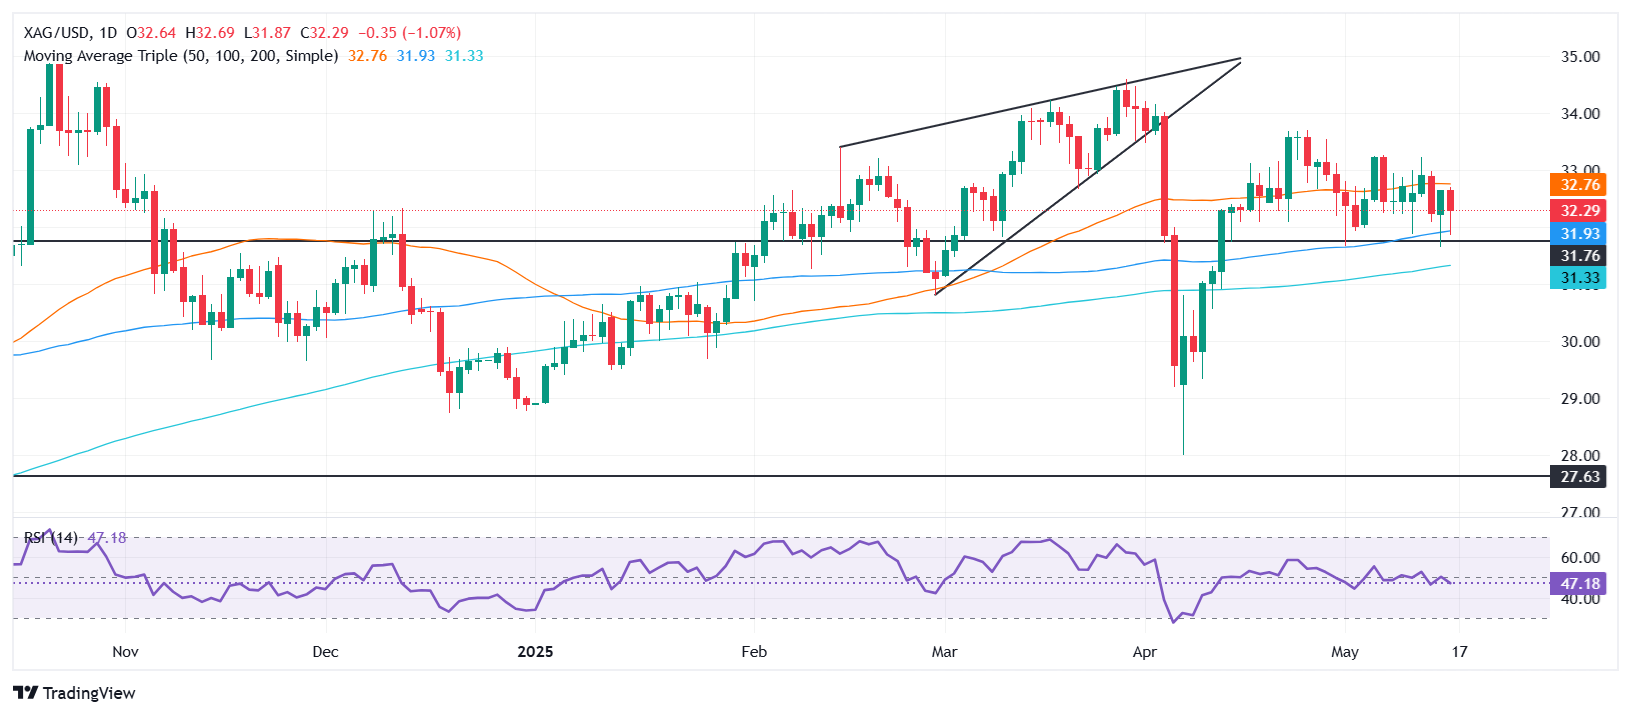
XAG/USD consolidated within the 50 and 100-day Simple Moving Averages (SMAs) at $32.73 and $31.88, respectively, over the last five days, with no apparent bias as depicted in the daily chart. The Relative Strength Index (RSI), although bearish, remains flat near the 50-neutral line, flat.
This confirms the grey metal’s lack of direction, but buyers could regain control if they clear a downslope trendline drawn from the March 28–April 25 peaks, which could be broken near $33.00. A breach of the latter will expose $33.50, followed by the $34.00 mark. Once surpassed, the next stop would be the October 30 peak at $34.51.
Conversely, if XAG/USD falls below $32.00, the first support would be the 100-day SMA, followed by the May 15 low of $31.65. Once this level is cleared, the next stop would be the 200-day SMA at $31.23, followed by the $31.00 figure.
XAG/USD Price Chart – Daily