XAG/USD trades around mid-$33.00s; just below multi-week top
- Silver eases from a three-week high retested earlier this Friday.
- The setup supports prospects for the emergence of dip-buyers.
- A break below the $32.00 mark might negate the positive bias.
Silver (XAG/USD) edges lower after testing the three-week top during the Asian session on Friday and currently trades around the mid-$33.00s, down 0.30% for the day. The technical setup, however, warrants caution before positioning for any meaningful depreciating move.
This week’s breakout above the $33.00 round figure, representing the top end of a multi-day-old range and the 61.8% Fibonacci retracement level of the March-April downfall, was seen as a key trigger for bullish traders. Moreover, oscillators on the daily chart have been gaining positive traction and are still far from being in the overbought territory. This, in turn, suggests that the path of least resistance for the XAG/USD is to the upside.
Hence, any subsequent slide might still be seen as a buying opportunity near the $33.00 hurdle breakpoint, now turned support. A convincing break below the said handle might prompt some technical selling and drag the XAG/USD further toward the $32.40 support en route to the $32.10-$32.00 area. Some follow-through selling will suggest that the recent recovery from the $28.00 mark, or the year-to-date low, has run out of steam.
On the flip side, the $33.70 area now seems to have emerged as an immediate hurdle, above which the XAG/USD could aim to reclaim the $34.00 mark. The momentum could extend further towards the $34.30 intermediate resistance en route to the next relevant barrier near the $34.55-$34.60 region, or the highest level since October 2024 touched last month. The white metal could eventually aim to conquer the $35.00 psychological mark.
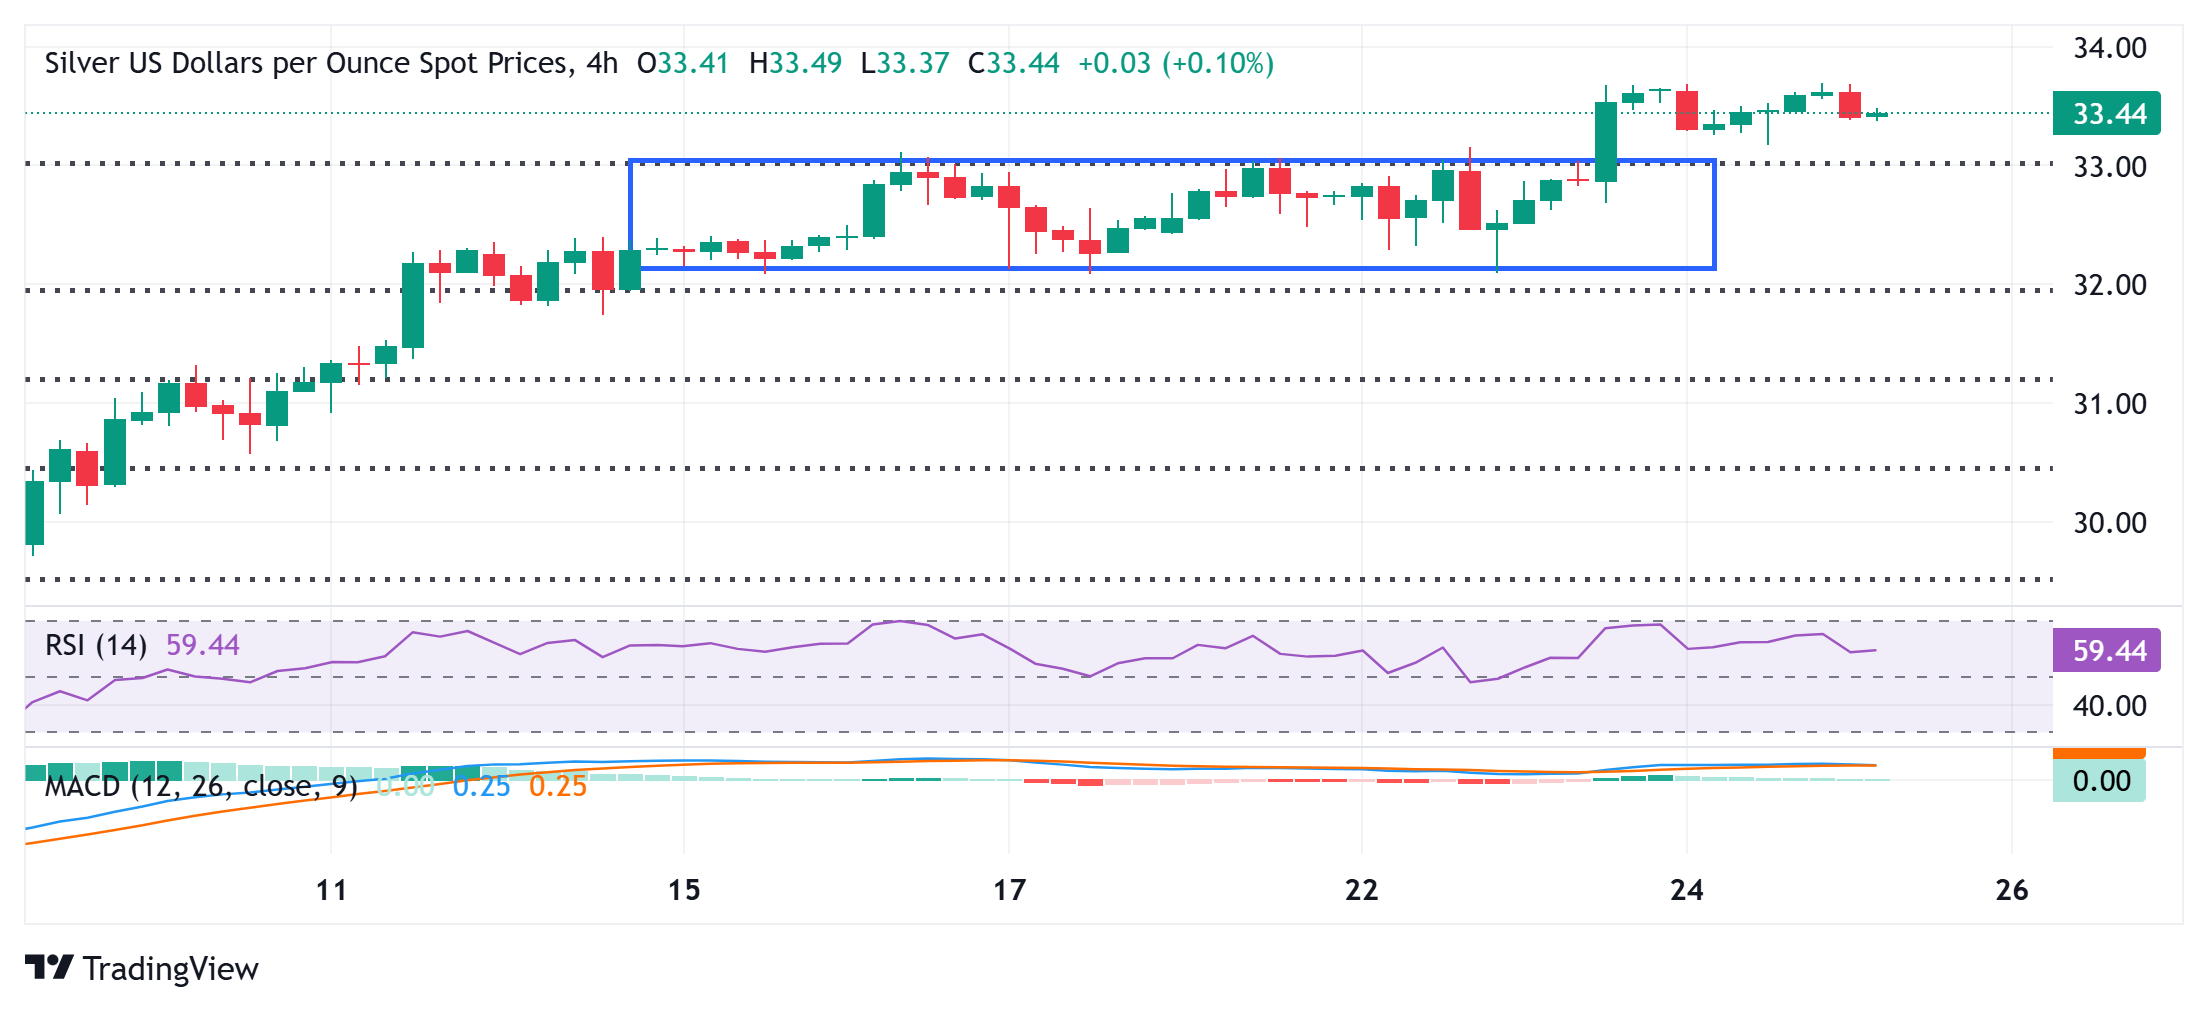
Silver 4-hour chart