- Silver corrects sharply from a 14-year peak as overbought conditions prompt profit-taking.
- The technical setup favors bulls and backs the case for the emergence of some dip-buying.
- Weakness below the 23.6% Fibo. level could drag the XAG/USD towards the $39.50 support.
Silver (XAG/USD) extends the previous day’s late pullback from the vicinity of mid-$41.00s, or its highest level since September 2011, and attracts heavy selling during the Asian session on Thursday. The white metal now seems to have snapped a five-day winning streak and currently trades around the $40.75 region, down over 1% for the day.
From a technical perspective, the intraday decline could be attributed to some profit-taking following the recent sharp move up witnessed over the past two weeks or so, and slightly overbought conditions on the daily chart. However, this week’s breakout through the previous year-to-date high and a subsequent strength beyond $40.00 psychological mark favors the XAG/USD bulls.
Hence, any further slide is more likely to find decent support near the $40.40 area, representing the 23.6% Fibonacci retracement level of the latest upswing from the August 20 low. That said, some follow-through selling might expose the $40.00 mark, which should act as a key pivotal point, and a convincing break below could drag the XAG/USD to the $39.50-$39.40 support zone.
On the flip side, the $41.00 round figure now seems to act as an immediate hurdle, above which the XAG/USD could climb back towards challenging the multi-year peak, around the $41.45 region touched on Wednesday. The momentum could extend further towards reclaiming the $42.00 mark before the XAG/USD eventually climbs to the next relevant hurdle near the $42.65 region.
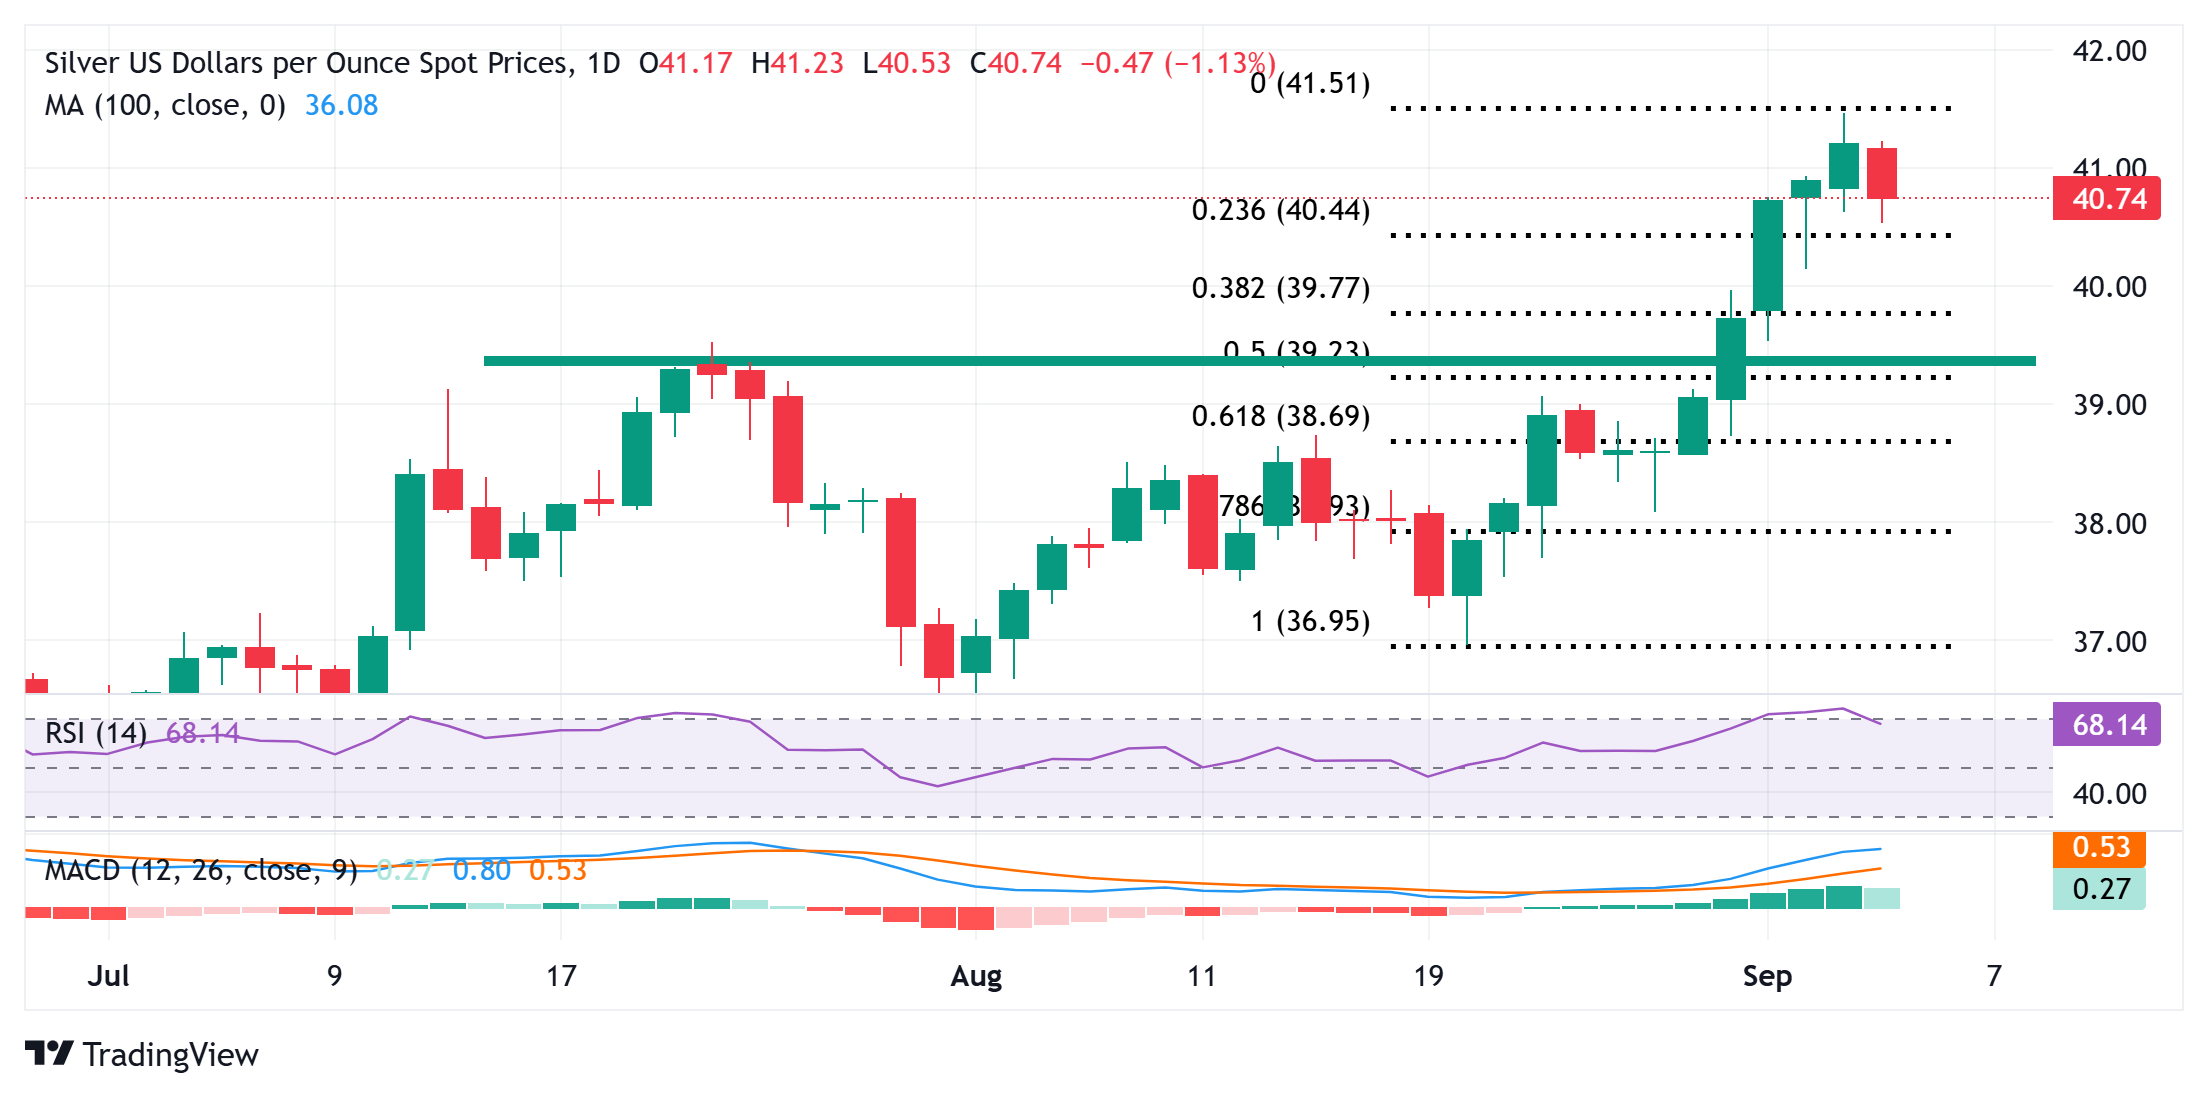
Silver daily chart