December 9, 2025
Currency markets are volatile and unpredictable. We help businesses mitigate risks to their cashflow by providing strategic support and analysis of all the latest trends from around the world.
Currency List
Currency List
Non EU
- The Indian Rupee attracts bids against the US Dollar; however, its outlook remains uncertain.
- The amount of stake dumped by FIIs in the Indian stock market remained lower in the last two trading days.
- Investors expect the Fed to cut interest rates by 25 bps on Wednesday.
The Indian Rupee (INR) bounces back against the US Dollar (USD) on Tuesday. The USD/INR pair falls to near 90.20 amid a slowdown in the pace of foreign outflow from the Indian stock market.
Over the last two trading days, overseas investors have pared their stake by an average worth of Rs. 547.25 crore, which is lower than the average selling of Rs. 2,491.18 crore seen in the first four trading days this month.
Foreign Institutional Investors (FIIs) have relentlessly sold their stake in the Indian equity market in the second half of the year due to a delay in the announcement of a United States (US)-India trade deal. The US-India trade uncertainty has widened India’s fiscal deficit and strong demand for US Dollars in the non-deliverable forward (NDF) market.
However, the outlook for the Indian Rupee remains uncertain, as top negotiators from India and the US have not provided any hint of a timeframe for reaching a consensus.
On the domestic front, investors await the retail Consumer Price Index (CPI) data for November, which will be released on Friday. According to a December 4-8 Reuters poll, India’s retail inflation is expected to have grown at an annualized pace of 0.7%, faster than 0.25% in October.
In the Reserve Bank of India’s (RBI) monetary policy, announced on Friday, Governor Sanjay Malhotra revised inflation projections for the current year lower to 2.0% from 2.6% anticipated earlier.
The table below shows the percentage change of Indian Rupee (INR) against listed major currencies today. Indian Rupee was the strongest against the Japanese Yen.
| USD | EUR | GBP | JPY | CAD | AUD | INR | CHF | |
|---|---|---|---|---|---|---|---|---|
| USD | -0.04% | -0.02% | 0.09% | -0.04% | -0.22% | -0.23% | -0.09% | |
| EUR | 0.04% | 0.02% | 0.13% | 0.00% | -0.18% | -0.21% | -0.07% | |
| GBP | 0.02% | -0.02% | 0.12% | -0.01% | -0.20% | -0.22% | -0.09% | |
| JPY | -0.09% | -0.13% | -0.12% | -0.13% | -0.31% | -0.34% | -0.20% | |
| CAD | 0.04% | -0.01% | 0.01% | 0.13% | -0.19% | -0.19% | -0.08% | |
| AUD | 0.22% | 0.18% | 0.20% | 0.31% | 0.19% | 0.02% | 0.12% | |
| INR | 0.23% | 0.21% | 0.22% | 0.34% | 0.19% | -0.02% | 0.14% | |
| CHF | 0.09% | 0.07% | 0.09% | 0.20% | 0.08% | -0.12% | -0.14% |
The heat map shows percentage changes of major currencies against each other. The base currency is picked from the left column, while the quote currency is picked from the top row. For example, if you pick the Indian Rupee from the left column and move along the horizontal line to the US Dollar, the percentage change displayed in the box will represent INR (base)/USD (quote).
Daily digest market movers: US JOLTS Job Openings data, Fed policy come into focus
- The Indian Rupee broadly underperforms the US Dollar, even as the latter trades cautiously ahead of the monetary policy announcement by the Federal Reserve (Fed) on Wednesday.
- At the press time, the US Dollar Index (DXY), which tracks the Greenback’s value against six major currencies, trades subduedly near 99.00.
- Investors are confident that the Fed will cut interest rates by 25 basis points (bps) to 3.50%-3.75% in the December policy meeting amid weakening job market conditions.
- In late November, New York Fed Bank President John Williams also warned of slower economic growth and weak labour demand, while supporting the need for more interest rate cuts.
- “Economic growth has slowed, and the labor market gradually cooled,” Williams said, adding that there is room for a further adjustment in the near term.”
- With traders remaining confident that the Fed will cut interest rates on Wednesday, the major driver for the US Dollar will be the central bank’s guidance on the monetary policy outlook. Federal Open Market Committee (FOMC) members are expected to support holding interest rates steady in early 2026 as inflationary pressures have remained well above the 2% target for months.
- In Tuesday’s session, investors will focus on the US JOLTS Job Openings data, which will be published at 15:00 GMT. US employers are expected to have posted 7.2 million fresh jobs in October.
Technical Analysis: USD/INR corrects to near 90.20
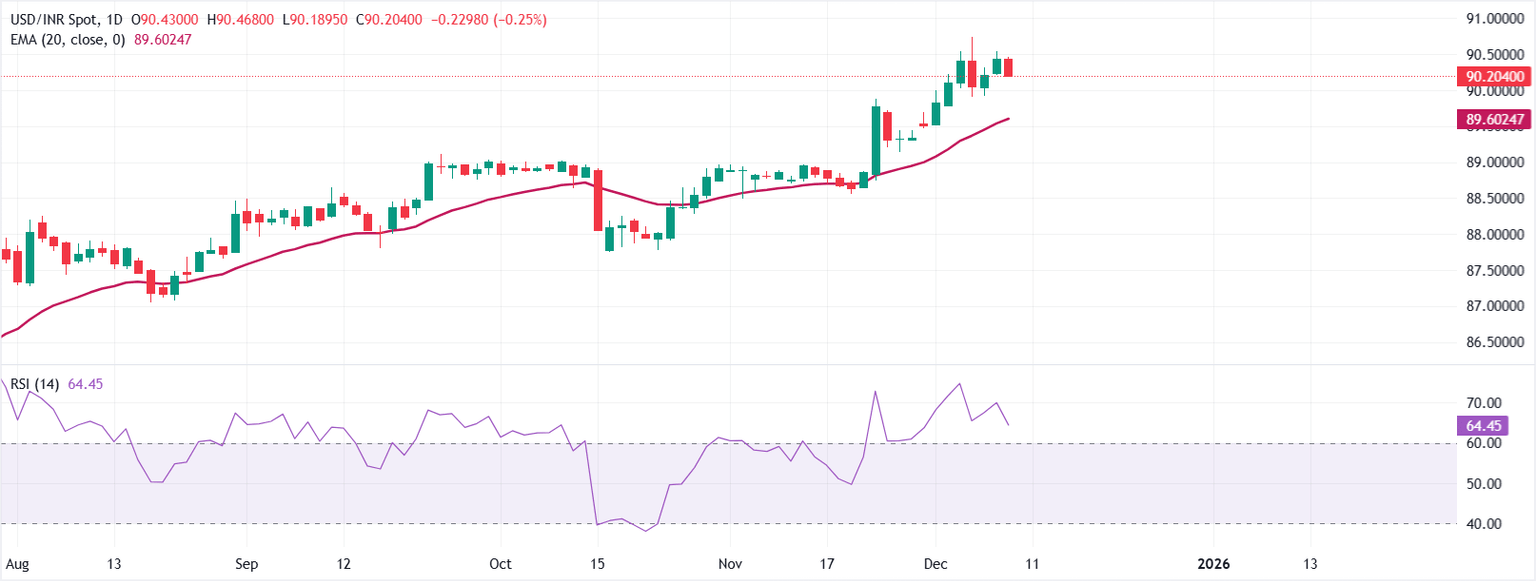
USD/INR trades at 90.3455 as of writing. The 20-day Exponential Moving Average (EMA) at 89.6159 rises, and the pair holds above it, keeping the bullish bias intact.
The 14-day Relative Strength Index (RSI) at 67.76 (bullish) has eased from overbought, indicating firm momentum that is no longer stretched.
Staying above the 20-day EMA would keep the path of least resistance to the upside, while a close below it would tilt risks toward a pullback. A push in RSI back above 70 would flag overbought conditions and could prompt consolidation. Initial support is at the 20-day EMA near 89.6159. On the upside, the pair could advance the uptrend to near 92.00 if it breaks above the all-time high near 90.70.

Leave A Comment