


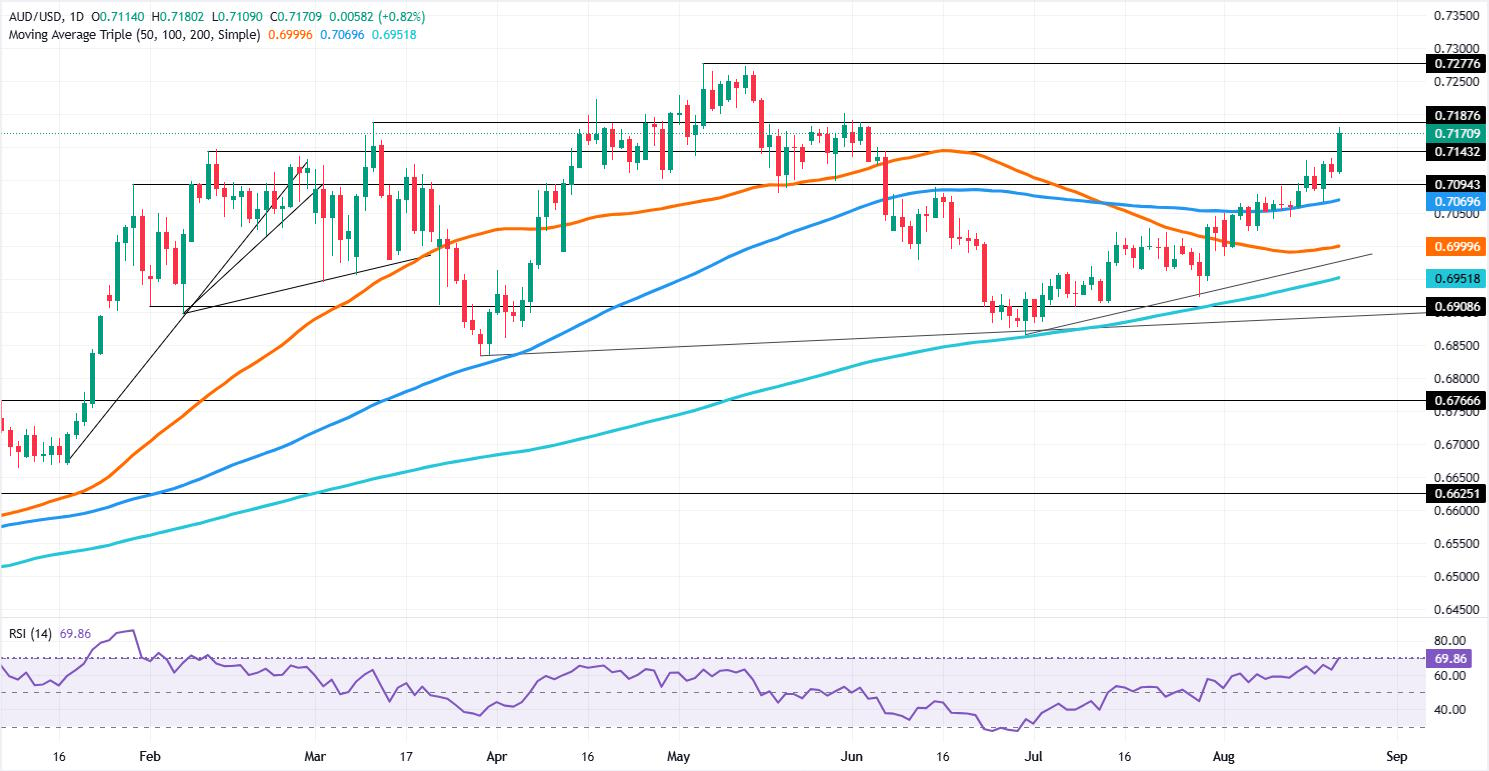
- AUD/USD clears June high, confirming renewed bullish momentum.
- RSI supports upside as buyers target 0.7200 and 0.7227.
- Break below 0.7100 exposes 100-day SMA and 50-day support.
The Aussie Dollar finished the week with gains of over 0.82% on Friday and up more than 1.20% for the week as the US Dollar tumbled following the US Treasury Department’s announcement of a bond buyback for the long end of the curve. The AUD/USD trades at 0.7170, after rebounding near 0.7067.
AUD/USD Price Forecast: Technical Outlook
AUD/USD price action indicates that the uptrend resumed after the pair reclaimed the 100-day Simple Moving Average (SMA) at 0.7969. In addition, a breakout above the June 4 daily high of 0.7149 opened the door for further gains.
The Relative Strength Index (RSI) indicates bullish momentum. Hence, the path of least resistance is tilted to the upside, meaning that bulls are piling in search of higher prices.
The AUD/USD’s first supply zone is the May 29 high of 0.7200. If breached, this clears the path to challenge the year-to-date (YTD) high of 0.7227. On further strength, the next area of interest would be 0.7300.
Conversely, if bears move in and drag prices below 0.7100, a move towards the 100-day SMA at 0.7069 is on the cards. On further weakness, the next support is the 50-day SMA at 0.6999.
AUD/USD Price Chart – Daily

Leave A Comment