Friday’s session on EURUSD is focused on the market’s continued assessment of Wednesday’s Federal Reserve meeting and the latest macroeconomic data from the United States. The market is increasingly assuming that the Fed will not rush into further rate hikes, although recent data still shows that the US economy remains relatively resilient. Wednesday’s Fed decision did not bring any change in interest rates, but the communication from the central bank was more important than the decision itself. Kevin Warsh stressed that the Fed needs to remain cautious and cannot declare victory over inflation too quickly. At the same time, the lack of a clear signal pointing towards the need for further policy tightening was interpreted by the market as confirmation that the current hiking cycle may be close to an end. Before the meeting, market pricing suggested the possibility of two more rate hikes this year. This scenario is now significantly less likely, which removes one of the key sources of support for the US dollar. Another factor affecting the US currency was yesterday’s macroeconomic data. US GDP growth is slowing, PCE inflation is gradually declining, although it remains elevated, while the labour market continues to show strong resilience. Today’s CPI inflation release from the euro area will be another important signal for future European Central Bank decisions. EURUSD is currently caught between two opposing narratives. On one side, reduced expectations for further Fed rate hikes are weighing on the dollar. On the other hand, the US economy continues to perform relatively well, allowing the Fed to maintain a restrictive stance. On the euro side, the market is waiting for confirmation that inflation in Europe will continue to decline and that the ECB will have room to begin easing monetary policy.
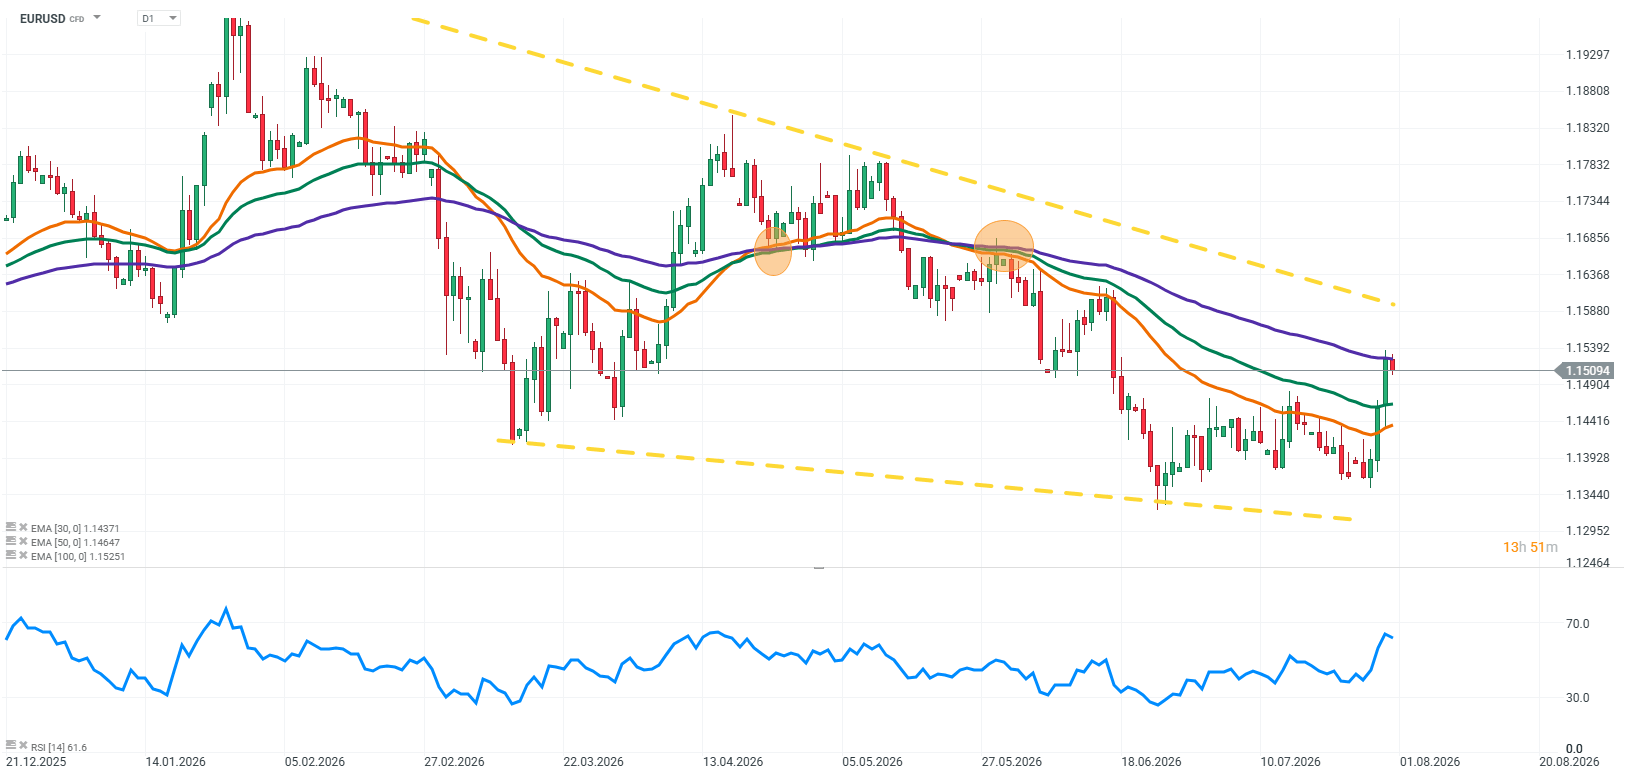
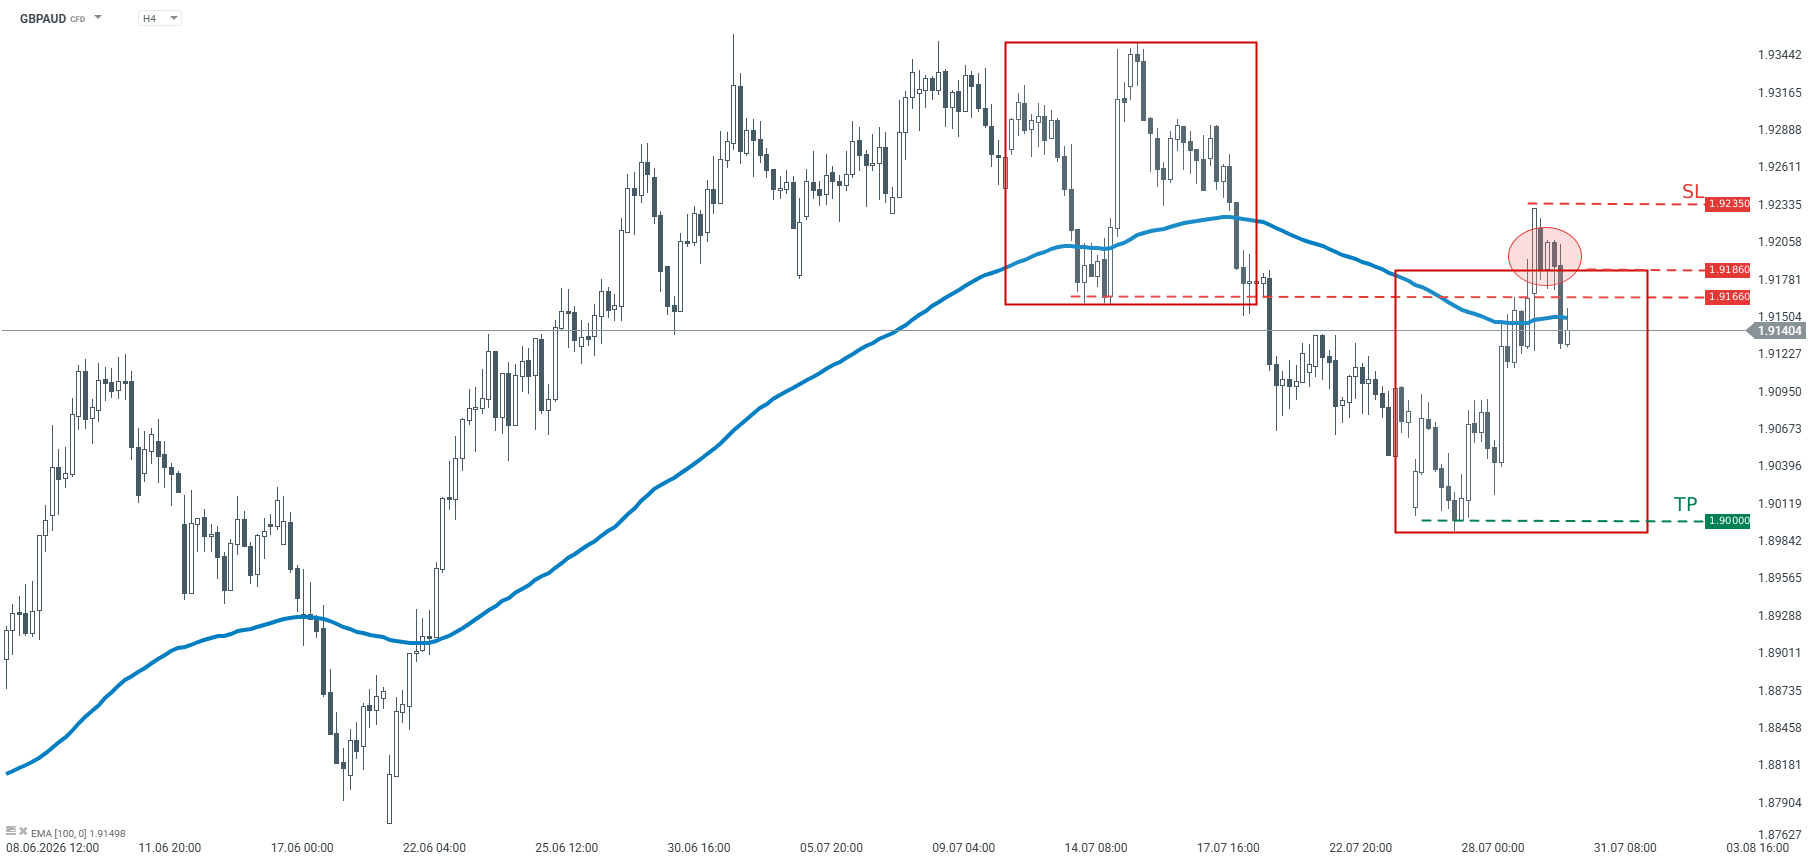
Source: xStation5
Factors currently shaping EURUSD
Fed moves closer to the end of the hiking cycle
The most important event for the currency market in recent days was the Federal Reserve meeting. The decision to leave interest rates unchanged was largely expected, which is why the main focus was placed on the central bank’s communication. Kevin Warsh did not reinforce expectations of further interest rate hikes. The Fed continues to emphasise the need for caution in its fight against inflation, but at the same time it is not signalling that additional increases in borrowing costs are currently the base-case scenario. This marks a significant shift compared with the situation before the meeting. Previously, the market was pricing in the possibility of further rate increases as inflation remained elevated and the US economy continued to show considerable resilience. Those expectations have now been clearly reduced. For the dollar, this means a loss of some support from the prospect of further interest rate increases. However, this does not automatically signal the beginning of a sustained downward trend for the US currency. The Fed will continue to react to incoming data, and persistent inflation leaves the possibility of keeping rates higher for longer.
US data points to a slowdown, but the economy remains resilient
The latest macroeconomic releases paint an increasingly complex picture of the US economy. GDP growth is gradually slowing, which reflects the impact of previous rate hikes and tighter financial conditions. Slower economic momentum reduces the scope for further monetary tightening. At the same time, PCE inflation, one of the most important indicators for the Federal Reserve, remains above levels considered consistent with the central bank’s target. However, the direction of travel is positive, as price pressures are gradually easing. The strongest argument for continued Fed caution remains the labour market. Despite high interest rates, employment conditions remain relatively strong, and consumer spending in the US continues to show resilience. For the dollar, this creates a mixed picture. Slower growth and declining inflation do not support the case for another hiking cycle, but economic resilience allows the Fed to maintain elevated interest rates for an extended period.
Eurozone inflation as an important test for the ECB
On the euro side, the key event remains today’s CPI inflation release from the euro area. The market will focus not only on the inflation level itself, but also on the pace of price moderation. For the ECB, the key question is whether inflation is declining quickly enough to allow the central bank to begin easing monetary policy in the future. If the data show that inflation remains persistent, particularly in the services sector, this could reduce expectations for rapid rate cuts in Europe. Such a scenario would provide support for the euro. On the other hand, a stronger decline in inflation would increase expectations that the ECB has greater room to lower interest rates. In that case, the advantage from the interest rate differential could shift back in favour of the dollar.
Bond yields remain crucial for the dollar
Despite the change in expectations surrounding the Fed, US bond yields remain a very important factor for the currency market. A decline in inflation alone does not necessarily mean a lasting weakening of the dollar. If the Fed keeps interest rates at elevated levels for longer, dollar-denominated assets may continue to remain attractive. For this reason, the market is currently focused not only on economic data itself, but also on how central banks respond to those developments. The key issue will be how quickly expectations for future Fed and ECB policy paths change.
EURUSD waits for the next catalyst
The current situation on EURUSD reflects a clash between two different scenarios. The Fed has signalled that the room for further rate hikes is becoming limited, which is negative for the dollar. At the same time, the US economy remains relatively resilient, and the labour market does not yet provide a strong argument for rapid rate cuts. For the euro, inflation data and future ECB decisions will remain crucial. If inflation in Europe declines more slowly than the market expects, the euro could receive support. If the disinflation process accelerates, pressure on the common currency could increase. EURUSD therefore remains primarily a reflection of differences in monetary policy expectations. For the market, the key issue is no longer only the current inflation level, but which central bank will have more room to maintain a restrictive policy stance for longer.
Key takeaways
- The Fed left interest rates unchanged, and the lack of a clear signal for further tightening reduced expectations of additional rate hikes.
- The market has significantly lowered the pricing of further rate increases in the US.
- US data point to slower economic growth and gradually easing inflation, but the labour market remains strong.
- Today’s eurozone CPI inflation data will be an important signal for future ECB decisions.
- The direction of EURUSD will largely depend on whether the Fed’s stance changes faster or whether the ECB will be forced to maintain higher interest rates for longer.