


- The Indian Rupee trades sharply higher against the US Dollar after the US CPI data release.
- Hotter-than-projected US CPI data fails to lift hawkish Fed expectations.
- India’s retail and wholesale Inflation remain stronger in September.
The Indian Rupee (INR) trades higher against the US Dollar (USD) on Thursday. The USD/INR pair slides to near 94.95 as the US Dollar underperforms and United States (US) Treasury Yields face intense selling pressure in the aftermath of the US Consumer Price Index (CPI) data for September released on Thursday.
US Dollar Price Today
The table below shows the percentage change of US Dollar (USD) against listed major currencies today. US Dollar was the weakest against the Swiss Franc.
| USD | EUR | GBP | JPY | CAD | AUD | INR | CHF | |
|---|---|---|---|---|---|---|---|---|
| USD | -0.54% | -0.40% | -0.25% | -0.19% | 0.25% | -0.09% | -0.60% | |
| EUR | 0.54% | 0.13% | 0.25% | 0.32% | 0.82% | 0.33% | -0.07% | |
| GBP | 0.40% | -0.13% | 0.13% | 0.19% | 0.66% | 0.30% | -0.21% | |
| JPY | 0.25% | -0.25% | -0.13% | 0.05% | 0.53% | 0.06% | -0.35% | |
| CAD | 0.19% | -0.32% | -0.19% | -0.05% | 0.45% | 0.00% | -0.41% | |
| AUD | -0.25% | -0.82% | -0.66% | -0.53% | -0.45% | -0.46% | -0.87% | |
| INR | 0.09% | -0.33% | -0.30% | -0.06% | 0.00% | 0.46% | -0.40% | |
| CHF | 0.60% | 0.07% | 0.21% | 0.35% | 0.41% | 0.87% | 0.40% |
The heat map shows percentage changes of major currencies against each other. The base currency is picked from the left column, while the quote currency is picked from the top row. For example, if you pick the US Dollar from the left column and move along the horizontal line to the Japanese Yen, the percentage change displayed in the box will represent USD (base)/JPY (quote).
As of writing, the US Dollar Index (DXY), which gauges the Greenback’s value against six major currencies, trades 0.6% lower to near 101.90 after retreating from its 18-month high of 102.95 posted on Wednesday. The 10-year US Treasury Yields have fallen to near 5.10%.
The initial reaction from the US Dollar and US bond yields was strongly positive; however, they retreated swiftly as the hot US CPI report failed to lift hawkish Federal Reserve (Fed) expectations.
How was the US CPI data?
The US CPI report showed that the headline inflation accelerated to 3.7% Year-on-Year (YoY) in September from 3.4% in August, while it was expected to come in at 3.6%. The core CPI – which excludes volatile food and energy items – arrived at 2.6% YoY, higher than 2.5% estimates and the previous reading of 2.4%.
On a monthly basis, the headline CPI grew 0.6%, as expected, faster than the prior release of 0.4%. The core figure rose steadily by 0.3%, beating 0.2% estimates.
The CME FedWatch tool shows that the influence of hotter-than-projected US CPI report remains limited on Fed’s interest rate prospects. The odds of the Fed hiking interest rates in the policy meeting later this month have increased marginally to 27% from 22% seen before the data release. However, traders remain confident that the Fed will deliver an interest rate hike in the December meeting.
Indian Rupee was already outperforming on RBI’s fresh measures
The Indian currency was already outperforming this week, following forceful measures by the Reserve Bank of India (RBI) to curb the US Dollar’s demand.
Analysts at Commerzbank said in a note that the RBI has rolled out several targeted steps, including “a special USD facility for state-run oil marketing companies and a reduction in the threshold for INR derivatives without an underlying asset to USD5mn from USD100mn.”
The bank adds that the RBI has also “introduced a new Foreign Exchange Risk Reserve (FERR), requiring 20% of the notional value of each FX derivative transaction above USD2mn to be held with the central bank.”
Surging India’s inflation supports more RBI interest rate hikes
This week, India’s CPI data for September on both retail and the wholesale levels has come in stronger, building a case for another interest rate hike by the RBI this year. Last week, the RBI hiked its key Repo Rate by 25 basis points (bps) to 5.50% and shifted its stance from “neutral” to “calibrated tightening”.
On Monday, India’s retail CPI data arrived at 5.54%, higher than 5.4% expectations and the August reading of 4.82%, but remains within the RBI’s tolerance band of 2%-6%. The WPI Inflation data on Wednesday came in at 11.39%, significantly higher than the prior release of 9.92%.
Technical Analysis: USD/INR
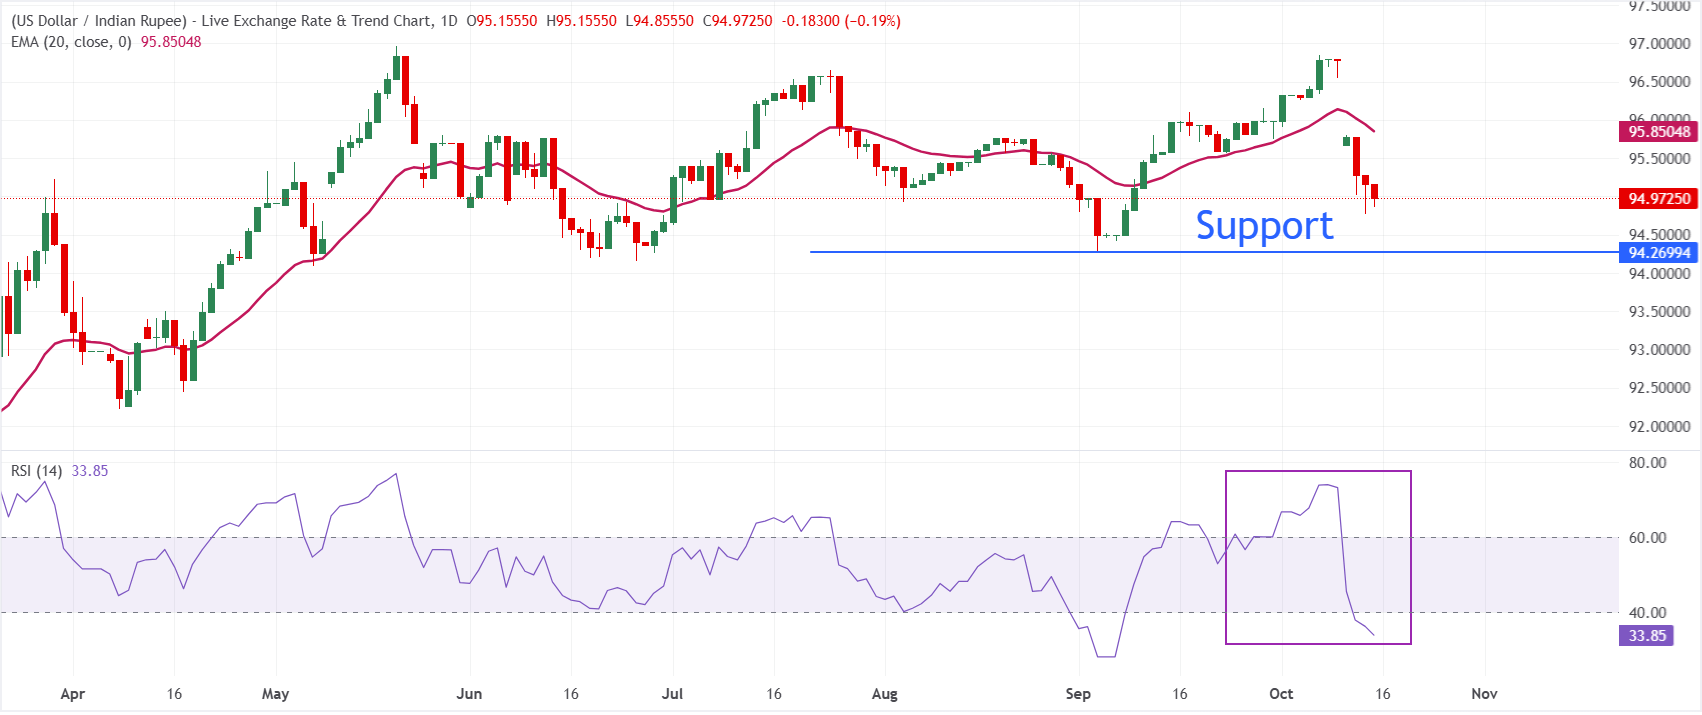
In the daily chart, USD/INR trades at 94.97, keeping a bearish near-term bias as spot holds below the 20-period exponential moving average (EMA) at 95.85. The EMA overhead suggests rallies remain vulnerable, while the Relative Strength Index (RSI) at 33.9 hovers just above oversold territory, hinting that downside momentum is still dominant but starting to lose some intensity.
On the topside, initial resistance is clearly defined by the 20-period EMA at 95.85, and a sustained break above this barrier would be needed to ease the current bearish pressure. On the downside, the September low near 94.30 is the key support level.

Leave A Comment