


- The US Dollar Index edges lower to near 101.88; however, the outlook remains strong.
- Investors await the US NFP data for September releasing at 12:30 GMT.
- The Fed is expected hike interest rates further by 100 bps in one-year timeframe.
The US Dollar (USD) trades marginally lower on Friday ahead of the United States (US) Nonfarm Payrolls (NFP) data for September at 12:30 GMT. In the early European trade, the US Dollar Index (DXY), which gauges the Greenback’s value against six major currencies, trades marginally lower to near 101.88, but is still close to its over-a-year high of 102.20 posted on Thursday.
US Dollar Price This week
The table below shows the percentage change of US Dollar (USD) against listed major currencies this week. US Dollar was the strongest against the Euro.
| USD | EUR | GBP | JPY | CAD | AUD | NZD | CHF | |
|---|---|---|---|---|---|---|---|---|
| USD | 1.09% | 0.16% | 0.17% | 0.51% | 1.09% | 0.80% | -0.12% | |
| EUR | -1.09% | -1.00% | -0.83% | -0.60% | -0.01% | -0.30% | -1.21% | |
| GBP | -0.16% | 1.00% | -0.06% | 0.35% | 0.94% | 0.64% | -0.27% | |
| JPY | -0.17% | 0.83% | 0.06% | 0.22% | 0.83% | 0.52% | -0.41% | |
| CAD | -0.51% | 0.60% | -0.35% | -0.22% | 0.62% | 0.27% | -0.61% | |
| AUD | -1.09% | 0.00% | -0.94% | -0.83% | -0.62% | -0.30% | -1.21% | |
| NZD | -0.80% | 0.30% | -0.64% | -0.52% | -0.27% | 0.30% | -0.90% | |
| CHF | 0.12% | 1.21% | 0.27% | 0.41% | 0.61% | 1.21% | 0.90% |
The heat map shows percentage changes of major currencies against each other. The base currency is picked from the left column, while the quote currency is picked from the top row. For example, if you pick the US Dollar from the left column and move along the horizontal line to the Japanese Yen, the percentage change displayed in the box will represent USD (base)/JPY (quote).
The US NFP report is expected to show that the economy created 90K fresh jobs, lower than 162K in August, with the Unemployment Rate remaining steady at 4.1%. The data will likely have a significant impact on Federal Reserve’s (Fed) interest rate expectations.
Meanwhile, traders remaining increasingly confident that the Fed will deliver more interest rate hikes in the near term is providing strength to the US Dollar.
Strategists at Brown Brothers Harriman (BBH) note that “USD is up across the board, with the DXY index making new cyclical highs,” underpinned by a resilient US backdrop. They point to “resilient US economic activity, improving labor demand, and sticky inflation” as key factors that “back the nearly 100bps of Fed funds rate hikes priced over the next twelve months,” reinforcing the constructive tone toward the Dollar.
Higher hawkish Fed expectations have boosted US Treasury Yields. In the European trade on Friday, 10-year US Treasury Yields are flat at around 5.25% but are still close to its over two-decade high of 5.34% posted the previous day.
US Dollar Index Technical Analysis
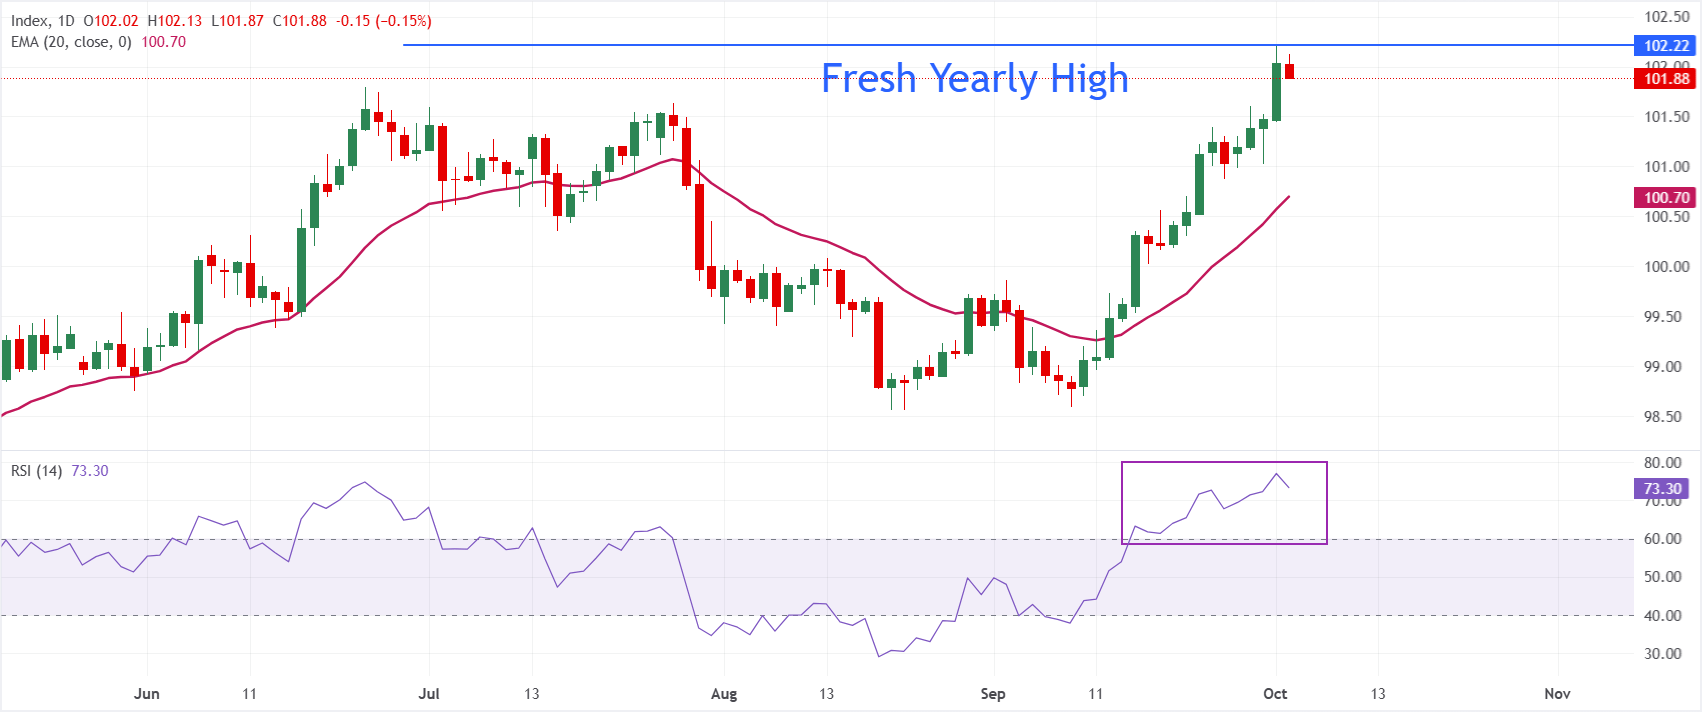
In the daily chart, Dollar Index Spot trades at 101.88. The index holds above the 20-day exponential moving average (EMA) at 100.70, which keeps the near-term bias bullish as price extends its advance away from this dynamic floor. The Relative Strength Index (14) at 73.18 sits in overbought territory, hinting that the latest breakout is stretched but not yet reversed.
On the downside, initial support is seen at the 20-day EMA at 100.70. Looking up, the fresh annual high at 102.20 is the immediate resistance; above that the 10 April 2025 high at 103.03 would be the key hurdle.

Leave A Comment