Currency Hedger No Comments

Currency Talk – GBP/AUD AUD/NZD EUR/AUD

The Overbalance analysis aims to identify three financial instruments, analyzed primarily on the daily/four-hour (D1/H4) timeframe. The analysis uses only the Overbalance methodology, which helps determine where a trend may continue or where it may reverse.
Today’s analysis covers three instruments, evaluated solely in terms of 1:1 correction structures.

GBPAUD
Since last November, the GBPAUD currency pair has been trading in a downtrend; however, in mid-March, the upper boundary of the broad 1:1 pattern was broken at the 1.8990 level, which may indicate a shift in sentiment toward an uptrend. Currently, the 1.8975 level should be considered key short-term support, as it marks the lower boundary of the local 1:1 bullish pattern. According to the Overbalance methodology, as long as this level holds, further expansion of the upward movement is possible. Conversely, a drop back below 1.8990 could signal a resumption of the downward trend.

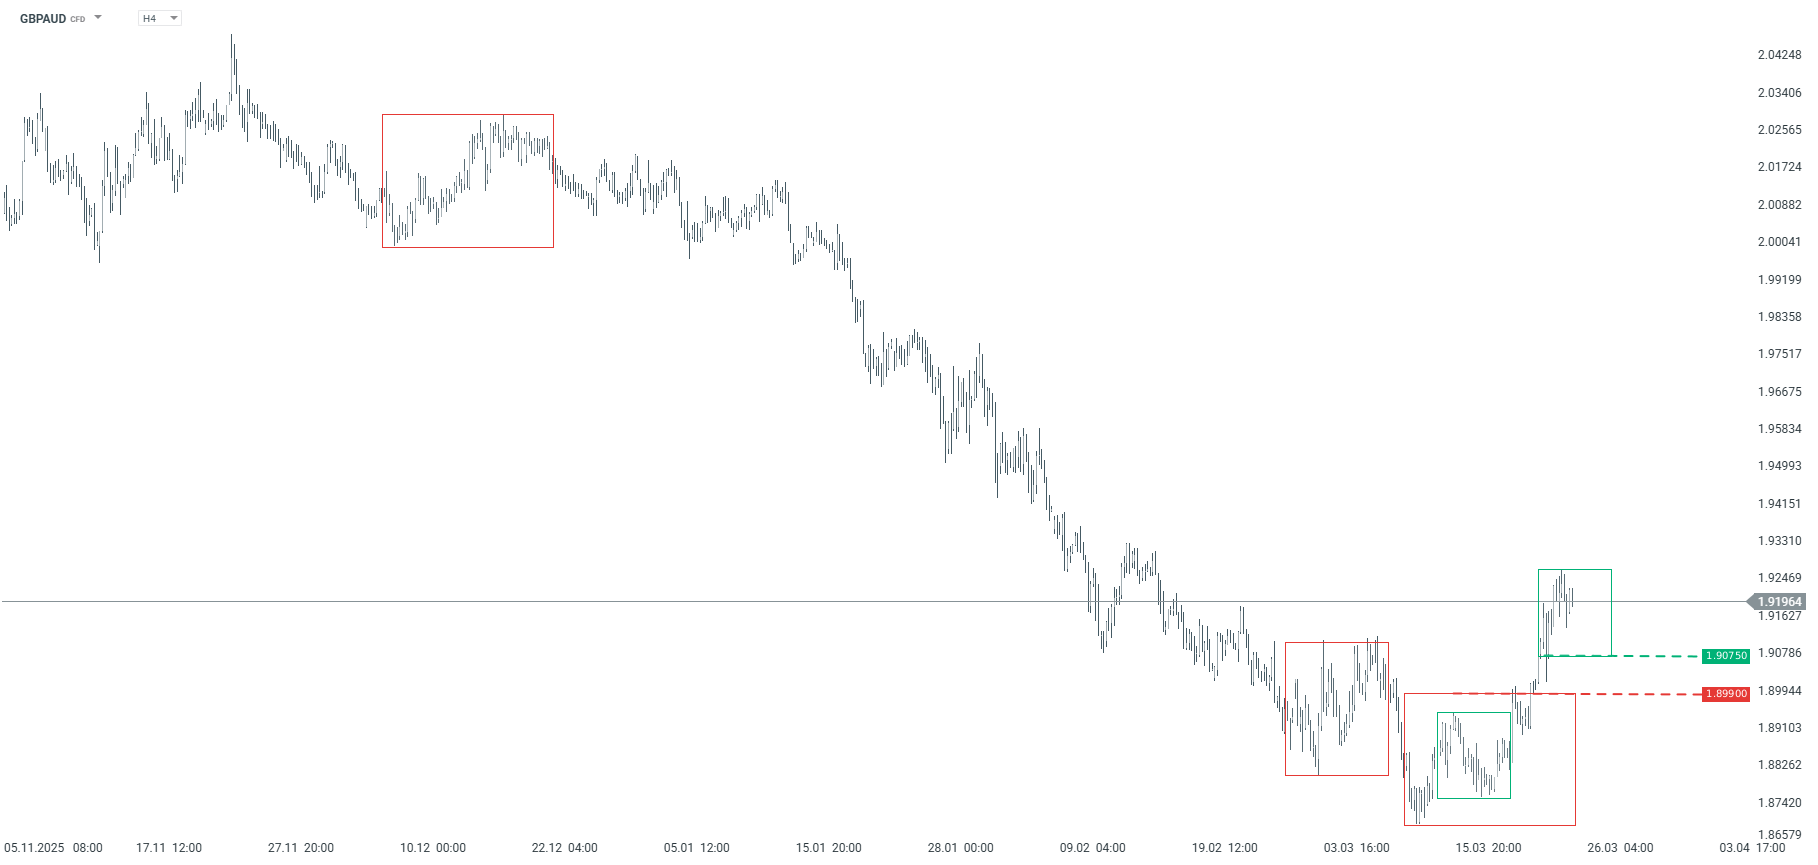
GBPAUD – H4 timeframe. Source: xStation

AUDNZD
The AUDNZD exchange rate has been in an uptrend since April of last year. Due to the prolonged period without a major correction, the recent downward move is similar in magnitude to previous corrections, allowing us to identify support at the 1.1730 level, where the lower boundary of the 1:1 pattern is located. According to the Overbalance methodology, as long as this level holds, the uptrend remains in effect.

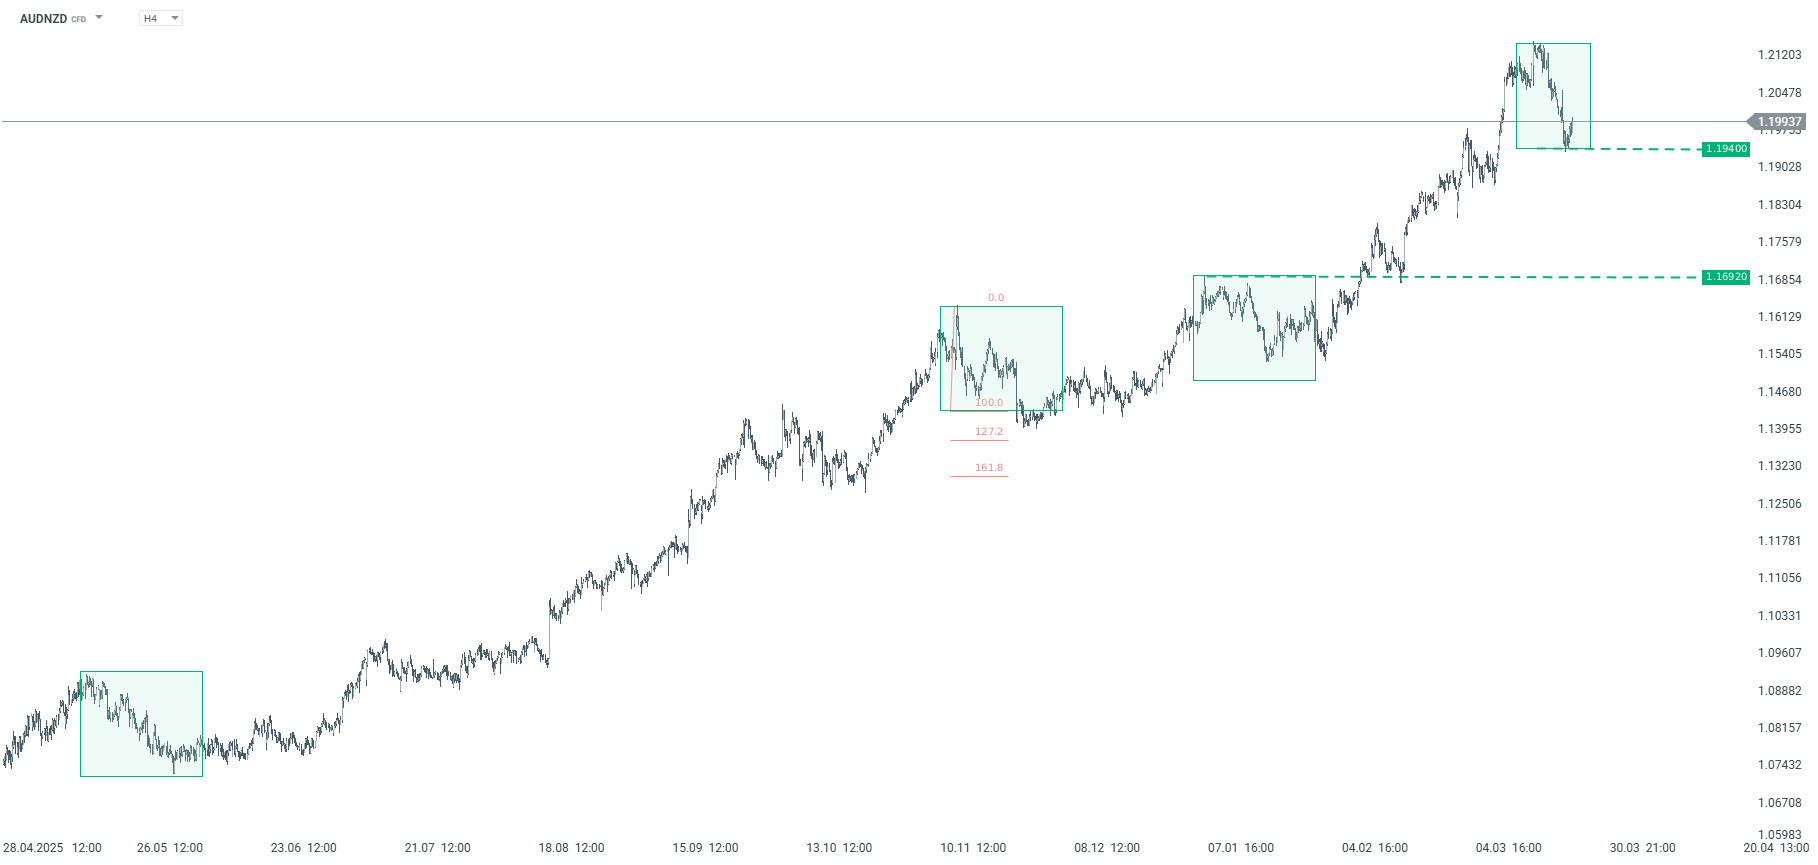
AUDNZD – H4 timeframe. Source: xStation

EURAUD
Since last October, the EURAUD pair has been trading in a downtrend; however, in recent days, the 1.6545 level has been broken, which may suggest the start of an upward correction or even a trend reversal. According to the Overbalance methodology, as long as the price remains above this level, the base case scenario remains a continuation of the uptrend. Conversely, a return below 1.6545, as well as a break below the 1.6506 level—where the lower boundary of the local 1:1 uptrend pattern lies—could signal a return to the downtrend. For now, the base case remains an upward correction.

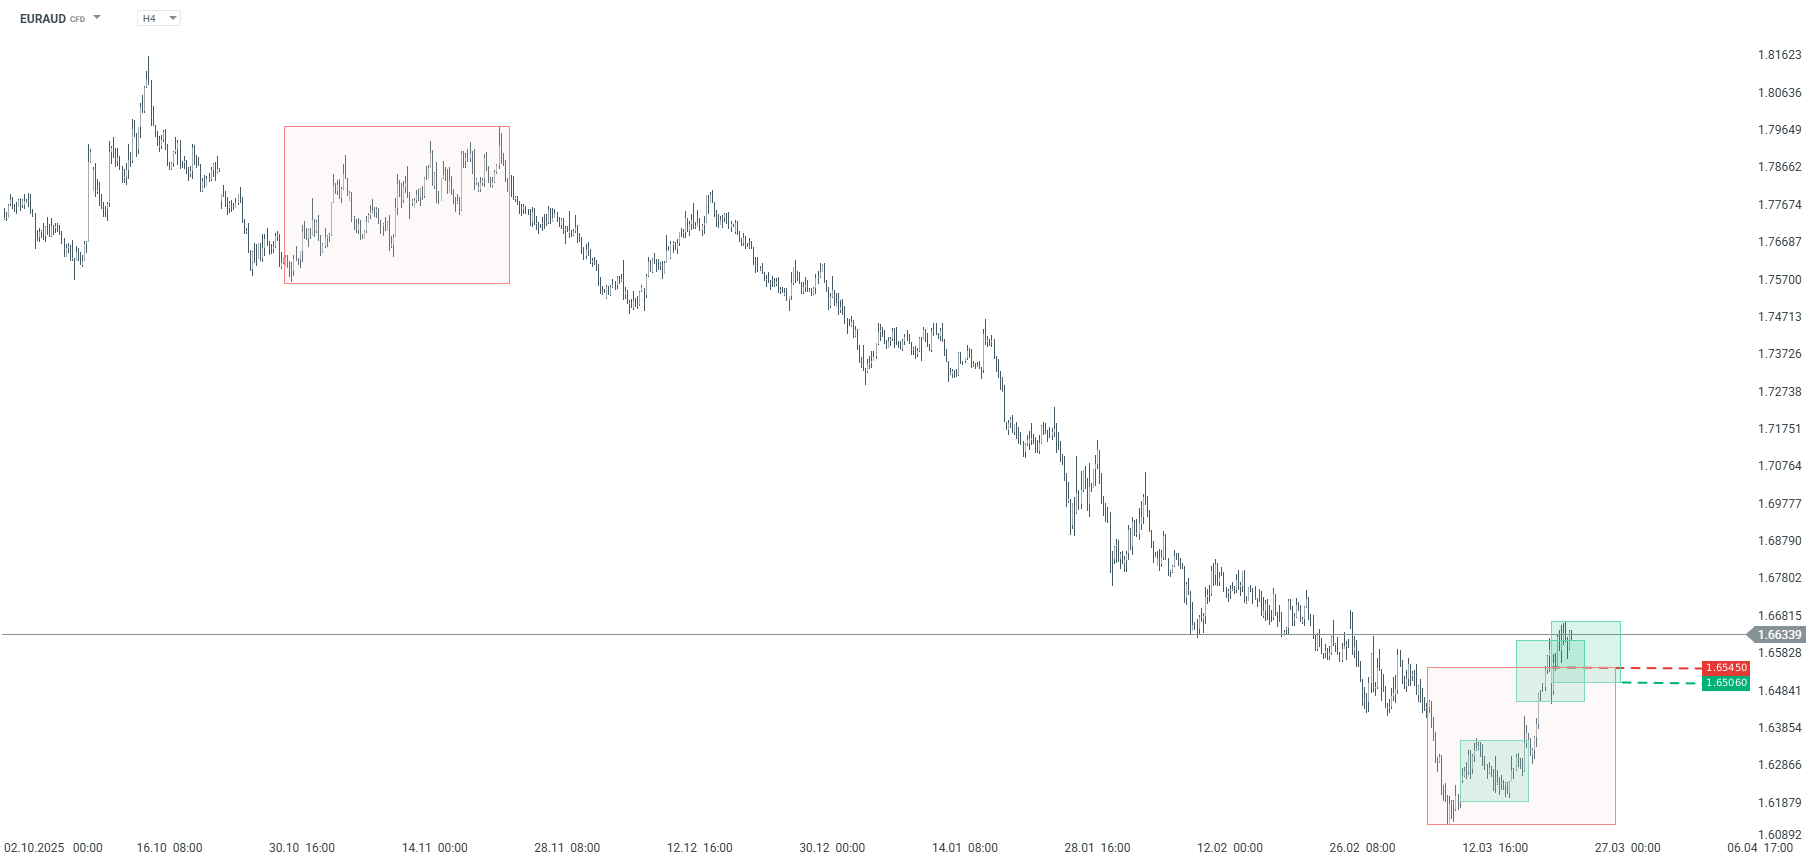
EURAUD – H4 timeframe. Source: xStation

The material on this page does not constitute financial advice and does not take into account your level of understanding, investment objectives, financial situation or any other specific needs. All information provided, including opinions, market research, mathematical results and technical analyzes published on the Website or transmitted To you by other means, it is provided for information purposes only and should in no way be construed as an offer or solicitation for a transaction in any financial instrument, nor should the information provided be construed as advice of a legal or financial nature on which any investment decisions you make should be based exclusively To your level of understanding, investment objectives, financial situation, or other specific needs, any decision to act on the information published on the Website or sent to you by other means is entirely at your own risk if you In doubt or unsure about your understanding of a particular product, instrument, service or transaction, you should seek professional or legal advice before trading. Investing in CFDs carries a high level of risk, as they are leveraged products and have small movements Often the market can result in much larger movements in the value of your investment, and this can work against you or in your favor. Please ensure you fully understand the risks involved, taking into account investments objectives and level of experience, before trading and, if necessary, seek independent advice.

Currency Hedger No Comments

Australian Dollar underperforms as Iran pushes back hopes of peace talks

  • The Australian Dollar underperforms across the board as risk-aversion revives after Iran dismisses peace talks with the US.
  • US President Trump announced on Monday that military attacks on Iran’s power plants have been postponed.
  • Weak Australian PMI data has also weighed on the Australian Dollar.

The Australian Dollar (AUD) trades lower against its major currency peers, trading 0.6% down to near 0.6760 during the Asian trading session on Tuesday. The antipodean has come under pressure as remarks from Iran that they are not involved in any peace talks with the United States (US), which were contrary to comments from President Donald Trump, have revived the risk-aversion mood.

Australian Dollar Price Today

The table below shows the percentage change of Australian Dollar (AUD) against listed major currencies today. Australian Dollar was the weakest against the US Dollar.

USDEURGBPJPYCADAUDNZDCHF
USD0.21%0.21%0.14%0.18%0.53%0.35%0.26%
EUR-0.21%-0.02%-0.07%-0.03%0.33%0.14%0.05%
GBP-0.21%0.02%-0.04%-0.02%0.34%0.16%0.07%
JPY-0.14%0.07%0.04%0.05%0.39%0.21%0.12%
CAD-0.18%0.03%0.02%-0.05%0.34%0.16%0.08%
AUD-0.53%-0.33%-0.34%-0.39%-0.34%-0.17%-0.29%
NZD-0.35%-0.14%-0.16%-0.21%-0.16%0.17%-0.09%
CHF-0.26%-0.05%-0.07%-0.12%-0.08%0.29%0.09%

The heat map shows percentage changes of major currencies against each other. The base currency is picked from the left column, while the quote currency is picked from the top row. For example, if you pick the Australian Dollar from the left column and move along the horizontal line to the US Dollar, the percentage change displayed in the box will represent AUD (base)/USD (quote).

On Monday, US President Trump announced that he has instructed the Department of War to pause military attacks on Iran’s power plants for five days, as we are having “very good and productive conversations” with Tehran regarding a complete and total resolution of our hostilities in the Middle East.

The revival of risk-off sentiment has offered support to the US Dollar, which declined significantly after US President Trump’s remarks. As of writing, the US Dollar Index (DXY), which tracks the Greenback’s value against six major currencies, trades 0.25% higher to near 99.40.

In addition to deteriorating market sentiment, weak preliminary Australian S&P Global Purchasing Managers’ Index (PMI) data for March has also weighed on the Australian Dollar. Earlier in the day, the data showed that the overall business activity swung to contraction due to a sharp decline in the services sector output.

The Composite PMI arrived at 47.0 against 52.4 in February. A figure below 50.0 is considered a contraction in the business activity.

Meanwhile, investors await the Australian Consumer Price Index (CPI) data for February, which will be released on Wednesday. However, the impact of the Feb inflation data is expected to be limited on the Reserve Bank of Australia’s (RBA) monetary policy outlook, as it would lack the impact of the recent surge in energy prices due to the Iran conflict.

Currency Hedger No Comments

Pound Sterling weakens as Middle East tensions escalate

  • GBP/USD depreciates amid rising Middle East conflict. 
  • Gulf states are near direct involvement in the Iran conflict, with Saudi Arabia signaling a potential military shift. 
  • Traders await Tuesday’s flash S&P Global PMI data for March from both economies.

The GBP/USD pair faces selling pressure after registering modest gains in the previous day, trading near 1.3400 during the Asian session on Tuesday. The risk-sensitive pair weakens amid rising risk aversion as US-aligned Gulf states move closer to direct involvement in the Iran conflict, with Saudi Arabia signaling a potential military shift, according to a Wall Street Journal report.

Israel launched its latest attack on Iran despite US President Donald Trump signaling a pause in strikes on energy infrastructure after what he described as productive talks with Tehran. However, Iran’s Foreign Minister Abbas Araghchi denied any engagement with Washington. Iranian Parliament Speaker Mohammad Bagher Ghalibaf also said on Monday that no negotiations had taken place with the US. Meanwhile, senior military adviser Mohsen Rezaei stated that the conflict would persist until Iran receives full compensation for the damage incurred.

Traders await Tuesday’s flash S&P Global Purchasing Managers’ Index (PMI) data for March headlines the calendar on both sides of the pair. UK manufacturing PMI is expected at 51.1, down from 51.7, with services forecast at 53.0 versus 53.9 previously; any further softening would test the hawkish BoE repricing.

The Bank of England (BoE) kept interest rates steady at 3.75% at its March meeting on Thursday, as widely expected. BoE Governor Andrew Bailey said the Middle East conflict will cause a “shock to the economy” and push up inflation in the near term, adding that restoring safe shipping through the Strait of Hormuz is key to addressing rising energy prices.

Pound Sterling Price Today

The table below shows the percentage change of British Pound (GBP) against listed major currencies today. British Pound was the weakest against the US Dollar.

USDEURGBPJPYCADAUDNZDCHF
USD0.21%0.24%0.14%0.18%0.55%0.36%0.20%
EUR-0.21%0.00%-0.07%-0.03%0.34%0.14%-0.01%
GBP-0.24%-0.00%-0.06%-0.04%0.34%0.14%-0.01%
JPY-0.14%0.07%0.06%0.05%0.42%0.22%0.07%
CAD-0.18%0.03%0.04%-0.05%0.37%0.17%0.03%
AUD-0.55%-0.34%-0.34%-0.42%-0.37%-0.19%-0.37%
NZD-0.36%-0.14%-0.14%-0.22%-0.17%0.19%-0.15%
CHF-0.20%0.00%0.01%-0.07%-0.03%0.37%0.15%

The heat map shows percentage changes of major currencies against each other. The base currency is picked from the left column, while the quote currency is picked from the top row. For example, if you pick the British Pound from the left column and move along the horizontal line to the US Dollar, the percentage change displayed in the box will represent GBP (base)/USD (quote).

Currency Hedger No Comments

EUR/USD slips below 1.1600 as Middle East tensions escalate

  • EUR/USD weakens after fresh Israeli strikes hit Tehran.
  • President Trump announced a five-day truce following productive talks with Iran.
  • Iran’s Foreign Minister Abbas Araghchi denied any direct talks with Washington.

EUR/USD loses ground after registering modest gains in the previous session, trading around 1.1590 during the Asian hours on Tuesday. The pair depreciates as the US Dollar (USD) gains on increased risk aversion amid escalating Middle East conflict.

The Guardian reported on Tuesday that the Israeli military noted that it had launched a fresh wave of strikes on Tehran. This action came after US President Donald Trump signalled a pause in US attacks against energy infrastructure after what he said were productive talks with Iran. The Israeli Defense Forces (IDF) stated that it would continue operations in line with Israeli government directives until told otherwise.

Iran’s Foreign Minister, Abbas Araghchi, stated that there was “no dialogue” between Tehran and Washington. Meanwhile, Iranian Parliament Speaker Mohammad Bagher Ghalibaf said in a social media post on Monday that “no negotiations have been held with the US.” Mohsen Rezaei, the senior military adviser to Iranian Supreme Leader Mojtaba Khamenei, said that the war will continue until Iran receives full compensation for the damage it has sustained.

Reuters reported on Monday that San Francisco Federal Reserve Bank President Mary Daly said that unless the Iran conflict resolves quickly and the central bank can simply “look through” a temporary increase in oil prices, it is not clear what the next move on interest rates will need to be.

Rising oil prices are fueling inflation concerns and strengthening the European Central Bank’s (ECB) hawkish stance. The ECB left rates unchanged at last week’s meeting, citing the Iran conflict as a source of “significantly more uncertain” outlook.

Officials pointed to increasing inflation risks alongside weaker growth prospects, leading markets to boost expectations of potential rate hikes later this year. Policymakers are scheduled to speak on Monday, and any hawkish signals could provide support to the Euro.

Currency Hedger No Comments

USD/CAD Price Tests 1.3700 support near moving averages

  • USD/CAD could test the upper rectangle channel boundary around 1.3750.
  • The 14-day Relative Strength Index holds in the mid-50s, signaling strengthening buying pressure.
  • The immediate support lies at the 1.3700 psychological level, aligned with the nine- and 50-day EMAs.
USD/CAD continues to lose ground for the second successive session, trading around 1.3710 during the Asian hours on Monday. The near-term bias holds mildly bullish as spot advances above the nine- and 50-day Exponential Moving Average (EMA), indicating an emerging upward correction within a broader range. Momentum supports this bid tone, with the 14-day Relative Strength Index (RSI) holding in the mid-50s after recovering from sub-40 readings, signalling improving buying pressure rather than overbought conditions. The technical analysis of the daily chart shows the USD/CAD pair remaining close to the upper boundary of the rectangle channel pattern around 1.3750. A successful break above the channel would offer confirmation of a bullish bias and support the pair to target the three-month high of 1.3928, recorded on January 16. On the downside, the immediate support lies at the psychological level of 1.3700, aligned with the nine- and 50-day EMAs of 1.3697 and 1.3696, respectively. Further declines below these averages would put downward pressure on the USD/CAD pair to navigate the region around the lower boundary of rectangle 1.3540.
USD/CAD: Daily Chart

Canadian Dollar Price Today

The table below shows the percentage change of Canadian Dollar (CAD) against listed major currencies today. Canadian Dollar was the strongest against the Australian Dollar.
USD EUR GBP JPY CAD AUD NZD CHF
USD 0.21% 0.16% 0.08% -0.11% 0.63% 0.45% 0.15%
EUR -0.21% -0.06% -0.11% -0.33% 0.53% 0.23% -0.07%
GBP -0.16% 0.06% -0.06% -0.27% 0.59% 0.29% -0.02%
JPY -0.08% 0.11% 0.06% -0.18% 0.54% 0.29% 0.06%
CAD 0.11% 0.33% 0.27% 0.18% 0.71% 0.42% 0.22%
AUD -0.63% -0.53% -0.59% -0.54% -0.71% -0.29% -0.47%
NZD -0.45% -0.23% -0.29% -0.29% -0.42% 0.29% -0.26%
CHF -0.15% 0.07% 0.02% -0.06% -0.22% 0.47% 0.26%
The heat map shows percentage changes of major currencies against each other. The base currency is picked from the left column, while the quote currency is picked from the top row. For example, if you pick the Canadian Dollar from the left column and move along the horizontal line to the US Dollar, the percentage change displayed in the box will represent CAD (base)/USD (quote).