USD/CAD slips as easing US-Iran geopolitical tensions reduced safe-haven demand and sparked a market risk-on rally.
Despite a brief US-Iran pause, markets fear supply disruptions following Houthi attacks on Saudi Red Sea facilities.
Falling oil prices could weigh on the commodity-linked Canadian Dollar.
USD/CAD depreciates after posting minor gains in the previous trading day, hovering around 1.4080 during the Asian hours on Monday. The pair loses ground as the US Dollar (USD) falls sharply on easing geopolitical tensions following a weekend pause in military hostilities between the US and Iran.
The brief US-Iran pause came after 13 days of escalating conflict. However, market participants remain cautious about potential supply disruptions as Iran-backed Houthis in Yemen claimed responsibility for attacks on Saudi Arabian facilities along the Red Sea.
Reports suggest that the US halted strikes amid growing concerns over depleting interceptor supplies and a shortage of remaining targets within Iran. Additionally, General Dan Caine, Chairman of the Joint Chiefs of Staff, reportedly cautioned President Trump on Friday that continuing the campaign would severely strain critical munitions reserves.
On the policy front, the Fed is widely expected to hold interest rates steady on Wednesday before resuming rate hikes in September, though a minority of market participants still anticipate a surprise move at this week’s meeting.
The downside of the USD/CAD pair is restrained as the commodity-linked Canadian Dollar (CAD) could struggle on lower oil prices. West Texas Intermediate (WTI) oil price opened at a bearish gap, down by over 5%, trading around $84.50 per barrel at the time of writing.
USD/CAD meets with a fresh supply amid a softer USD, though the downside seems limited.
Retreating oil prices, the divergent BoC-Fed expectations, and Trump’s tariffs favor USD bulls.
Traders look to flash US PMIs for some impetus as the focus remains on the FOMC next week.
The USD/CAD pair attracts fresh sellers during the Asian session on Friday and currently trades around the 1.4070 zone, down 0.10% for the day amid a softer US Dollar (USD). Spot prices, however, hold above the previous day’s swing low and remain on track to register modest gains for the first time in three weeks.
Crude oil prices retreat from the highest level since June 11 amid some profit-taking heading into the week. Adding to this, divergent Bank of Canada (BoC) and US Federal Reserve (Fed) policy expectations, along with US President Donald Trump’s new tariffs, contribute to keeping a lid on the commodity-linked Loonie. Moreover, the underlying USD bullish tone warrants some caution before placing aggressive bearish bets on the USD/CAD pair.
This week’s soft Canadian consumer inflation figures reaffirmed bets that the BoC will keep interest rates unchanged through the remainder of 2026. In contrast, traders have been pricing in a greater chance that the US central bank will raise borrowing costs by the end of this year amid concerns about energy-driven inflation. Apart from this, a further escalation of tensions between the US and Iran should help limit deeper losses for the safe-haven buck.
Meanwhile, the Trump administration is set to impose sweeping new tariffs of 10% to 12.5% on 60 of the top trading partners, covering nearly all of the country’s imports. This further tempers investors’ appetite for riskier assets amid persistent geopolitical uncertainties and favors USD bulls, making it prudent to wait for some follow-through selling before confirming that the USD/CAD pair’s recovery from over a one-month low has run out of steam.
Traders now look forward to the release of the flash US PMIs, which might influence the USD. Furthermore, fresh developments surrounding the Middle East crisis will drive oil price dynamics and provide some impetus to the USD/CAD pair amid a broadly constructive setup. The focus will then shift to the highly-anticipated two-day FOMC meeting next week, which will help in determining the near-term trajectory for the Greenback and the currency pair.
USD/CAD edges lower during the Asian session, though the downside remains limited.
Bullish oil prices underpin the Loonie and cap spot prices amid subdued USD demand.
The divergent Fed-BoC policy bets back the case for the emergence of some dip-buying.
The USD/CAD pair struggles to capitalize on its strong weekly gains registered over the past two days and edges lower during the Asian session on Wednesday. Spot prices currently trade around the 1.4100 round figure, though the fundamental backdrop warrants caution for aggressive bearish traders.
Crude Oil prices climb to a fresh high since June 16 amid escalating US-Iran military conflicts, the closure of the Strait of Hormuz and Houthi threats of a naval blockade on Saudi Arabia. This, in turn, is seen lending some support to the commodity-linked Loonie. The US Dollar (USD), on the other hand, pauses for a breather following a four-day move higher and turns out to be another factor acting as a headwind for the USD/CAD pair.
Meanwhile, the ongoing fighting in the Middle East, along with fresh trade war fears, might continue to underpin the safe-haven Greenback. In fact, US President Donald Trump announced a new tariff plan on imported generic drugs, with duties set to rise sharply to 100% from 2028 and then increase further to 200% the next year. This follows a new tariff of 50% on most Canadian products, which should cap the upside for the Canadian Dollar (CAD).
Furthermore, hawkish US Federal Reserve (Fed) expectations, bolstered by concerns about energy-driven inflation, favor the USD bulls. In contrast, this week’s soft Canadian consumer inflation figures reaffirmed bets that the Bank of Canada (BoC) will keep rates unchanged through the remainder of 2026. This, in turn, suggests that the path of least resistance for the USD/CAD pair is to the downside and backs the case for the emergence of dip-buyers.
USD/CAD builds on the previous day’s solid recovery from an over one-month trough.
The fundamental backdrop favors bullish traders and backs the case for further gains.
A move beyond the 1.4100 confluence is needed to reaffirm the constructive setup.
The USD/CAD pair attracts buyers for the second straight day on Tuesday and recovers further from its lowest level since June 17, around the 1.4000 psychological mark touched the previous day. Spot prices advanced to a one-week high during the Asian session, though the intraday move up stalls ahead of the 1.4100 mark amid mixed fundamental cues.
The soft Canadian consumer inflation figures on Monday reaffirmed bets that the Bank of Canada (BoC) will keep interest rates unchanged through the remainder of 2026. This marks a significant divergence in comparison to expectations that the US Federal Reserve (Fed) will raise borrowing costs at least once in 2026 amid concerns about energy-driven inflation. Apart from this, US President Donald Trump’s new tariff of 50% on Canadian products undermines the Canadian Dollar (CAD) and acts as a tailwind for the USD/CAD pair.
Meanwhile, hawkish Fed expectations and an escalation of tensions between the US and Iran continue to act as a tailwind for the safe-haven US Dollar (USD). This is seen as another factor supporting the currency pair. That said, elevated oil prices, bolstered by the closure of the Strait of Hormuz, hold back traders from placing aggressive bearish bets on the commodity-linked Loonie and cap gains for the USD/CAD pair. Nevertheless, the broader fundamental backdrop suggests that the path of least resistance for spot prices is to the upside.
From a technical perspective, the overnight breakout through the 23.6% Fibonacci retracement level of the recent pullback from the highest level since April 2025 favors bullish traders. Furthermore, the Moving Average Convergence Divergence (MACD) is turning positive, and the Relative Strength Index (RSI) is hovering around 56. Momentum indicators together hint at recovering upside pressure. That said, it will still be prudent to wait for a move beyond the 1.4100 confluence before positioning for any further near-term appreciation.
The said handle comprises the 38.2% Fibo. level and the 200-period Simple Moving Average (SMA) on the 4-hour chart, above which the USD/CAD pair could climb to the 50.0% retracement at 1.4126 and the 61.8% level at 1.4155. On the downside, support emerges at the 23.6% retracement near 1.4059, with a more substantial structural floor at the Fibonacci anchor around 1.4000, where a deeper pullback could pause if selling pressure resumes.
USD/CAD 4-hour chart
Canadian Dollar Price This week
The table below shows the percentage change of Canadian Dollar (CAD) against listed major currencies this week. Canadian Dollar was the strongest against the Swiss Franc.
USD
EUR
GBP
JPY
CAD
AUD
NZD
CHF
USD
0.09%
0.09%
0.10%
0.40%
-0.59%
-0.50%
0.21%
EUR
-0.09%
0.01%
-0.06%
0.31%
-0.67%
-0.60%
0.11%
GBP
-0.09%
-0.01%
-0.07%
0.30%
-0.65%
-0.61%
0.15%
JPY
-0.10%
0.06%
0.07%
0.39%
-0.64%
-0.65%
0.22%
CAD
-0.40%
-0.31%
-0.30%
-0.39%
-0.94%
-1.03%
-0.15%
AUD
0.59%
0.67%
0.65%
0.64%
0.94%
0.07%
0.84%
NZD
0.50%
0.60%
0.61%
0.65%
1.03%
-0.07%
0.76%
CHF
-0.21%
-0.11%
-0.15%
-0.22%
0.15%
-0.84%
-0.76%
The heat map shows percentage changes of major currencies against each other. The base currency is picked from the left column, while the quote currency is picked from the top row. For example, if you pick the Canadian Dollar from the left column and move along the horizontal line to the US Dollar, the percentage change displayed in the box will represent CAD (base)/USD (quote).
USD/CAD declines to around 1.4005 in Monday’s Asian session.
Iran said it targeted US aircraft in Jordan.
Cooling in June’s US inflation data slashed the immediate odds of a Fed July rate hike.
The USD/CAD pair extends its downside to near 1.4005 during the Asian trading hours on Monday. Rising crude oil prices provide some support to the commodity-linked Canadian Dollar (CAD) against the US Dollar (USD). Traders brace for the release of Canada’s Consumer Price Index (CPI) inflation data later on Monday.
The Guardian reported on Monday that US President Donald Trump said that the latest US strikes on Iran were being carried out in honor of US service members killed in recent days. Meanwhile, Iran’s Islamic Revolutionary Guard Corps (IRGC) said that the Strait of Hormuz will not be safe for petrochemical products or ‘single drop of oil and gas’ transit as long as US actions in the region continue. The Iranian military added that it targeted US aircraft at Jordan’s Aqaba airport with ballistic missiles.
Air raid sirens sounded across Bahrain after Iran carried out a fresh wave of ballistic missiles and one-way attack drones targeting sites in Bahrain, Jordan, Kuwait and Iraq. It is worth noting that Canada is a major oil-exporting country, and high crude oil prices generally have a positive impact on the Loonie.
Traders reduce their bets on the US interest rate hike in July after signs of softer inflation in the US, which could weigh on the Greenback. The odds for a Federal Reserve (Fed) rate hike in July stood at 14%, versus a 25% implied chance last week, according to the CME FedWatch tool. However, Fed Governor Christopher Waller warned that policymakers need to see “several months” of sustained cooling before taking rate hikes off the table.
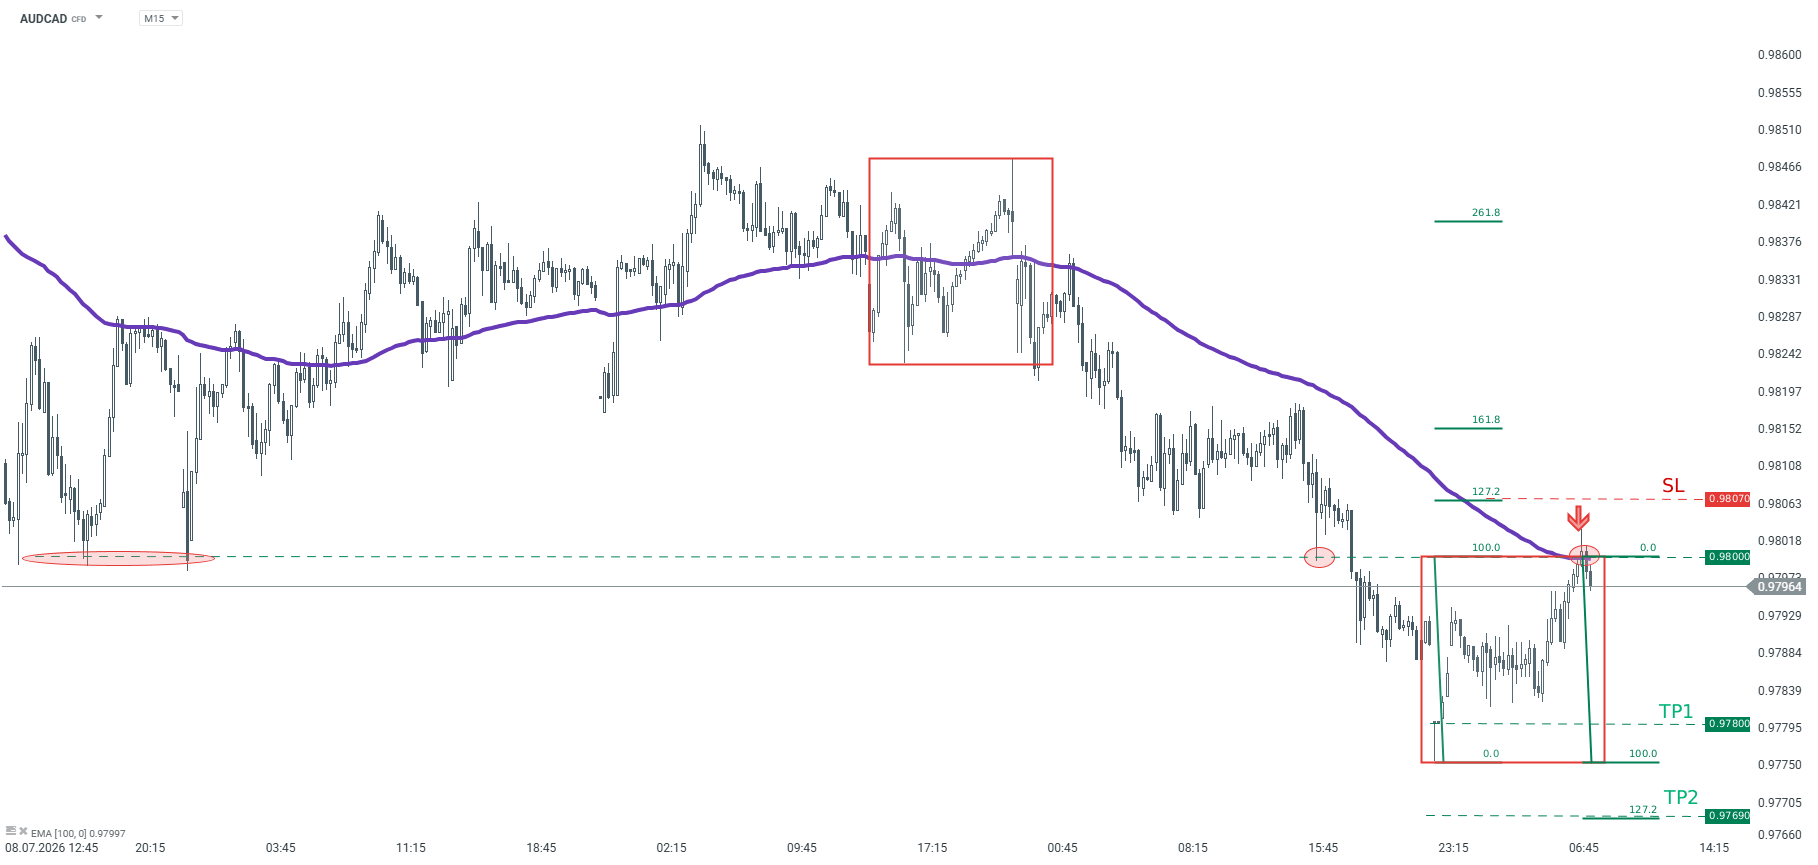
cts: The main trend on AUDCAD remains downward for a few days The price bounced off the upper limit of 1:1 structure at 0.9800
Recommendation: Trade: Short AUDCAD at market price Target: 0.9780, 0.9769 Stop: 0,9807
Opinion: Looking at the M15 interval, AUDCAD has been trading in a downward trend recently. Following an upward correction, the price failed to break above the resistance marked with the upper limit of 1:1 structure and 100-period moving average from the M15 interval, and started to pull back. According to the Overbalance methodology, the main sentiment prevails and we should expect the price to continue to fall. We recommend going short AUDCAD at market price with two targets: 0.9780 and 0.9769 . We also recommend placing stop loss at 0.9807. Source: xStation5
USD/CAD slips as the commodity-linked Canadian Dollar gains on higher oil prices.
Crude oil prices gain as Trump reinstated an Iranian blockade and imposed a 20% transit fee on other vessels securing the strait.
The US Dollar could receive support as intensifying Middle East tensions could drive global investors into safe-haven assets.
USD/CAD continues its losing streak after remaining flat in the previous day, trading around 1.4150 during the Asian hours on Tuesday. The pair depreciates as the commodity-linked Canadian Dollar (CAD) receives support from higher oil prices. It is important to note that Canada is the largest crude exporter to the United States (US).
Crude oil prices rise due to mounting supply anxieties following a sharp escalation of geopolitical hostilities in the Middle East. US President Donald Trump has reinstated a naval blockade targeting Iranian vessels and customers transiting the Strait of Hormuz, while simultaneously announcing that all other commercial cargo passing through the strategic waterway will be subject to a 20% reimbursement fee.
President Trump asserted that the US must be financially compensated for its military efforts to secure the volatile chokepoint, pointing directly to regional nations that benefit from US protection, including Saudi Arabia, the United Arab Emirates, Qatar, Bahrain, and Kuwait.
The USD/CAD pair’s downside remains limited as a wave of geopolitical tensions in the Middle East fuels safe-haven demand, which could drive investors back into the US Dollar (USD). At the same time, climbing crude oil prices are complicating the outlook; while higher oil typically boosts the commodity-linked Canadian Dollar (CAD), it is also triggering renewed fears that energy-driven inflation will force the Federal Reserve (Fed) to tighten policy further. Market expectations have shifted rapidly in response, with the CME FedWatch Tool now showing a 51% probability of a Fed rate hike in September, compared to just a 23% chance that rates will stay on hold.
Market participants are temporarily pausing ahead of two massive macroeconomic catalysts scheduled for Tuesday. First up is the US June Consumer Price Index (CPI) report, where analysts anticipate a divergence between a 0.1% month-on-month decline in headline inflation and a sticky 0.3% increase in the core reading. Shortly after, Federal Reserve Chair Kevin Warsh will deliver highly anticipated congressional testimony, a session that traders will dissect word-by-word for hints on whether the central bank will validate the market’s growing hawkishness.
USD/CAD drifts higher to around 1.4165 in Monday’s Asian session.
The US launched a new wave of strikes against Iran aimed at ‘degrading’ the military.
The BoC is likely to hold the rate steady on Wednesday.
The USD/CAD pair gains traction to near 1.4165, snapping the four-day losing streak during the Asian trading hours on Monday. The US Dollar (USD) strengthens against the Canadian Dollar (CAD) amid lingering tensions regarding the US-Iran conflict. The US June Consumer Price Index (CPI) inflation report will be the highlight later on Tuesday.
The US military carried out multiple attacks across Iran, saying they were aimed at “degrading” Tehran’s ability to disrupt commercial vessels in the Strait of Hormuz, per Bloomberg. The Islamic Revolutionary Guard Corps (IRGC) then launched retaliatory drone and missile assaults on US allies across the Middle East, including Kuwait, Jordan, Qatar, Bahrain, and Jordan.
Over the weekend, Iran stated that the Strait of Hormuz would now be closed “until further notice.” Signs of escalating tensions in the Middle East could boost a safe-haven currency such as the Greenback against the CAD in the near term.
On the other hand, a stronger-than-expected Canadian jobs report could provide some support to the Loonie. Data released by Statistics Canada on Friday showed that Canada’s economy added 18.2K jobs in June, continuing the momentum in the job market seen the month before. This figure followed a rise of 87.8K in May and was above the market consensus of 10K. The Unemployment Rate fell to 6.5% in June from 6.6% in May, better than the expectation of 6.6%.
The Bank of Canada (BoC) is anticipated to hold its overnight rate at 2.25% at its July policy meeting on Wednesday and keep it there well into next year as price pressures remain largely contained and the economy gradually recovers, a Reuters poll showed.
To provide the best experiences, we use technologies like cookies to store and/or access device information. Consenting to these technologies will allow us to process data such as browsing behavior or unique IDs on this site. Not consenting or withdrawing consent, may adversely affect certain features and functions.
Functional
Always active
The technical storage or access is strictly necessary for the legitimate purpose of enabling the use of a specific service explicitly requested by the subscriber or user, or for the sole purpose of carrying out the transmission of a communication over an electronic communications network.
Preferences
The technical storage or access is necessary for the legitimate purpose of storing preferences that are not requested by the subscriber or user.
Statistics
The technical storage or access that is used exclusively for statistical purposes.The technical storage or access that is used exclusively for anonymous statistical purposes. Without a subpoena, voluntary compliance on the part of your Internet Service Provider, or additional records from a third party, information stored or retrieved for this purpose alone cannot usually be used to identify you.
Marketing
The technical storage or access is required to create user profiles to send advertising, or to track the user on a website or across several websites for similar marketing purposes.