The Australian dollar is sliding today against all G10 currencies in response to lower-than-expected CPI inflation data in Australia (AUD/USD, AUD/NZD: -0.3%). Both the latest reading for June and the full Q2 report came in below 4%, delivering the Reserve Bank of Australia (RBA) the first fruits of months of aggressive interest rate hikes.
Technical Analysis: AUDUSD (D1)
AUDUSD is testing key levels amidst intensifying selling pressure. Defending the 50.0% and 61.8% Fibonacci retracements is essential to prevent a deeper decline toward the 0.6900 area. A move below the yellow buffer zone (0.68800–0.69000) would signal a decisive return of the downtrend, potentially exacerbated by further disinflation in Australia. The RSI remains near the neutral 50 level, leaving room for further bearish pressure. The only hope for the bulls remains a very dovish signal from the Fed and a return above the 100-day EMA (dark purple). However, this scenario seems unlikely given the strong US labor market (stable unemployment, record-low jobless claims), rising PMI readings, and Warsh’s uncompromising stance on above-target inflation.
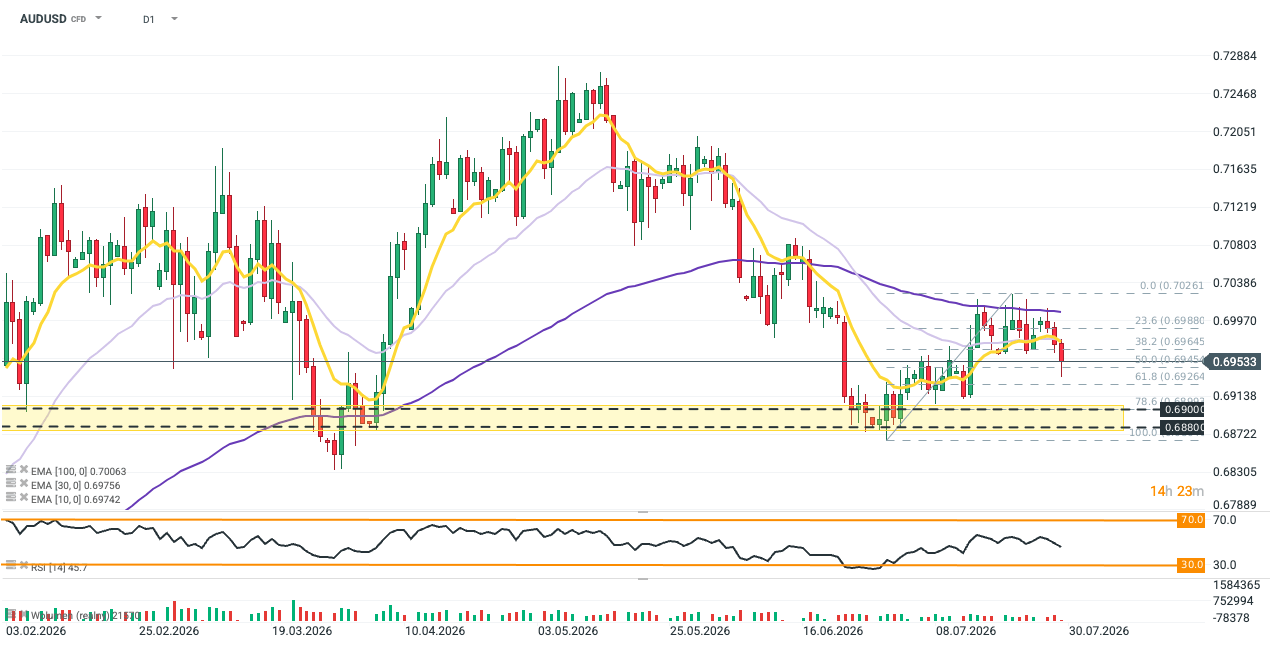
Source: xStation5
What is driving the AUDUSD decline today?
- Inflation drops below 4% : Australia’s annual CPI inflation rate fell to 3.8% YoY in June from 4.0% in May, dropping 0.1% month-on-month. In the second quarter, inflation slowed to 0.6% QoQ (4.0% YoY) compared to 1.4% QoQ in Q1. Crucially for the RBA, trimmed mean inflation came in at 3.6% YoY (0.8% QoQ), falling below the central bank’s forecast (3.8%).
- Cheaper fuel saves the reading: The main dampening factor was a nearly 11% drop in fuel prices in June, translating into disinflation in transport and goods. On the other hand, the housing sector weighed heavily (+6.8% YoY), where new home construction costs jumped 5.8% YoY due to higher material and labor costs. Furthermore, services inflation accelerated to 4.0% YoY, pointing to ongoing domestic price pressures in the economy.
- Market wipes out rate hike expectations: The swap-market-implied probability of an August rate hike in Australia dropped to zero. In fact, expectations fell across all time horizons. Interest rates in Australia are currently the highest among all G10 economies (4.35%). The last rate hike occurred in May, while subsequent months brought dovish signals from the RBA governor, who indicated that the current rate level is a good place to take a breather.
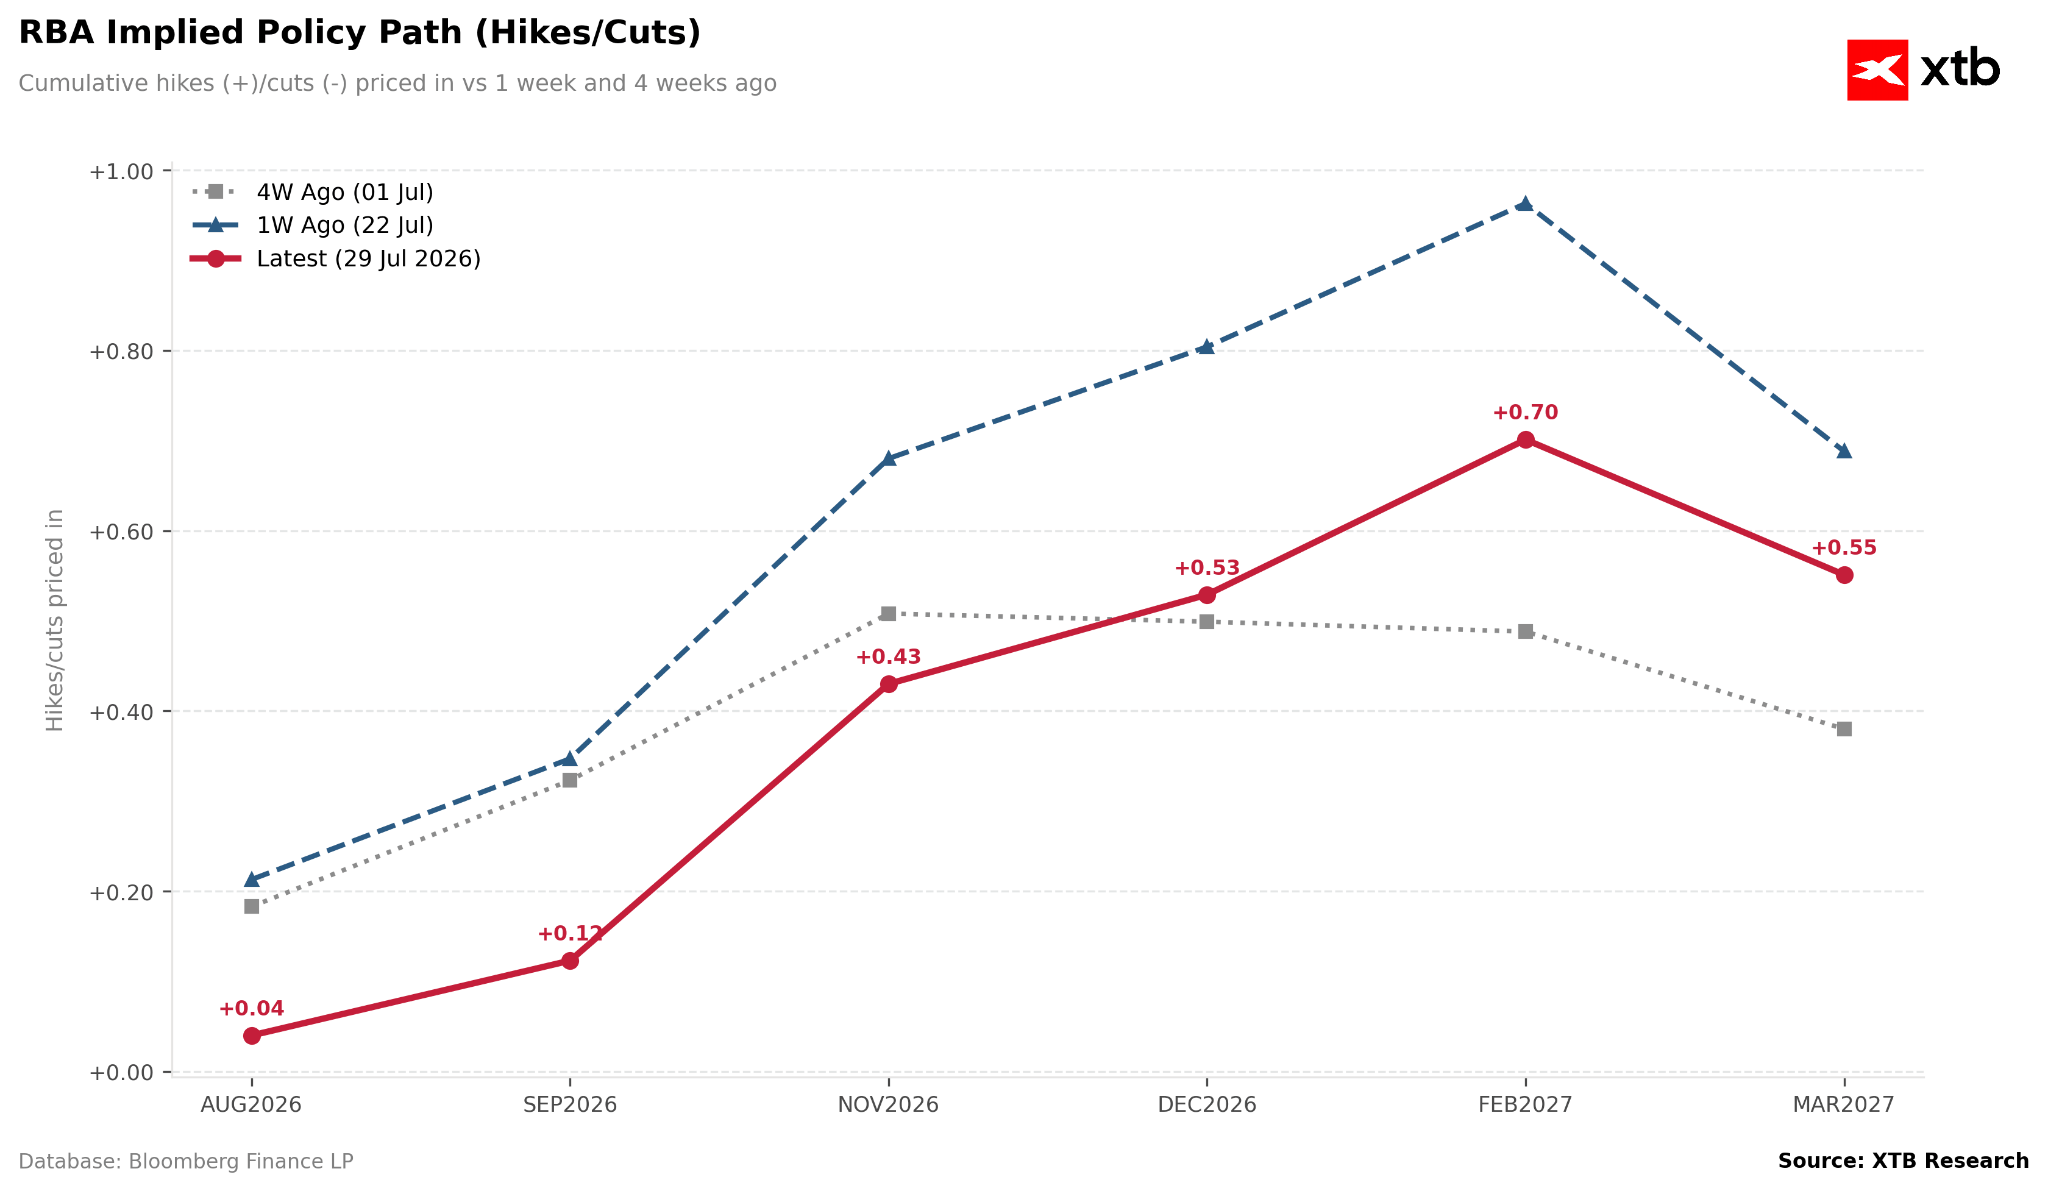
The market no longer pricing in a full interest rate hike in Australia until March 2027. Pricing from last week indicated a move in February with near certainty (blue line), whereas currently, we are approaching the flat curve from a month ago, which signaled a pause alongside hopes at the time for an end to the Middle East conflict. Source: XTB Research.