- AUD/USD rises as falling oil prices and a pause in the Middle East conflict weigh on the US Dollar.
- US military caution and depleted interceptor supplies help curb further escalation with Iran for now.
- Strong Australian June employment data boosts expectations of another RBA rate hike following upcoming inflation reports.
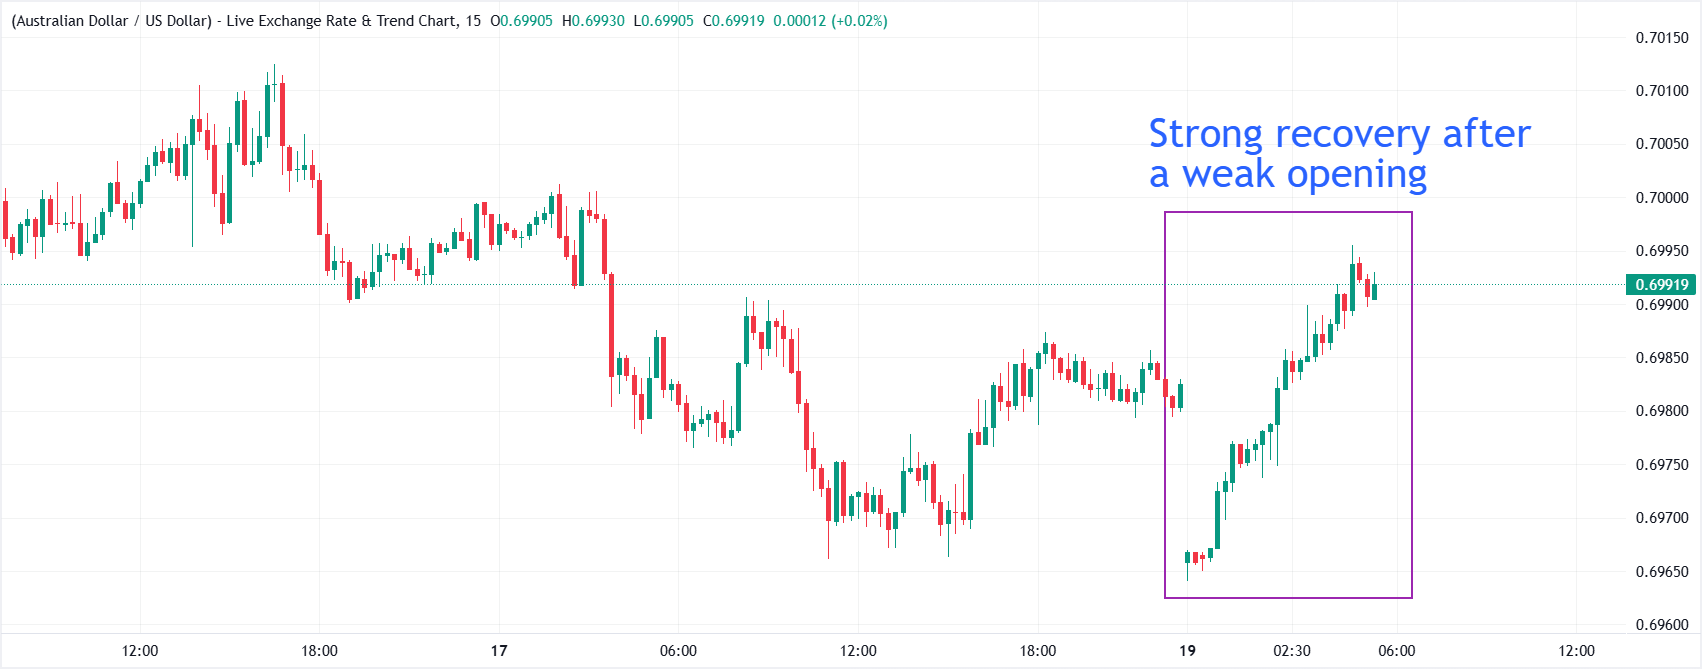
AUD/USD extends its gains for the second consecutive trading day, hovering near 0.7000 during the Asian hours on Monday. The pair appreciates as the US Dollar (USD) declines alongside a sharp drop in oil prices. This movement followed the United States (US) decision to refrain from striking Iran over the weekend, paired with Tehran suspending its own retaliatory strikes.
The brief US-Iran pause came after 13 days of escalating conflict. However, market participants remain cautious about potential supply disruptions as Iran-backed Houthis in Yemen claimed responsibility for attacks on Saudi Arabian facilities along the Red Sea.
While the US did not officially disclose its reasons for halting the strikes, reports suggest growing concerns over depleting interceptor supplies and a shortage of remaining targets within Iran. Additionally, General Dan Caine, Chairman of the Joint Chiefs of Staff, reportedly cautioned President Trump on Friday that continuing the campaign would severely strain critical munitions reserves.
Beyond geopolitical developments, investors are bracing for the upcoming Federal Reserve (Fed) policy meeting. The Fed is widely expected to hold interest rates steady on Wednesday before resuming rate hikes in September, though a minority of market participants still anticipate a surprise move at this week’s meeting.
Meanwhile, strong June employment data out of Australia has reinforced expectations of further monetary tightening by the Reserve Bank of Australia (RBA), which has already raised rates three times this year. Investors are now closely watching the June and Q2 inflation figures due later this week, as persistent price pressures continue to dominate the local outlook.