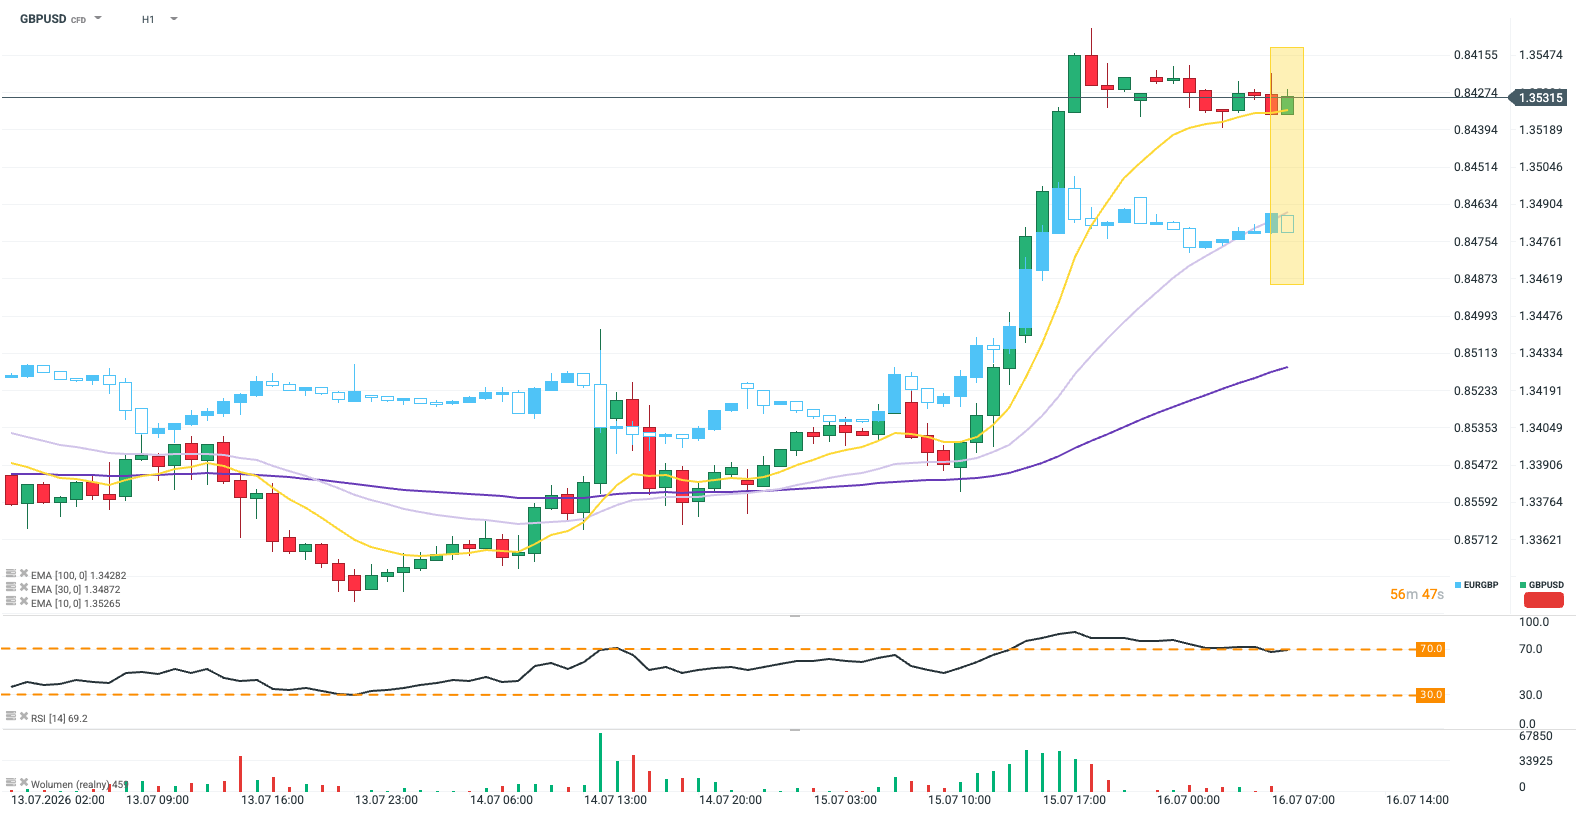
- GBP/USD rebounds to around 1.3325 in Friday’s Asian session.
- The US launched the 13th consecutive night of strikes against Iran.
- Traders await the UK June Retail Sales report on Friday for fresh impetus.
The GBP/USD pair recovers some lost ground to near 1.3325, snapping the five-day losing streak during the Asian trading hours on Friday. However, the potential upside might be limited amid heightened military tensions in the Middle East. Traders brace for the release of the UK Retail Sales data, which will be published later on Friday.
Renewed geopolitical tensions in the Middle East could underpin the US Dollar (USD) as a safe-haven currency. The US Central Command (CENTCOM) said it launched its 13th consecutive night against Iranian targets. US President Donald Trump said on Thursday that the US would hold Iran responsible for the Houthis’ actions and warned Iran and its Houthi allies would both soon receive a “major military punishment,” per the Guardian.
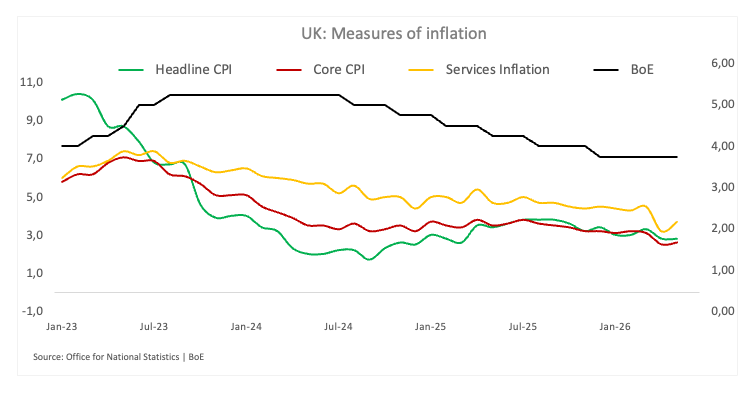
Traders expect the Bank of England (BoE) to keep its benchmark interest rate steady at 3.75% next week as it continues to assess the impact of the Middle East conflict. Financial markets were pricing in one or possibly two quarter-point interest rate hikes by the end of 2026, little changed from Tuesday, according to Reuters.
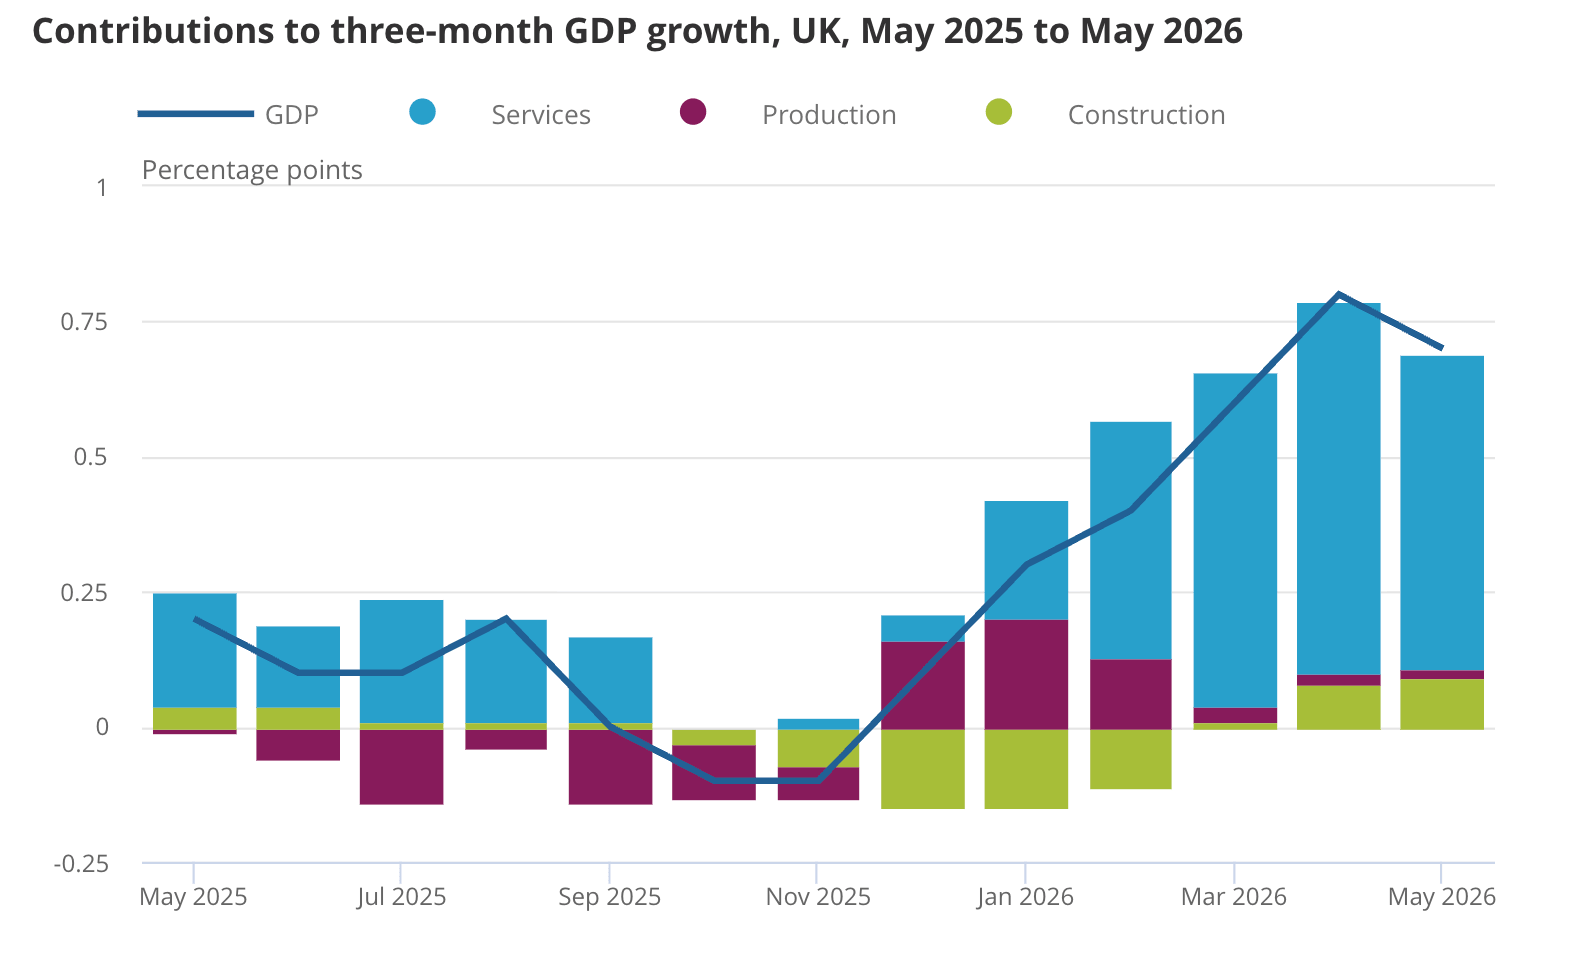
The UK Retail Sales data could offer more clues about the UK interest rate path. Retail Sales are expected to show a decline of 0.3% MoM in June, compared to a rise of 1.2% in May. In case of a surprise upside reading, this could reinforce the Bank of England (BoE) to maintain an aggressive tightening stance, supporting the Cable.
Pound steadies as markets look for BoE to hold Bank Rate at 3.75%
Analysts at Scotiabank note that policy expectations remain firmly anchored ahead of next week’s BoE decision, with “markets … expecting no policy change at the next MPC rate decision, where the Bank Rate is expected to be held at 3.75%.” This steady policy outlook, they suggest, continues to frame near-term trading conditions for the Pound against the US Dollar as investors look toward upcoming UK data for further direction.