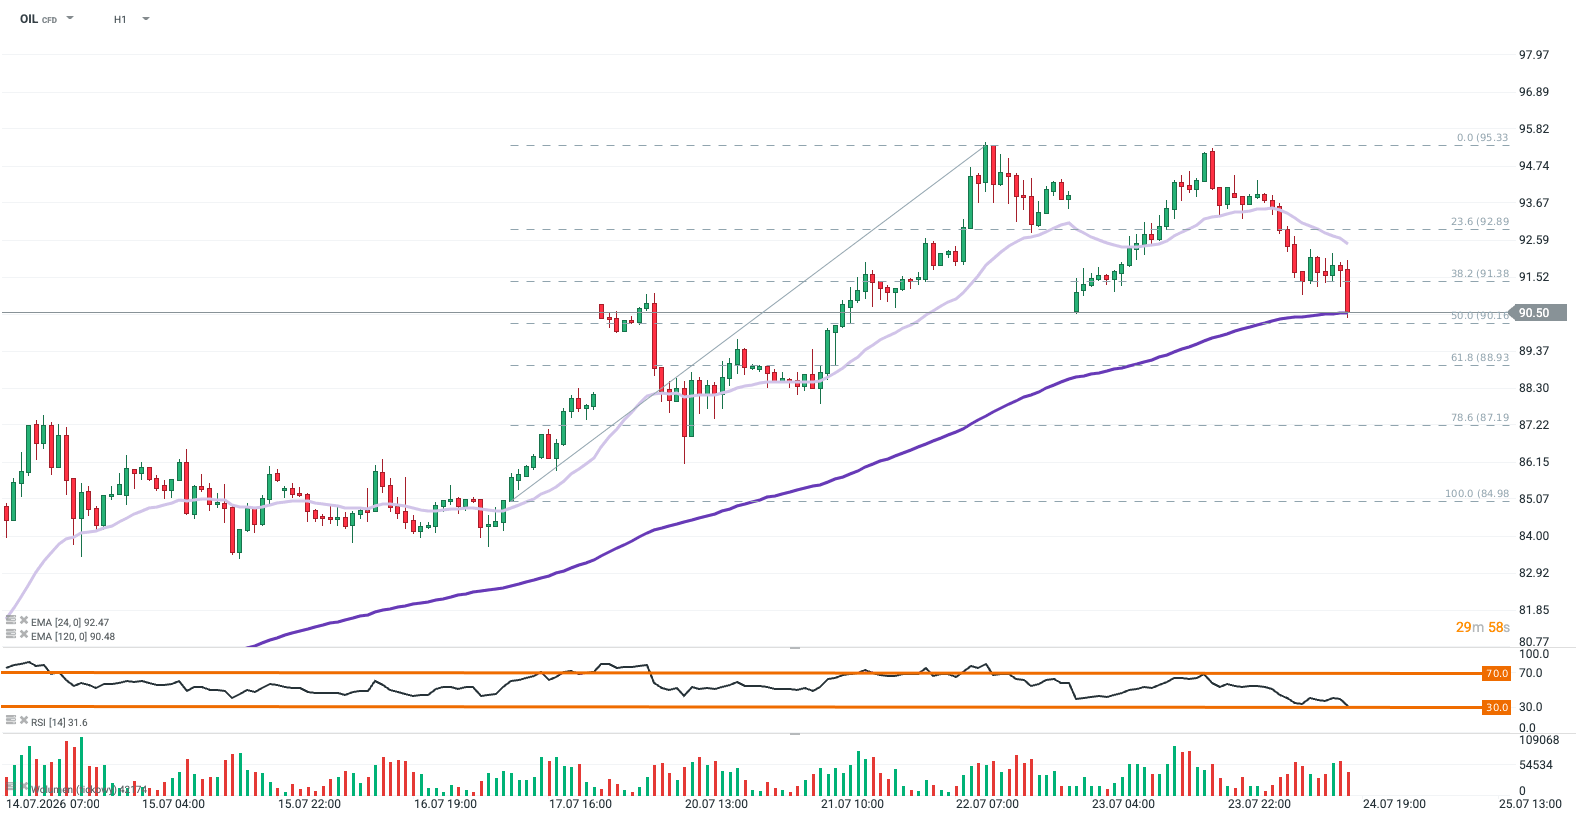
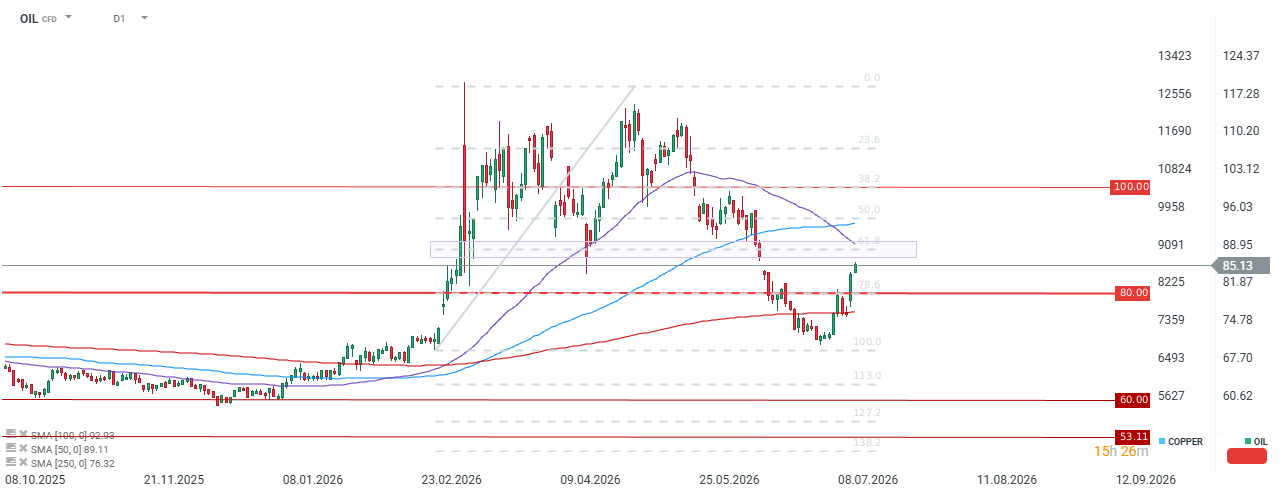
The pair bounced off the key resistance area near 0.7090 Short – term trend remains downward from the mid-May
Recommendation:
Trade: Short position on AUDUSD at market price Target: 0.6988, 0.6948 Stop: 0.7110
Opinion:
AUDUSD has been trading in a downward move recently. Looking at the H4 interval, one can see that the price bounced off the key 0.7090 resistance area. Red area near 0.7090 handle on the chart below is marked with previous price reactions, 100-period moving average from H1 interval, as well as upper limit of 1:1 structure. Taking this into account, continuation of the downward move looks to be the base case scenario for now. We recommend going short AUDUSD at market price with two targets: 0.6988 and 0.6948. We also recommend placing a stop loss order at 0.7110.
The price is near the lower boundary of a consolidation range between 0.886 and 0.861.
Upward corrections within the consolidation are breaking to increasingly lower levels, while at the same time testing resistance around 0.863.
The EMA100 has crossed the EMA200 from above.
Recommendation:
Short position (Sell) on EURGBP at the market price.
Target price (Take Profit; TP): 0.8400
Stop Loss (SL): 0.8817
EURGBP (D1)
Source: xStation5
OPINION :
The EURGBP rate is once again testing the lower boundary of the consolidation, which can also be treated as a developing 1:1 pattern, potentially ending with a downside breakout. The repeated defense of the ~0.86 level indicates the strength of this zone; however, increasingly weaker upward corrections within the consolidation reveal buyer weakness and point to the likely direction of further price movement.
Methodology and assumptions:
The recommendation is based on technical analysis of the chart, in particular EMA moving averages and Fibonacci levels.
The target level was determined based on Fibonacci levels.
The protective stop-loss order was set based on a favorable risk-to-reward ratio and with reference to a Fibonacci level.
NZD/USD may find initial support at the rectangle’s lower boundary near 0.5790.
The 14-day Relative Strength Index around 43 suggests waning upside momentum rather than outright oversold conditions.
The initial barrier lies at the nine-day EMA of 0.5853.
NZD/USD gains ground for the second successive day, trading around 0.5810 during the Asian hours on Tuesday. Technical analysis of the daily chart suggests the spot price is moving sideways within a rectangle pattern, reflecting a period of market consolidation and indecision.
The NZD/USD pair is maintaining a bearish near-term bias as spot holds beneath both the nine-day and 50-day Exponential Moving Averages (EMAs). The alignment of price below these short- and medium-term EMAs suggests rallies are likely to be sold, while a soft 14-day Relative Strength Index (RSI) reading around 43 hints at waning upside momentum rather than outright oversold conditions.
The NZD/USD pair may find initial support at the lower boundary of the rectangle around 0.5790, followed by the two-week low of 0.5782, recorded on June 8. A break below this confluence support zone would put downward pressure on the pair to navigate the region around a six-month low of 0.5681, which was recorded on April 6.
On the upside, the NZD/USD pair may rise toward the primary barrier at the nine-day EMA of 0.5853, followed by the 50-day EMA at 0.5875. A successful break above these moving averages could support the pair to approach the upper boundary of the rectangle around 0.5990, followed by the three-month high of 0.5995, which was reached on February 29.
(The technical analysis of this story was written with the help of an AI tool.)
New Zealand Dollar Price Today
The table below shows the percentage change of New Zealand Dollar (NZD) against listed major currencies today. New Zealand Dollar was the strongest against the Japanese Yen.
USD
EUR
GBP
JPY
CAD
AUD
NZD
CHF
USD
-0.02%
-0.07%
0.05%
-0.04%
0.00%
-0.18%
-0.04%
EUR
0.02%
-0.02%
0.09%
-0.01%
0.07%
-0.12%
0.01%
GBP
0.07%
0.02%
0.13%
0.06%
0.06%
-0.11%
0.04%
JPY
-0.05%
-0.09%
-0.13%
-0.08%
-0.03%
-0.21%
-0.08%
CAD
0.04%
0.01%
-0.06%
0.08%
0.04%
-0.12%
0.00%
AUD
-0.00%
-0.07%
-0.06%
0.03%
-0.04%
-0.16%
-0.04%
NZD
0.18%
0.12%
0.11%
0.21%
0.12%
0.16%
0.12%
CHF
0.04%
-0.01%
-0.04%
0.08%
-0.00%
0.04%
-0.12%
The heat map shows percentage changes of major currencies against each other. The base currency is picked from the left column, while the quote currency is picked from the top row. For example, if you pick the New Zealand Dollar from the left column and move along the horizontal line to the US Dollar, the percentage change displayed in the box will represent NZD (base)/USD (quote).
EUR/JPY gathers strength near 184.85 in Tuesdayโs early European session.
The cross keeps the bullish vibe, but further consolidation cannot be ruled out in near term with neutral RSI momentum.
The initial support level is seen at 184.50; the immediate resistance level to watch is 185.12.
The EUR/JPY cross holds positive ground around 184.85 during the early European session on Tuesday. A hawkish stance from the European Central Bank (ECB) underpins the Euro (EUR) against the Japanese Yen (JPY). The ECB will hold its June monetary policy meeting on Thursday. Markets have fully priced in a 25-basis-point (bps) rate hike after Eurozone inflation surged to 3.2%.
Markets are on high alert for foreign exchange intervention from Japanese authorities. This, in turn, might support the JPY and act as a headwind for the cross. Japanese authorities have issued strong verbal warnings, stating that the government is fully prepared to take decisive and appropriate action to protect the domestic currency.
Technical Analysis:
In the daily chart, EUR/JPY holds a constructive bullish bias as spot remains above the 100-day simple moving average (SMA) and the Bollinger band midline. Price also sits comfortably above the lower Bollinger band, suggesting the broader uptrend structure is still intact, while the Relative Strength Index (RSI) at 45.9 leans slightly soft but remains in neutral territory, hinting at consolidative rather than impulsive downside momentum.
On the downside, the initial support zone is formed by the 100-day SMA at 184.50, followed by the lower Bollinger band near 184.20, which should limit deeper pullbacks if the bullish structure is to persist. The first upside barrier emerges at the the Bollinger band midline at 185.12, en route to the upper boundary of the Bollinger Band at 185.12. Any follow-through buying above this level could pave the way to the 186.00 psychological level.
On Thursday (June 11), the ECB will announce its interest rate decision. Markets have almost fully priced in a rate hike.
Nearly two additional rate hikes are priced in for the remaining months of the year (the second one at approx. 73%).
On Wednesday (June 10), May CPI inflation data for the United States will be released.
The EURUSD pair is oscillating around 1.15500, between two key support levels determined by the 61.8% and 78.6% Fibonacci retracements.
The price is trading significantly below its three major moving averages: EMA 50 (1.16568), EMA 100 (1.16608), and EMA 150 (1.16464).
The RSI (14) indicator stands at 39.1.
Recommendation
Position: Short (SELL) on EURUSD at market price (1.15502).
Take Profit (TP): 1.14700 (TP1), 1.14200 (TP2)
Stop Loss (SL): 1.16300
Figure 1: EURUSD (10.12.2025 – 25.06.2026)
Source: xStation5, 08.06.2026 (15:34)
Opinion
The EURUSD pair has weakened significantly from its mid-April peak, when it approached the 1.18500 level. The key drivers behind this downward move are the prolonged negotiations between the US and Iran, alongside a substantial increase in market expectations for US interest rate hikes. Markets have now fully priced in a rate increase before the end of the year, following Friday’s release of very strong NFP (Non-Farm Payrolls) data from the US labor market. Figure 2: Change in Non-Farm Payrolls (NFP) and Unemployment Rate in the US (2023 – 2026)
Source: XTB Research, 08.06.2026
Geopolitics and monetary policy should remain the primary focus for investors this week as well. Any headlines suggesting that a breakthrough in reopening the Strait of Hormuz is slipping away could weigh on the EURUSD pair, a dynamic already observed during this morning’s trading session. Paradoxically, the Euro’s decline could also be fueled by Thursday’s anticipated interest rate hike from the ECB. Since this move is already nearly 100% priced in by the markets, investor attention will shift away from the decision itself and onto the accompanying rhetoric. Frankly speaking, if the ECB were to hold rates for any reason, it would trigger a massive sell-off in the Euro. However, the single currency could also be weakened by President Christine Lagarde herself, who will take the podium on Thursday afternoon to address and potentially challenge market assumptions regarding the central bank’s upcoming steps.
Lagarde has rarely accustomed us to being overly transparent or hawkish in her communications. Consequently, any signs of her emphasizing economic stagnation risks could be interpreted by markets as dovish โ especially if inflation concerns are given a slightly lower priority than they were a month ago. Speaking of inflation, Wednesdayโs US CPI print for May is a crucial milestone. Further growth in price pressures is expected. The core gauge, which excludes highly volatile food and energy prices, will be critical, as it will reveal the extent to which the energy shock has filtered into other sectors of the economy. From a technical analysis perspective: The pair has broken below the 61.8% Fibonacci retracement level (1.15777) as well as the EMA 50, 100, and 150 moving averages, justifying further declines. The MACD histogram is systematically deepening its lows in negative territory, and the RSI (14) still has ample room to slide before hitting oversold territory.
Methodology
The recommendation was prepared based on a fundamental analysis of the respective economies (including monetary policy in both the Eurozone and the US), as well as a technical analysis of the EURUSD chart. The direction of the recommendation was determined by assessing the monetary policy divergence between the Fed and the ECB, confirmed by the medium-term downward trend on the chart. Take Profit and Stop Loss levels were determined using Fibonacci retracements and key horizontal support/resistance levels (TP1 between Fibo 78.6% and Fibo 100.0%, TP2 directly at the Fibo 100.0% level, and the SL at the Fibo 50.0% level).
USD/JPY edges higher as Japanโs disappointing consumer spending data weighs on the JPY.
Rising US-Iran tensions underpin the safe-haven USD and also lend support to spot prices.
The divergent BoJ-Fed expectations might cap the pair as traders await the US CPI report.
The USD/JPY pair attracts some buyers for the second straight day and advances to a four-day high following the disappointing release of Japan’s Household Spending data this Tuesday. Spot prices, however, lack bullish conviction amid mixed fundamental cues and currently trade just below the mid-157.00s area, up 0.15% for the day.
Japan’s internal affairs ministry reported earlier today that consumer spending fell 2.9% YoY in March, compared to a 1.8% drop in the prior month and missing market estimates. This also marks the fourth consecutive month of decline in personal spending amid persistent inflationary pressure and comes on top of economic concerns stemming from rising US-Iran tensions, which, in turn, undermines the Japanese Yen (JPY). Apart from this, a modest US Dollar (USD) uptick acts as a tailwind for the USD/JPY pair.
The recent optimism over a potential US-Iran peace deal faded rather quickly amid major disagreements over Tehran’s nuclear program and a standoff over the critical Strait of Hormuz. Furthermore, US President Donald Trump said that the ongoing US-Iran ceasefire was “unbelievably weak” and was on “massive life support.” This keeps geopolitical risks in play and underpins the USD’s reserve currency status. The USD bulls, however, opt to wait for the release of the US consumer inflation figures later today.
The crucial data will play a key role in influencing market expectations about the US Federal Reserve’s (Fed) policy outlook and provide some meaningful impetus to the USD. In the meantime, traders have been scaling back their bets for a Fed rate hike in 2026, which marks a significant divergence in comparison to the BoJ’s relatively hawkish outlook. In fact, BoJ’s Summary of Opinions from the April meeting left the door open for an imminent rate hike. This might further contribute to capping the USD/JPY pair.
AUD/USD may test the 0.7277, the highest since June 2022.
The 14-day Relative Strength Index of 60 indicates resilient bullish momentum without reaching overbought territory.
Initial support lies at the nine-day EMA at 0.7214.
AUD/USD loses ground after two days of gains, trading around 0.7240 during the Asian hours on Monday. The technical analysis of the daily chart indicates that the pair is moving upwards within the ascending channel, suggesting an ongoing bullish bias.
The AUD/USD pair holds a constructive bullish bias as it stays above both the nine-period and 50-period Exponential Moving Averages (EMAs). This positioning suggests the broader uptrend remains supported.
The 14-day Relative Strength Index (RSI) is around 60 points to firm but not overextended upside momentum, keeping buyers in near-term control as long as the price defends these moving average floors.
The AUD/USD pair may test the 0.7277, the highest since June 2022, recorded on May 6. A successful break above this level would support the pair to target the upper boundary of the ascending channel around 0.7460.
On the downside, the AUD/USD pair may test the nine-day EMA at 0.7214, followed by the lower boundary of the ascending channel around 0.7200. Further declines would expose the 50-day EMA at 0.7096. A break below the medium-term average would cause the bearish emergence and put downward pressure on the AUD/USD pair to navigate the region around the three-month low of 0.6833, which was recorded on March 30.
AUD/USD: Daily Chart
Australian Dollar Price Today
The table below shows the percentage change of Australian Dollar (AUD) against listed major currencies today. Australian Dollar was the weakest against the US Dollar.
USD
EUR
GBP
JPY
CAD
AUD
NZD
CHF
USD
0.16%
0.14%
0.17%
0.09%
0.20%
0.14%
0.16%
EUR
-0.16%
-0.03%
0.02%
-0.10%
0.05%
-0.04%
0.01%
GBP
-0.14%
0.03%
0.02%
-0.09%
0.05%
-0.02%
0.02%
JPY
-0.17%
-0.02%
-0.02%
-0.11%
0.00%
-0.05%
-0.03%
CAD
-0.09%
0.10%
0.09%
0.11%
0.12%
0.06%
0.08%
AUD
-0.20%
-0.05%
-0.05%
-0.00%
-0.12%
-0.06%
-0.04%
NZD
-0.14%
0.04%
0.02%
0.05%
-0.06%
0.06%
0.02%
CHF
-0.16%
-0.01%
-0.02%
0.03%
-0.08%
0.04%
-0.02%
The heat map shows percentage changes of major currencies against each other. The base currency is picked from the left column, while the quote currency is picked from the top row. For example, if you pick the Australian Dollar from the left column and move along the horizontal line to the US Dollar, the percentage change displayed in the box will represent AUD (base)/USD (quote).
The political crisis surrounding Keir Starmer has become one of the key market drivers for the pound today. The situation is evolving rapidly and is having a direct impact on government bond yields and the value of the pound, with the markets closely monitoring the Prime Ministerโs every word. Internal party pressure The scale of Starmerโs problem is best illustrated by a single figure: 42 Labour MPs had already officially called on him to resign by Sunday evening, whilst former Deputy Prime Minister Angela Rayner described the current situation as โLabourโs last chanceโ to change course.
The emergence of potential challengers, such as Wes Streeting and Andy Burnham, means that the market now views the internal dispute within the Labour Party as a real risk, rather than mere political noise. In his speech on Monday, Starmer focused on several key themes. Firstly, a firm defence of his own position: โI will fight in every internal vote.โ Secondly, a political agenda aimed at closer ties with the EU, the nationalisation of British Steel and a new mobility agreement for young people with Europe. The market viewed this speech primarily through the prism of one question: will the Prime Minister stabilise his position sufficiently to halt the sell-off of gilts?
You can watch the UK Prime Ministerโs live address here. Source: Sky News, YouTube
Starmer, gilts in pounds
The yield on 10-year gilts rose on Monday morning to 4.954%, an increase of 3 basis points from the previous close, when it stood at 4.904% immediately after Starmer refused to resign on Friday. Economists surveyed by Bloomberg say that were it not for the political component, yields would be 10โ15 basis points lower. This shows just how much the market has already begun to price in the risk of political instability, rather than solely macroeconomic fundamentals. The UK currently has the highest debt servicing costs of all G7 countries, a consequence of inflation remaining above target and weak economic growth. The situation is further complicated by the economic fallout from the armed conflict in Iran, which has led to higher energy prices and a further weakening of business activity. In such an environment, any political uncertainty acts as a risk multiplier for funds holding gilts.
Implications for the GBP
The pound finds itself in a difficult position, both technically and fundamentally. On the one hand, structural factors such as the Bank of Englandโs relatively high interest rates compared to the ECB and the marked inflationary divergence from the rest of Europe may continue to support it in the medium term. On the other hand, the political risk premium, which has just begun to be priced into gilt yields, is a factor that directly affects the currencyโs valuation: higher bond yields against a backdrop of a weakening government is a scenario that has historically been negative for the pound, as it suggests a lack of a fiscal anchor. If Starmer survives the coming weeks politically and manages to quell the internal rebellion, the risk premium should gradually decline, and the GBP/USD pair could test higher resistance levels once again. An alternative scenario, namely a genuine battle for party leadership, would, however, mean further rises in gilt yields and pressure on the pound, particularly as global markets are now highly sensitive to any signs of political fiscal instability following the experiences of the Truss era. For sterling traders, therefore, today is a test not so much of Starmer himself as of the resilience of the political risk premium that the market has already priced in.
GBP/USD is trading at 1.3608 on the daily chart, within an uptrend that has been in place since the low around 1.22 at the turn of 2024/2025, and the price remains above the anchored VWAP from early 2025, which runs in the 1.31โ1.32 region. The volume profile indicates a Point of Control in the 1.3450โ1.3480 zone, where a black horizontal line marks a key support level that has been tested repeatedly on both sides. The RSI(14) at 57.17 suggests neutral-bullish momentum with no signs of overbought conditions, which technically leaves room for further gains towards the 1.3800โ1.3850 resistance zone, where the price reversed at the 2025 peak.
Todayโs speech by Starmer and his political survival are factors that will directly determine the short-term direction: government stability paves the way upwards, whilst an escalation of the crisis and a rise in gilt yields would push the pair back towards the POC zone at 1.3450, and, in the event of a deeper sell-off, even towards the VWAP. Technically, the bulls have the upper hand as long as the price remains above 1.34, and the bears will only regain the initiative after a break below this zone with volume. Source: xStation
To provide the best experiences, we use technologies like cookies to store and/or access device information. Consenting to these technologies will allow us to process data such as browsing behavior or unique IDs on this site. Not consenting or withdrawing consent, may adversely affect certain features and functions.
Functional
Always active
The technical storage or access is strictly necessary for the legitimate purpose of enabling the use of a specific service explicitly requested by the subscriber or user, or for the sole purpose of carrying out the transmission of a communication over an electronic communications network.
Preferences
The technical storage or access is necessary for the legitimate purpose of storing preferences that are not requested by the subscriber or user.
Statistics
The technical storage or access that is used exclusively for statistical purposes.The technical storage or access that is used exclusively for anonymous statistical purposes. Without a subpoena, voluntary compliance on the part of your Internet Service Provider, or additional records from a third party, information stored or retrieved for this purpose alone cannot usually be used to identify you.
Marketing
The technical storage or access is required to create user profiles to send advertising, or to track the user on a website or across several websites for similar marketing purposes.