EUR/USD – Remains below nine-day EMA near 1.1550

April 3, 2026
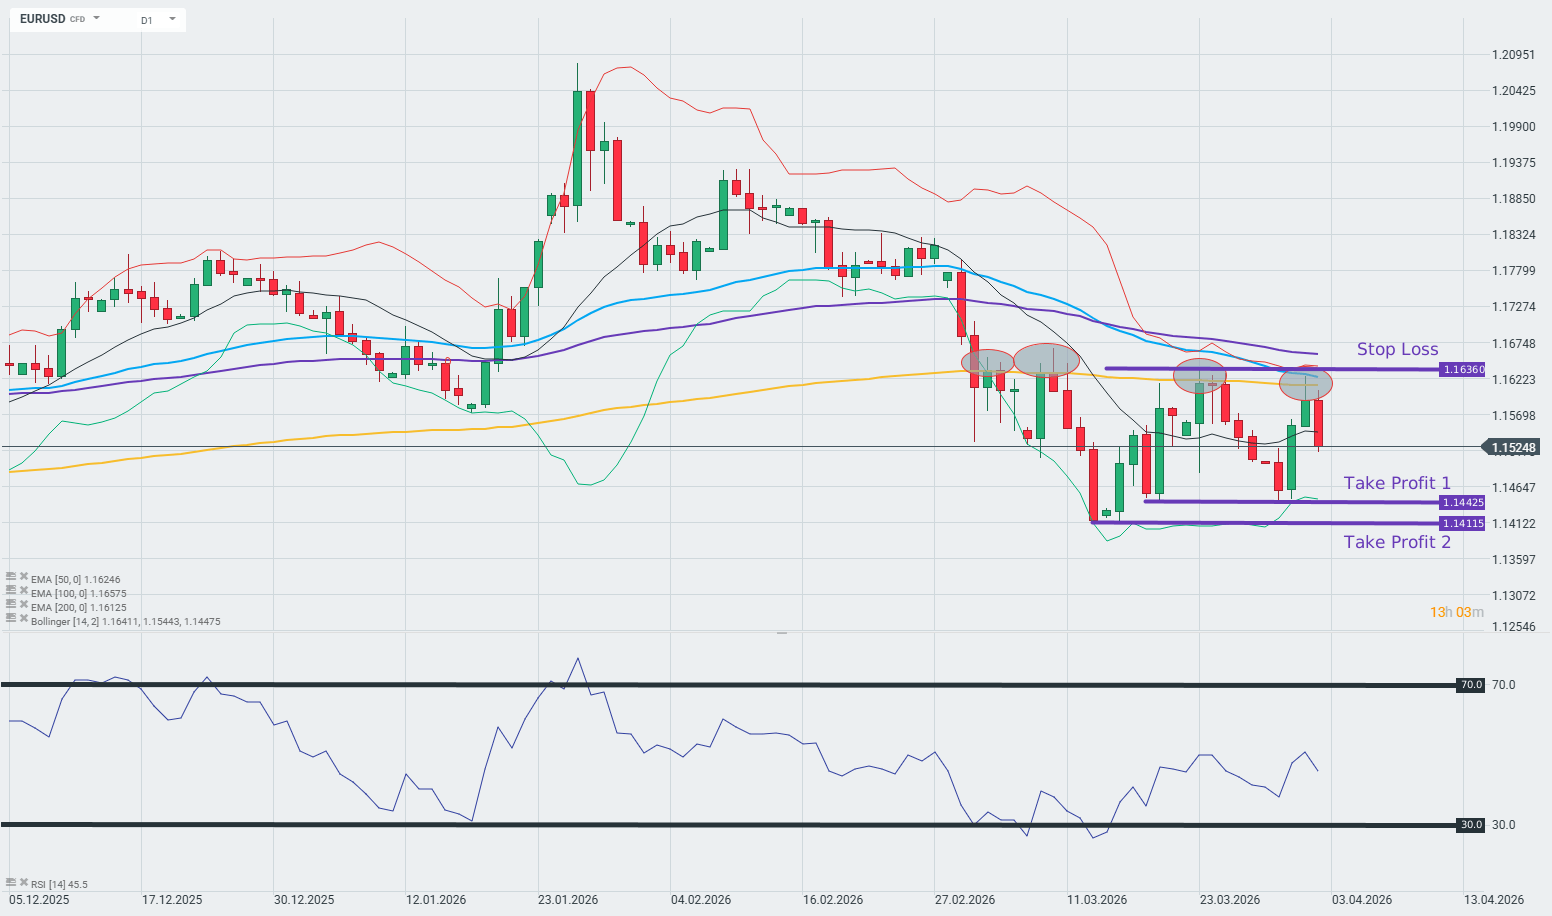
  • EUR/USD may fall toward the initial support at the eight-month low of 1.1411.
  • The 14-day Relative Strength Index near 45 signals subdued momentum.
  • The pair tests the immediate barrier at the upper descending channel boundary near the nine-day EMA at 1.1544.

EUR/USD remains subdued for the second successive day, trading around 1.1540 during Asian hours on Friday. The daily chart technical analysis indicates a potential bullish reversal as the pair is testing the upper boundary of the descending channel pattern.

However, the near-term bias stays mildly bearish as price holds below both the nine-day and 50-day Exponential Moving Averages (EMAs), which cap recovery attempts and confirm a prevailing downside tone. The short-term average trades under the longer one and flattens, signalling a lack of bullish follow-through after recent rebounds.

The 14-day Relative Strength Index (RSI) momentum indicator around 45 keeps momentum on the soft side, showing sellers retain a slight advantage without reaching oversold extremes.

The EUR/USD pair may navigate the region around the initial support at the eight-month low of 1.1411, recorded on March 13. Further declines would put downward pressure on the pair to test the descending channel around 1.1250.

On the upside, the EUR/USD pair is testing the immediate resistance at the upper descending channel boundary around the nine-day EMA at 1.1544. A break above the channel would strengthen the market bias and support the pair to test the 50-day EMA at 1.1637. Further advances would open the doors for the pair to explore the region around 1.2082, the highest since June 2021, which was recorded on January 27.

EUR/USD: Daily Chart

(The technical analysis of this story was written with the help of an AI tool.)

Euro Price Today

The table below shows the percentage change of Euro (EUR) against listed major currencies today. Euro was the weakest against the Japanese Yen.

USDEURGBPJPYCADAUDNZDCHF
USD0.04%-0.06%-0.05%0.03%-0.07%0.15%-0.02%
EUR-0.04%-0.05%-0.07%-0.01%0.02%0.10%-0.05%
GBP0.06%0.05%0.00%0.06%0.10%0.17%0.00%
JPY0.05%0.07%0.00%0.06%0.08%0.17%-0.00%
CAD-0.03%0.00%-0.06%-0.06%0.03%0.12%-0.04%
AUD0.07%-0.02%-0.10%-0.08%-0.03%0.08%-0.08%
NZD-0.15%-0.10%-0.17%-0.17%-0.12%-0.08%-0.17%
CHF0.02%0.05%-0.00%0.00%0.04%0.08%0.17%

The heat map shows percentage changes of major currencies against each other. The base currency is picked from the left column, while the quote currency is picked from the top row. For example, if you pick the Euro from the left column and move along the horizontal line to the US Dollar, the percentage change displayed in the box will represent EUR (base)/USD (quote).

Offshore Yuan Set for Weekly Gains

April 3, 2026

The offshore yuan edged higher to around 6.88 per dollar on Friday, trimming gains from the previous session as market sentiment improved on growing hopes for the reopening of the Strait of Hormuz. Iran and Oman are said to be developing a protocol to “monitor transit” through the strategic waterway, a move aimed at easing regional tensions.

Elsewhere, countries such as India and the Philippines are actively negotiating with Tehran to ensure the safe passage of vessels, while also forming small diplomatic circles and exploring barter-style agreements. Meanwhile, China and Pakistan are advocating for their own multi-point diplomatic plan, as Iran maintains tight control over the shipping lane. Domestically, RatingDog data showed China’s composite PMI fell to 51.5 in March from 55.4 in February 2026, as both manufacturing (50.8 vs 52.1) and services (52.1 vs 56.7) sectors slowed. Over the week, the yuan is poised for a weekly gain, breaking a four-week losing streak.

Trade of The Day – EUR/USD

April 2, 2026

Facts:

  • The EUR/USD exchange rate failed to close above the 200-day EMA on yesterday’s daily candle
  • The price remains below the 50-, 100-, and 200-day exponential moving averages (EMA)

Recommendation: 

Trade: Short position on the EUR/USD pair at market price

Take Profit 1: 1.14425

Take Profit 2: 1.14115

Stop: 1.16360
 

Opinion:

From a technical perspective, the EURUSD pair remains in a structural downtrend, which is a key argument for maintaining short positions.  The price consistently remains below the 200-, 100-, and 50-day exponential moving averages (EMA), which form dynamic resistance and confirm the dominance of supply over demand in the medium term. Prices are moving within a bearish flag pattern (a trend continuation pattern), and current attempts at a rebound are being stifled by successive resistance levels marked by the downward-sloping EMAs, which technically indicates further potential for the euro-dollar exchange rate to depreciate.

An additional and significant catalyst for the dollar’s strengthening is the escalation of the armed conflict in the Middle East, directly driven by the Trump administration’s actions.  In his Wednesday address to the nation, the president announced that within the next 2–3 weeks, the United States would strike Iran “extremely hard,” promising simultaneous attacks on all Iranian power plants, which—as Trump stated—“will set the country back to the Stone Age.” The escalation of the military operation codenamed “Operation Epic Fury” is generating a classic flight-to-safety effect—primarily toward the dollar—which, combined with the euro-dollar’s technical weakness, creates a consistent environment conducive to the continuation of the downward trend in the EURUSD pair

Methodology and assumptions:
This recommendation is based on a technical analysis of the EURUSD chart. Classical technical analysis was used to assess the situation and analyze the trend. The target level—take profit 1—was set at the level of previous price reactions, using price action methodology. Take profit 2, on the other hand, is based on the location of last month’s local low. The protective stop-loss order was set above the most recent local high using price action methodology.

Currency Talk – USDJPY, NZDUSD, USDCHF

April 2, 2026

The Overbalance analysis aims to identify three financial instruments, analyzed primarily on the daily/four-hour (D1/H4) timeframe. The analysis uses only the Overbalance methodology, which helps determine where a trend may continue or where it may reverse. Today’s analysis covers three instruments, evaluated solely in terms of 1:1 correction structures.

USDJPY
Since February 12, the USDJPY has been trading in a strong uptrend. Initially, the movement was controlled by a 1:1 corrective pattern with a range of approximately 140 pips; however, in mid-March, a deeper correction occurred, after which the market established a new high. As a result, the current largest corrective pattern has a range of approximately 240 pips. At this point, the key support level is 158.10, derived from the lower boundary of this pattern. As long as this level holds, the uptrend remains in place. A break below it, however, could open the way for a larger correction or even a trend reversal.

USDJPY – H4 chart. Source: xStation

NZDUSD
The NZDUSD pair has been trending downward since late January. We are currently seeing an upward corrective move. If the correction continues, the key resistance level remains at 0.5845, where the upper boundary of the 1:1 correction pattern is located. According to the Overbalance methodology, the downtrend remains in effect until this level is negated.

NZDUSD – H4 chart. Source: xStation

USDCHF
Since early January, USDCHF has been in a downtrend. However, an upward correction has been developing since late January, and its range has already exceeded smaller geometric patterns, including the 0.7902 level. Nevertheless, the price has failed to break through the key resistance at 0.8042, where the upper boundary of the largest corrective pattern is located. According to the Overbalance methodology, the downtrend remains in effect until this level is broken. The decline could accelerate after falling below the 0.7902 level, which is the lower boundary of the smaller geometric pattern. Conversely, a break above 0.8042 could lead to a shift to an uptrend.

USDCHF – H4 timeframe. Source: xStation

The material on this page does not constitute financial advice and does not take into account your level of understanding, investment objectives, financial situation or any other specific needs. All information provided, including opinions, market research, mathematical results and technical analyzes published on the Website or transmitted To you by other means, it is provided for information purposes only and should in no way be construed as an offer or solicitation for a transaction in any financial instrument, nor should the information provided be construed as advice of a legal or financial nature on which any investment decisions you make should be based exclusively To your level of understanding, investment objectives, financial situation, or other specific needs, any decision to act on the information published on the Website or sent to you by other means is entirely at your own risk if you In doubt or unsure about your understanding of a particular product, instrument, service or transaction, you should seek professional or legal advice before trading. Investing in CFDs carries a high level of risk, as they are leveraged products and have small movements Often the market can result in much larger movements in the value of your investment, and this can work against you or in your favor. Please ensure you fully understand the risks involved, taking into account investments objectives and level of experience, before trading and, if necessary, seek independent advice.

Chart of The Day – Oil Rebounds Sharply

April 2, 2026

Brent crude is surging back above $100 per barrel (OIL: +7.6%), erasing nearly all losses from the last three sessions. Donald Trump’s address failed to outline any concrete “exit strategies” for the conflict, and his hawkish tone undermined market optimism that had previously bet on a rebound following Iran’s declarations of being ready for peace talks.

The OIL contract is dynamically returning above the 10-day Exponential Moving Average (EMA10, yellow), confirming a strong upward trend. However, the price is approaching a repeatedly tested resistance level at $110, and a nearly overbought RSI (near 70) may limit gains above this threshold. Source: xStation5

What is driving the rise in OIL today?

  • In his address, Donald Trump announced that the strategic goals of “Operation Epic Fury” are near completion and that the war in Iran will last approximately another two to three weeks. He vowed the final destruction of Iran’s nuclear and missile programs, threatening strikes on energy infrastructure. While the address largely repeated many of Trump’s known stances, his comments regarding the Strait of Hormuz and the overall bellicose tone eroded the optimism seen in recent sessions.
  • The US President downplayed the importance of the Strait of Hormuz to the United States, claiming the country is energy independent. He called on Asian and European nations to protect the route themselves, suggesting they purchase American oil instead. Experts are challenging his optimism regarding a rapid drop in fuel prices, pointing to permanent infrastructure damage and record energy costs in the US (exceeding $4 per gallon).
  • Iranian military officials responded to Trump’s address by vowing to continue the war until the “humiliation and surrender” of the US and Israel. Tehran dismissed claims that its military has been weakened, threatening “even more powerful and destructive strikes.” The Iranian command emphasized that Washington underestimates their strategic capabilities, and Trump’s vows to “bring them back to the stone age” only escalate the conflict, ruling out a quick truce.

The material on this page does not constitute financial advice and does not take into account your level of understanding, investment objectives, financial situation or any other specific needs. All information provided, including opinions, market research, mathematical results and technical analyzes published on the Website or transmitted To you by other means, it is provided for information purposes only and should in no way be construed as an offer or solicitation for a transaction in any financial instrument, nor should the information provided be construed as advice of a legal or financial nature on which any investment decisions you make should be based exclusively To your level of understanding, investment objectives, financial situation, or other specific needs, any decision to act on the information published on the Website or sent to you by other means is entirely at your own risk if you In doubt or unsure about your understanding of a particular product, instrument, service or transaction, you should seek professional or legal advice before trading. Investing in CFDs carries a high level of risk, as they are leveraged products and have small movements Often the market can result in much larger movements in the value of your investment, and this can work against you or in your favor. Please ensure you fully understand the risks involved, taking into account investments objectives and level of experience, before trading and, if necessary, seek independent advice.

EUR/GBP Analysis – Euro stands tall above 0.8700 in risk-off markets

April 2, 2026
  • EUR/GBP maintains its near-term bullish trend intact, with 0.8700 support capping bears.
  • Upbeat Eurozone manufacturing data provided some support to the Euro on Wednesday.
  • The pair is likely to meet significant resistance at the 0.8740-0.8750 area.

EUR/GBP’s reversal from one-month highs at 0.8740 found buyers right above 0.08700 on Wednesday, and the pair has trimmed losses on Thursday, returning to the 0.8720 area at the time of writing.

The Euro (EUR) seems to be faring better than the British Pound (GBP) amid the risk-averse market mood, and keeps the bullish bias from mid-March lows intact. The positive Eurozone manufacturing data provided some support for the common currency on Wednesday, while UK factory activity failed to convince investors.

Technical Analysis: Resistance at the 0.8740-08750 area

Chart Analysis EUR/GBP


The 4-hour chart shows EUR/GBP trading at 0.8724 amid a mildly bullish near-term bias. The Relative Strength Index stays above 60, indicating sustained upside momentum, although the bearish cross of the Moving Average Convergence Divergence (MACD) line suggests that upside pressure might be fading.

The pair is likely to require some extra impulse to extend its rally beyond the resistance area between 0.8740, where bulls were capped on March 3, 31, and April 1, and the 78.2% Fibonacci retracement of the early March reversal, at 0.8752. A confirmation above these levels would bring the year-to-date high, at the 0.8790 area, back to the focus.

To the downside, bears would need to breach Wednesday’s low, at 0.8704, and the March 31 low, at 0.8676, to negate the bullish view.

Euro Price Today

The table below shows the percentage change of Euro (EUR) against listed major currencies today. Euro was the strongest against the British Pound.

USDEURGBPJPYCADAUDNZDCHF
USD0.51%0.71%0.49%0.25%0.64%0.63%0.63%
EUR-0.51%0.21%-0.04%-0.28%0.15%0.14%0.09%
GBP-0.71%-0.21%-0.23%-0.48%-0.05%-0.05%-0.12%
JPY-0.49%0.04%0.23%-0.24%0.15%0.14%0.10%
CAD-0.25%0.28%0.48%0.24%0.39%0.38%0.34%
AUD-0.64%-0.15%0.05%-0.15%-0.39%-0.01%-0.08%
NZD-0.63%-0.14%0.05%-0.14%-0.38%0.01%-0.05%
CHF-0.63%-0.09%0.12%-0.10%-0.34%0.08%0.05%

The heat map shows percentage changes of major currencies against each other. The base currency is picked from the left column, while the quote currency is picked from the top row. For example, if you pick the Euro from the left column and move along the horizontal line to the US Dollar, the percentage change displayed in the box will represent EUR (base)/USD (quote).

41, with a break higher exposing 0.8800 and then 0.8863. On the downside, initial support comes in at 0.8705, followed by the 61.8% retracement at 0.8721 turning into a pivot area if broken, while the 38.2% retracement at 0.8680 aligns with prior price congestion as the next key floor. A deeper pullback would bring 0.8677 into view, where a failure to hold would signal that the current bullish phase is losing traction.

Sterling Slides as Trump’s Address Deepens Middle East Uncertainty

April 2, 2026

The British pound slipped toward $1.32, nearing its lowest point since late November, as investor caution resurfaced after President Donald Trump’s prime-time address provided no clear end in sight for the Middle East conflict. Trump affirmed that the US operation was nearly complete but vowed escalated actions, including possible strikes on electrical plants, over the next two to three weeks. The lack of new justifications for the war further weighed on market sentiment.

Ongoing uncertainty and inflationary pressures have prompted a reassessment of Bank of England policy expectations. Investors now anticipate two interest rate hikes in 2026, reversing four days of reduced bets that had left expectations below two hikes by yesterday’s close. Even so, this remains below last week’s peak, when markets briefly priced in as many as four increases. The shift comes despite Bank of England Governor Andrew Bailey’s recent warning that markets were overestimating the likelihood of hikes.

Euro Dips as Trump’s Address Fuels Middle East Uncertainty

April 2, 2026

The euro retreated toward $1.15 as investor caution returned following President Donald Trump’s prime-time address, which offered no clear timeline for resolving the Middle East conflict. While Trump stated that the US operation was nearing completion, he also vowed more aggressive measures, including possible strikes on electrical plants, over the next two to three weeks.

The absence of new justifications for the war further dampened market confidence. Amid persistent uncertainty and growing inflation fears, markets are revisiting expectations for the European Central Bank’s policy direction. Investors now foresee three interest rate hikes in 2026, an increase from the two anticipated just yesterday. Before the conflict, expectations had leaned toward no hikes at all, with some even speculating about potential monetary easing.