The Week Ahead: Geopolitical risks push the oil price higher It’s a shaky start to the week for financial markets. The oil price has risen by nearly 4% and Brent crude is trading above $79 per barrel. This comes after more attacks between the US and Iran in the Gulf, and statements from the Iranian regime that it has closed the Strait of Hormuz. The US is disputing this claim, but commercial traffic has slowed through the Strait once more, which is adding to the negative sentiment seen in financial markets today.
Will the oil price move higher?
This week will be a test to see if the continued skirmishes between the US and Iran can be absorbed by financial markets without causing major damage. The oil price remains below $80 per barrel for now, and the prevailing view is that the current situation will not evolve into another full-scale war, even if President Trump believes that the ceasefire is over. Thus, for now, oil price gains remain contained, and the price of Brent crude has not risen above $80 per barrel.
South Korean Kospi stays volatile
Stocks were sharply lower in Asia overnight, and the Nikkei fell about 2%. The South Korean Kospi plunged 9%, proving that it is one of the most volatile indices out there. This comes after SK Hynix, which listed on the Nasdaq last Friday, fell 15% overnight, eroding the gains made at the end of last week and experiencing its worst day ever. The South Korean listed stock price is down 19% in the past month, however, the sell off should prove to be temporary. There is huge structural demand for chips and memory, and this could be reinforced this earrings season, with high expectations for capex spending from the major hyperscalers to remain elevated into next year. Thus, any sell-off could be seen as a buying opportunity.
Momentum trade gets reality check
US futures are pointing to a lower open later today, led by the Nasdaq, which is forecast to decline more than 1%. The Dow Jones is expected to see the mildest sell off, with futures only predicting a 0.3% decline at this time. This suggests that the rise in geopolitical tensions and the spike in the oil price are disrupting the momentum trade once again, which will hit the tech trade and the chip stock rally. The reaction in the Kospi, which is dominated by chip stocks, could be replicated in a less volatile fashion elsewhere.
Why are chip stocks selling off?
The question is, why do geopolitical risks hit chip stocks and tech stocks more than other sectors of the market, even though the chip sector is more insulated from the chaos of the war? There are a couple of reasons for this: 1, the chip trade is big in the retail community, especially in Asia, who also have access to leveraged ETFs, thus when the external environment changes, some of these retail traders may take fright. If they have leveraged positions, this can magnify the sell-off. 2, when geopolitical tensions rise, it can lead to risk aversion and increase demand for physical assets including cash. This leads to some cutting of the most profitable trades, which are South Korean equities and global chip stocks so far this year. The South Korean market is now considered a key barometer of sentiment towards the chip sector, so when it declines it can have ripple effects across the world. With geopolitical risks rising once more, the focus for investors will be earnings season. Analysts remain upbeat on the earnings outlook, which could be why US stocks managed to eke out gains last week, even though President Trump said on Wednesday that the ceasefire was over with Iran.
US still managing to outperform
US indices outperformed their European and Asian counterparts last week. The S&P 500 rose more than 1%, the Nasdaq eked out a 0.9% gain, and the Dow Jones rose 0.4%. This compares with a 1.4% decline in the FTSE 100 last week, and a 1.6% drop in the Eurostoxx 50 index. If US tech stocks sell off sharply today, we could see European indices try and claw back some recent losses, however, over the past month, Europe has been a laggard compared to Asian and US indices, and this may continue as we move through earnings season.
The economic outlook
Overall, the economic data front is proving supportive, US ISM surveys showed a resilient service sector, as tech spending continues to boost economic activity. Added to this, the latest initial jobless claims suggest that the labour market remains solid, even though last month’s payrolls report was weak. In Europe, there were encouraging signs from Germany that its manufacturing sector is getting back on its feet after a long period of decline. In China, CPI is running in the opposite direction from the West and came in lower than expected at 1% YoY.
Andy Burnham to feel the strain from rising oil prices
In the UK, Andy Burnham is expected to be made leader of the Labour Party at the end of this week, before becoming PM next week. He faces a huge set of challenges and is attempting to put together a ‘mega’ budget in the next three months to lay out his plans for tax and spending by October. This means two things, he will likely keep quiet about his economic plans over the summer months, which could backfire on him and lead to wild speculation, secondly, expect a summer of horse trading, as Labour MPs clamor to get a slice of Burnham’s pie. The problem for Burnham remains the UK’s debt costs. Bond yields rose again last week, the 10-year Gilt yield was 12 bps higher.
Although this was in line with gains in yields across Europe, it is a keen reminder that UK bonds are sensitive to oil prices, and any extra borrowing from Burnham will come at a high price. We will be watching bonds and the pound in the coming days, to see if Burnham’s coronation causes any fluctuations in UK asset prices. As trading gets started this morning, bond yields are ticking higher and the gold price is also lower as the dollar catches a bid. This is another reminder that traditional safe havens, like government bonds and gold, offer no protection when geopolitical risks threaten inflation. Thus, if we see continued escalation in the conflict, and the oil price rises back towards $90, we will likely see a deeper selloff in sovereign bonds and in the gold price.
Events to watch this week
Geopolitical risks combine with monetary policy risks this week, as Kevin Warsh, the new
Will there be a World Cup boost? The June payrolls report is released today at 1330 BST, a day early this month due to the Independence day holiday on Friday. The market is expecting an approximately 113k increase in payrolls, which is a step down from the 172k print for May, the unemployment rate is expected to remain stable at 4.3%, and average hourly earnings could pick up a notch to 3.5% from 3.4% YoY. The strong reading for May makes the June report a test: can the upside momentum be maintained, or was the May figure an anomaly? Federal government jobs jumped last month, but this is expected to be one-off. If we get a reading that is close to consensus, then it would suggest modest growth in US jobs numbers are continuing. This would point to a resilient labour market that is not falling off a cliff.
Resilient labour market
Average monthly jobs growth this year has been above 80k, and we do not expect a number lower than this. The Atlanta Fed’s GDPNow model is predicting robust GDP growth for Q2 of 2.5%, which should easily support US job growth of 100k plus. We expect the bulk of jobs to have been created in the education and healthcare sector, with decent gains for construction and leisure and hospitality. The question is, could there be a World Cup boost? Stadium attendance at games so far in the US has hit a record high, of more than 3.5mn, which could boost hotels and the leisure sector.
Will payrolls boost Fed rate hike chances?
This payrolls report comes a day after the new Federal Reserve Chair, Kevin Warsh, spoke at the ECB’s central bankers conference in Portugal. Kevin Warsh said a few things that are worth noting. Firstly, that inflation expectations are moderating, secondly, that AI’s impact on the jobs market is not yet visible and thirdly, that his task forces could change what economic data the Fed focuses on. The latter point is worth noting. Although we think that payrolls will remain important for central bank decision making, change is coming at the Fed. As we lead up to this payrolls report, the market continues to price in a 28% chance of a rate hike at the Fed’s next meeting on 29th July.
Interest rate futures markets have repriced rates higher after a surprisingly hawkish FOMC meeting, and if we get a significant upside surprise for payrolls today, of 180k plus, then we could see the chance of a July rate hike surge past 50%. So far, the lead indicators have been mixed. Although the ISM manufacturing employment index was stronger, it remained below 50. Added to this, the ADP private sector payrolls report was slightly weaker than expected and was 113k for last month. The 4-week moving average for initial jobless claims ticked higher last week, but at 224k, it is still low.
The impact of a downside surprise
A downside surprise of 70k or lower could see the US Treasury curve steepen, as 2-year Treasury yields fall, and long-end bond yields rise. We think a weaker number could also lead to a recalibration of US interest rate expectations, and we think the Fed would be unlikely to hike rates in July if the labour market is showing signs of softening, especially if the unemployment rate also rises.
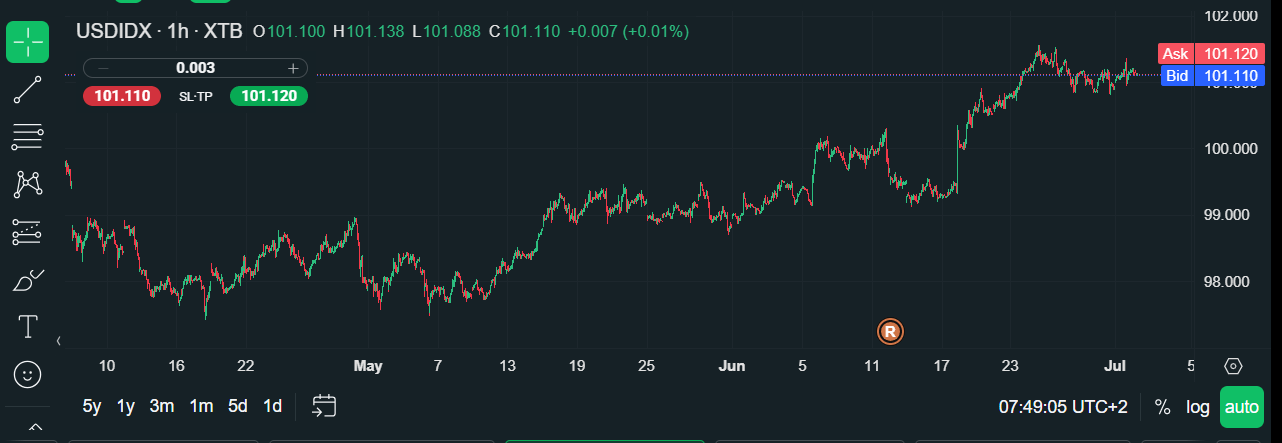
What’s next for the dollar
This data will also be the next major driver of the dollar, at least until we get the June CPI report. The US dollar index is at a 14-month high, and the US dollar is the best performing currency in the past year. In the past month, the USD index has risen by 2.5%. The break above 100.50 2 weeks ago was an extremely bullish development, and is supportive of further gains. However, the forex market can be contrarian around payrolls reports, so we could see some buying the rumour, before selling the fact later on Thursday. The technicals continue to point in a bullish direction, so the path of least resistance is for further gains for the Greenback. If payrolls are weak, and the dollar does experience a sell off, as long as the dollar index does not fall below 100.50, then the uptrend remains intact.
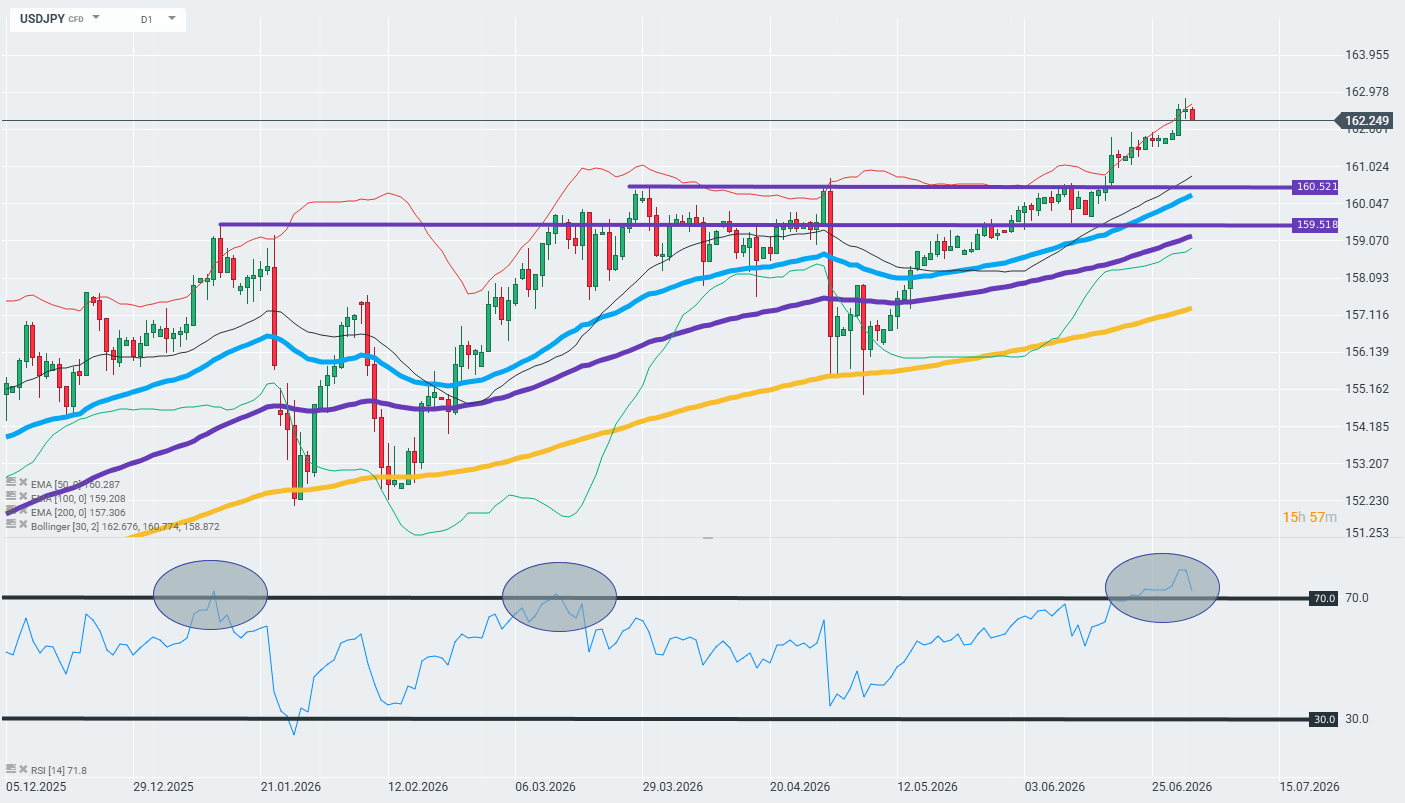
USDJPY is trading slightly lower this morning at 162.70 (-0.15%) after hitting new multi-year highs around 163, as the market awaits the key U.S. payrolls report.
Context of Today’s NFP Data
Today’s June payrolls report is the main catalyst of the day—the consensus expects a marked slowdown to about 110,000 jobs following a surprisingly strong May reading of 172,000, with the unemployment rate holding steady at 4.3% and wage growth accelerating to 3.5% y/y. The market is trying to assess whether May’s surge represented a genuine labor market recovery or merely a one-off effect (including the World Cup in the U.S.). Employment growth this year has averaged above 80,000, which supports the scenario of a resilient labor market. CBA warns that another positive surprise could push USD/JPY toward 165 and test the Japanese authorities’ determination to defend the yen, while a weak reading (below 70,000–90,000) would ease pressure on the Fed to remain hawkish and could trigger a downward correction in the pair.
Technical Analysis
The price broke through key resistance levels at 159.52 and 160.52 JPY with momentum, moving clearly above the 50-day EMA (160.29), the 100-day EMA (159.21), and the 200-day EMA (157.31), confirming a strong uptrend. However, the RSI at 71.8–76.2 signals overbought conditions on the daily chart, which historically has preceded short-term consolidations or corrections, especially near multi-year highs. The trend remains clearly bullish for the dollar (bearish for the yen), and the 162–163 range also represents an area of heightened risk of currency intervention by Japanese authorities. Source: xStation
A Brief Look at Data from Japan
The Bank of Japan raised its policy rate to 1.0% in June—the highest level in 31 years—but the market does not expect another hike until the October–December 2026 window, even though about 90% of economists anticipate one more hike by December. This slow pace of policy normalization by the BoJ, coupled with the hawkish stance of the Fed, is the main structural reason why the interest rate differential between the U.S. and Japan remains wide and is sustaining the yen’s long-term downward trend—verbal interventions by Japanese officials have so far failed to permanently reverse this trend.
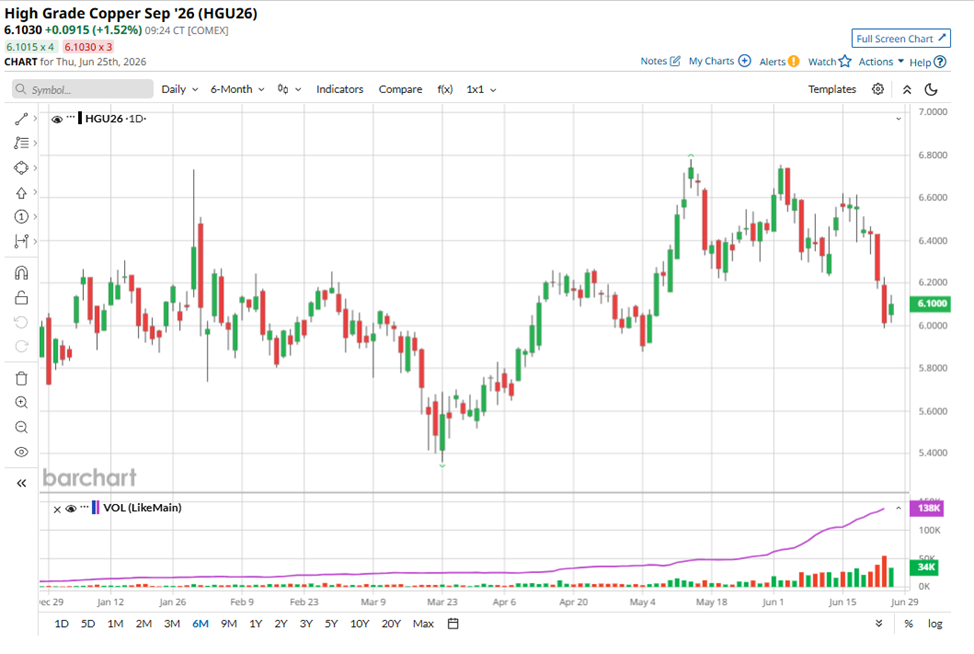
If you look at the copper market chart over the past 10 years, it might seem like a perfectly balanced system. Market “bears” love to point to these figures. Global consumption has grown to about 28 million tons per year, but the industry has coped. Production has increased, and supply has met demand. No copper apocalypse has happened yet.
At first glance, everything is under control — but this is a very dangerous illusion. Those who assess copper’s prospects relying only on the charts of the past decade are making a fundamental mistake. They see that the system has remained in balance, but they fail to understand how this balance has been maintained.
Personally, I have come to the conclusion that the copper market has survived due to powerful “compensators” in recent years. This refers to a phenomenal technological leap in mining, the depletion of the richest legacy deposits, and the aggressive pushed-to-the-limit collection of secondary raw materials. The problem is that all of these compensators are not infinite.
The era of easy solutions is over. To understand why the next 10 years of the copper market will not look like the previous decade, we need to put aside financial reports and recall the basic laws of physics.
www.barchart.com
A Physical Dead End: Why Copper Cannot Be Replaced
When we talk about oil, we know there are alternative sources of energy. Solar. Wind power. But when it comes to power electrical engineering, copper has become an unrivaled monopolist — and the reasons for this are embedded in the universe’s architecture itself.
Why is there so much aluminum, silicon, and iron on Earth but so little copper? The answer lies in the stars. All chemical elements lighter than iron are synthesized in the cores of stars during their normal lifespans, so they are abundant in the Earth’s crust. But copper is heavier than iron.
Elements of this type are born in the universe only during events like supernova explosions or neutron star mergers. Pure physics tells us that copper is inherently present in nature in orders of magnitude less than lighter metals. It is a non-renewable resource, and total geological reserves are fundamentally limited.
Ohm’s Law and the Engineer’s Trap
Copper has a uniquely low electrical resistivity. Only silver performs better, but it is too rare and insanely expensive for industrial use.
But why not replace copper with cheap aluminum, which is plentiful? This is where the main technological trap lies. Aluminum is great for overhead power lines where wire thickness is not critical, but aluminum’s resistance is much higher than copper’s resistance. If you try to wind an electric motor coil from aluminum wire instead of copper, you will have to make the motor much heavier to get the same power.
For the modern world — where the compactness and efficiency of electric vehicles (EVs), drones, and industrial robots are crucial — this is an engineering death sentence. You cannot put a refrigerator-sized motor in a modern EV. In closed systems where electricity is converted into kinetic energy, there is simply no substitute for copper.
Copper Devourers: The Real Reason for Exponential Demand
When the average person hears about copper demand, they probably imagine wires in the walls of new houses or cables for data centers. Yes, those use cases are important. But a cable in a wall is static demand — it is laid once and serves for decades. The real monster beginning to devour global copper reserves right now is the electric motor.
The world is in a stage of transitioning to electric propulsion, and this process is only gaining momentum. The heart of any electric motor is a tightly wound copper stator and rotor coil. The more motors, the faster copper reserves are depleted. Take EVs. The average electric car requires three to four times more pure copper than a traditional internal combustion engine (ICE) vehicle, and the lion’s share of this metal goes not into the wiring but directly into the massive power unit.
Add to this total automation. In modern factories, every new industrial robot, conveyor, servo drive, powerful pump, or climate-control system means dozens and hundreds of new electric motors.
Copper demand from electric drive manufacturers will grow not linearly, but exponentially. Humanity will produce hundreds of millions of new electric motors in the coming decade, and each of them will require a metal born in supernovas. A metal that engineers physically cannot replace with cheap aluminum.
Tactical Shock: AI Infrastructure and Liquid Cooling
While electric motors are a fundamental demand driver for the next decade, a massive tactical shock is also unfolding in the market right now: infrastructure for artificial intelligence (AI).
In 2024, at the peak of the first wave of the AI hype, investors were buying shares of chipmakers. For the copper market, this didn’t matter much. Microprocessors and printed circuit boards themselves consume a negligibly small amount of metal, compared to a scale of millions of tons. But now the virtual hype has turned into a giant physical construction site.
Modern server racks for AI consume a massive 100 to 120 kilowatts of energy, and ordinary cables simply cannot handle such a load. The industry is urgently shifting to massive copper busbars. These are thick, solid strips of pure copper for power distribution within racks.
Moreover, with such heat dissipation, traditional fans can no longer cope. Data centers are being forced to switch to direct liquid cooling systems, which means kilometers of copper tubing, copper cold plates on processors, and giant heat exchangers. In these systems, copper is necessary due to its phenomenal thermal conductivity.
Yes, in absolute terms, data centers do not consume millions of tons like the auto industry. But in the commodity market, the price balance is determined by marginal demand. In an environment where the copper market is already stretched, the sudden emergence of an industry that urgently needs additional tens of thousands —and even hundreds of thousands — of tons of copper becomes that very drop. The drop that overflows the cup.
Production Crisis: The Age of ‘Compensators’ Is Over
So, copper demand is guaranteed to go up due to mass electrification and millions of new electric motors. But why won’t the mining industry be able to respond to this challenge the same way that it has over the last 10 years?
The answer lies in the exhaustion of the three main “compensators” that have so far masked the looming deficit.
Over the past two decades, the mining industry has made a colossal leap in labor productivity. The introduction of giant 400-ton autonomous haul trucks, automated drilling rigs, and control systems has allowed companies to sharply reduce production costs.
This technological boom made it profitable to extract copper from extremely low-grade ore. If 50 years ago, a copper grade of 1% to 2% was considered the norm, today industry giants are forced to process ore with a grade of only 0.4% to 0.5%.
But this technical progress is not infinite. The effect of automation will weaken because raising efficiency, having a high base, will become more and more difficult. Modern dump trucks are already highly efficient. But as the quality of the remaining ore in the ground continues to decline, mining the same ton of copper will now require processing more and more waste rock. That means higher costs for energy, water, and logistics — costs that can no longer be offset by smart electronics.
The Secondary Processing Wall and the Scrap Illusion
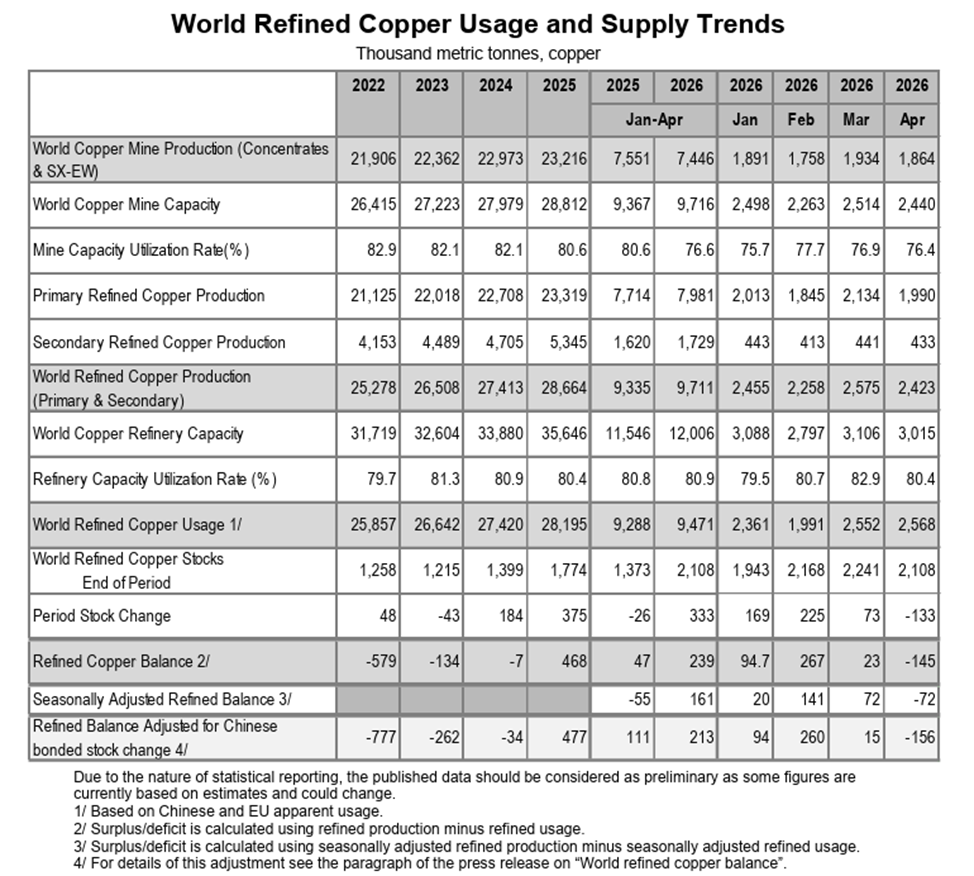
“Bears” often argue their position by claiming that the deficit will be covered by processing secondary raw materials. Indeed, in recent years, as copper prices moderately rose, the world began to collect and recycle scrap much more meticulously. Dry statistics, at first glance, give them reason for optimism. From 2024 to 2025, global production of secondary refined copper made an anomalous jump from 4.705 million tons to 5.345 million tons.
But a fundamental mistake lies here. This is a banal misunderstanding of the difference between primary and secondary raw materials.
Primary extraction of ore from the ground is a real, systemic influx of new metal into the economy, while secondary scrap is merely an exhaustible reservoir from past years. Rising prices forced the market to aggressively “vacuum up” scrap, but this process has a strict economic limit. Secondary raw material collection has its own cost curve. You can quickly and cheaply pump easily accessible reserves out of the market, but as soon as this superficial reservoir empties, the cost of finding, dismantling, and transporting each subsequent ton of old copper skyrockets.
If you want to see what this trap looks like in real time, just look at statistics from the International Copper Study Group for early 2026. Fundamental global mine production for January to April 2026 dropped to 7.446 million tons compared to 7.551 million tons for the same period in 2025. This means that physically less metal was extracted from the ground.
Chart courtesy of International Copper Study Group.
So, where did the temporary surplus at the beginning of the year come from? Smelters simply “threw into the furnace” the accumulated scrap reserves. Secondary production over the same period grew from 1.62 million tons to 1.729 million tons.
But this surge in secondary processing cannot be extrapolated into the future. You cannot systematically load capacity with scrap because it depletes quickly. Already in April, the overall refined copper balance plunged into a deficit of -145,000 tons.
A Geological and Time Dead End
New large and easily accessible copper deposits on the planet simply aren’t being discovered. All the “easy” copper has already been mined.
To launch a new mega-mine from scratch in the current environment, it takes 10 to 15 years — from initial geological exploration and obtaining environmental permits to shipping the first commercial ton. For many years, the capital expenditures of mining companies were constrained due to low commodity prices.
Because of this underinvestment in the past, the physical supply of copper today is locked in time. The industry will simply not have time to ramp up capacity by the time demand makes its next leap.
Copper Is the Main Metal of the Future
Without copper, the entire “green” and technological revolution will simply halt on paper. Copper is not just an industrial raw material. It is the physical foundation, the blood, and the muscles of the future.
What we have seen on the charts recently — breaking local highs and the start of an uptrend — is not temporary speculative hype. It is the very beginning of a tectonic shift. The broader market is only just beginning to realize the scale of the impending problem.
In the next 10 years, the copper market will inevitably enter a phase of structural deficit. Since supply is constrained by physical, geological, and technological boundaries, and secondary reserves are already being fully utilized, the only way to balance the market in the future is “demand destruction.” And the only mechanism for demand destruction in a market economy is a price increase.
Copper prices will have to reach fundamentally new historical levels — levels so high that some consumers will simply refuse to use copper where it is still physically possible. This very action will be able to balance supply and demand.
For the long-term investor, this forms one of the most reliable and asymmetric opportunities in the market. Investing in copper, and in the shares of fundamentally strong mining companies with real reserves in the ground, is not a bet on market
arvell (MRVL). The chip producers, the ones that are reporting double to triple-digit growth quarter over quarter. The ones that dominate headlines with big green charts and arrows every time.
But it takes far more than silicon to run artificial intelligence (AI).
Every AI model, every chatbot response, and every image generation request ultimately runs inside a data center. And those data centers consume staggering amounts of electricity.
In fact, as AI workloads continue to expand, power increasingly becomes the limiting factor in day-to-day operations. You can have the newest and most advanced GPU clusters around, all cooled by the most sophisticated thermal tech in the industry, connected by the best networking platforms in the world.
But none of that matters if you don’t have enough electricity to turn on any of the servers.
That’s why some investors are looking beyond semiconductors and toward a less obvious beneficiary of the AI boom: the companies that generate and deliver the power that keeps these data centers online, and the ones that are building the parts that make it all happen.
Why AI is driving a $2.2 trillion power market
The power generation industry is valued at around $1.3 trillion today, according to industry estimates, and is expected to grow to $2.2 trillion by 2034.
Historically, the biggest driver of the power generation industry was the increasing urbanization of developing countries. But the sharp rise in data center demand, with its enormous requirements for computing power, is what’s further driving that expected growth.
As a result, companies across the power value chain stand to benefit from what could become a decade-long investment cycle, not only from AI but also from secular tailwinds.
Where are the sector bottlenecks?
Before anything else, we need to cover where the opportunities are in the power sector, at least in the context of AI demand. And to do that, we need to break down the value chain and see where the bottlenecks lie.
Power producers and the 20-year PPAs feeding AI data centers
First, we have the raw materials and energy producers. Think fuels: natural gas (NGQ26), solar, wind, and uranium, as well as the companies that convert them into energy. This is the business at the very base of the value chain, where everything starts.
Historically, many power producers sold electricity into wholesale markets, where prices fluctuate based on supply and demand. But the rise of AI is changing that dynamic.
Hyperscalers such as Microsoft (MSFT), Amazon (AMZN), Google (GOOGL), and Meta (META) increasingly need guaranteed, 24/7 access to massive amounts of power. By that, I mean they can’t just connect to a light socket and call it a day. They need to go straight to the power producers to get what they need.
Power producers respond, usually in the form of power purchase agreements (PPAs), in which the data center operator commits to buying electricity from a producer for extended periods, often lasting 20 or more years. These agreements provide energy companies with stable, predictable cash flows while giving data center operators confidence that sufficient power will be available as they expand capacity.
So, when you see a power company bagging one of these PPAs from a hyperscaler, you know you’re seeing trust and validation in one deal. Now, if you see multiple deals, well, that just solidifies the bull case.
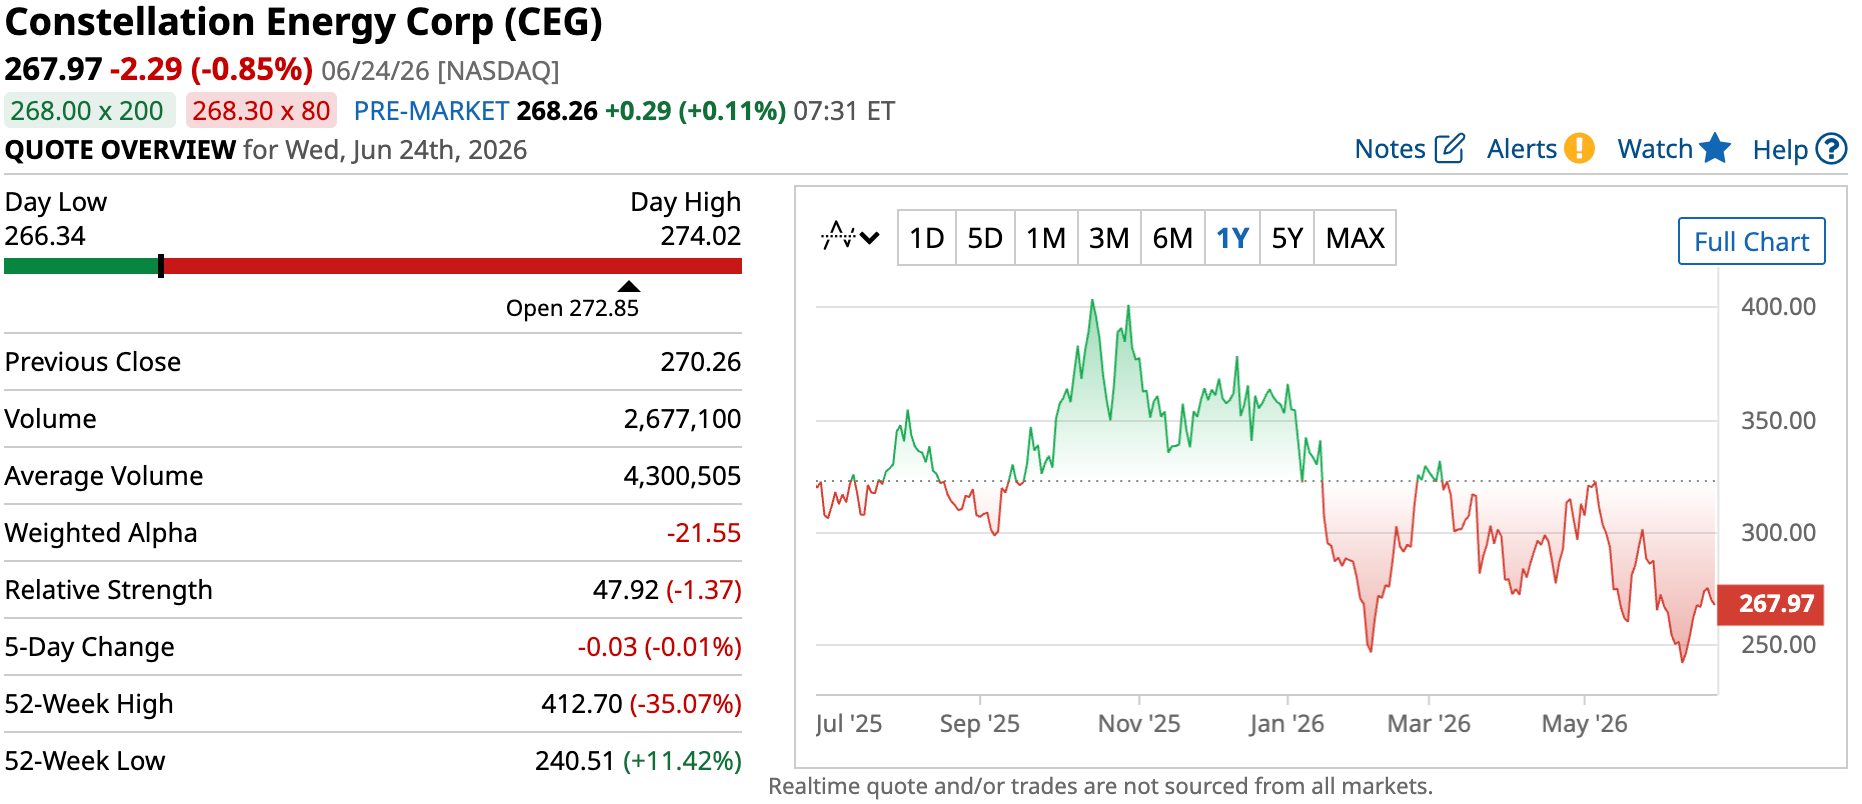
The biggest example of this kind of relationship is between Microsoft and Constellation Energy.
Constellation Energy (CEG): The go-to stock for AI nuclear power
CEG has bagged mega Mag 7 deals.
Just a couple of years ago, Microsoft inked a deal with CEG to create the Crane Clean Energy Center. This is a project that was widely reported to restart Unit 1 of the (former) Three Mile Island nuclear plant. The deal is for 20 years, with the PPA being so big that Constellation is investing ~$1.6 billion to bring the reactor (back) online for Microsoft.
Once Unit 1 is online, it could make as much as 7 million megawatt-hours of power per year, assuming everything runs as planned.
If that’s not all, last year, Meta inked a deal with Constellation to launch the Clinton Clean Energy Center. Like with Microsoft, the deal is for a 20-year PPA, and CEG will add an additional 30 megawatts of output by way of nuclear uprates. This particular PPA covers 1.21 gigawatts of clean nuclear power, which could translate to ~9 million megawatt-hours of annual production.
The Microsoft and Meta deals are standout examples of how CEG can grow for decades. Granted, the exact financial details of the PPAs haven’t been made public, but you can be almost sure they are going to be lucrative. In fact, some analysts estimate Microsoft could be paying between $110-115 per megawatt hour. If that were the case, it would imply as much as $800+ million in annual revenue – on the Microsoft deal alone.
Of course, CEG is not alone in bagging power deals with hyperscalers.
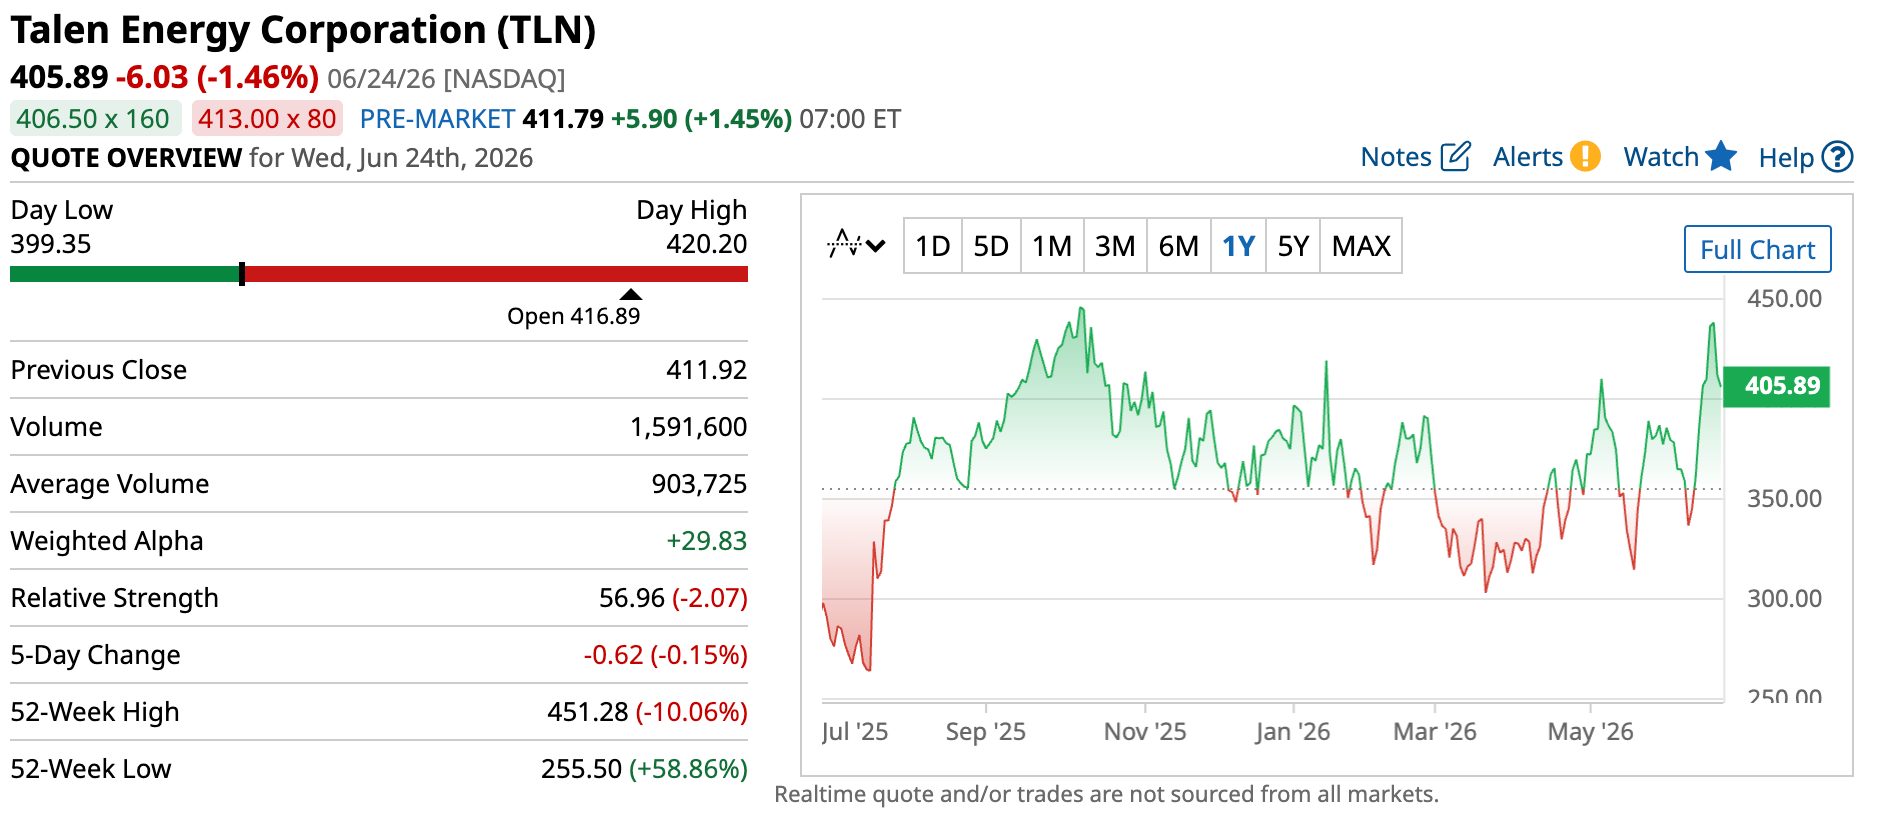
Talen Energy (TLN): The Amazon nuclear deal next door
Talen linked up with Amazon on a power pact.
Talen Energy, a relatively new player in the space, has partnered with Amazon to produce up to 1.9 gigawatts of nuclear capacity from its Susquehanna plant. But Talen’s plant is directly adjacent to Amazon’s data center.
That means the deal can significantly reduce the need to move electricity across the broader transmission and distribution network. Instead of sending power across hundreds of miles of grid infrastructure, electricity can be delivered almost directly from the source to the data center.
The arrangement not only minimizes transmission losses but also helps hyperscalers secure reliable access to power in a market where grid capacity is increasingly becoming the bottleneck. No congestion pricing, no interconnection delays, and no third-party dependencies to worry about. That’s practically a match made in heaven for data centers.
But, true adjacency – as in building plants right beside data centers, instead of somewhere else that’s relatively nearby – faces growing geographical and regulatory constraints. Even now, just finding “good enough” places to build the next data center is becoming a challenge. Tack on a nuclear plant right beside it? The challenges multiply.
That’s why Talen Energy’s approach, while wildly attractive, may not be the gold standard. And that’s why we need to look into other parts of the value chain.
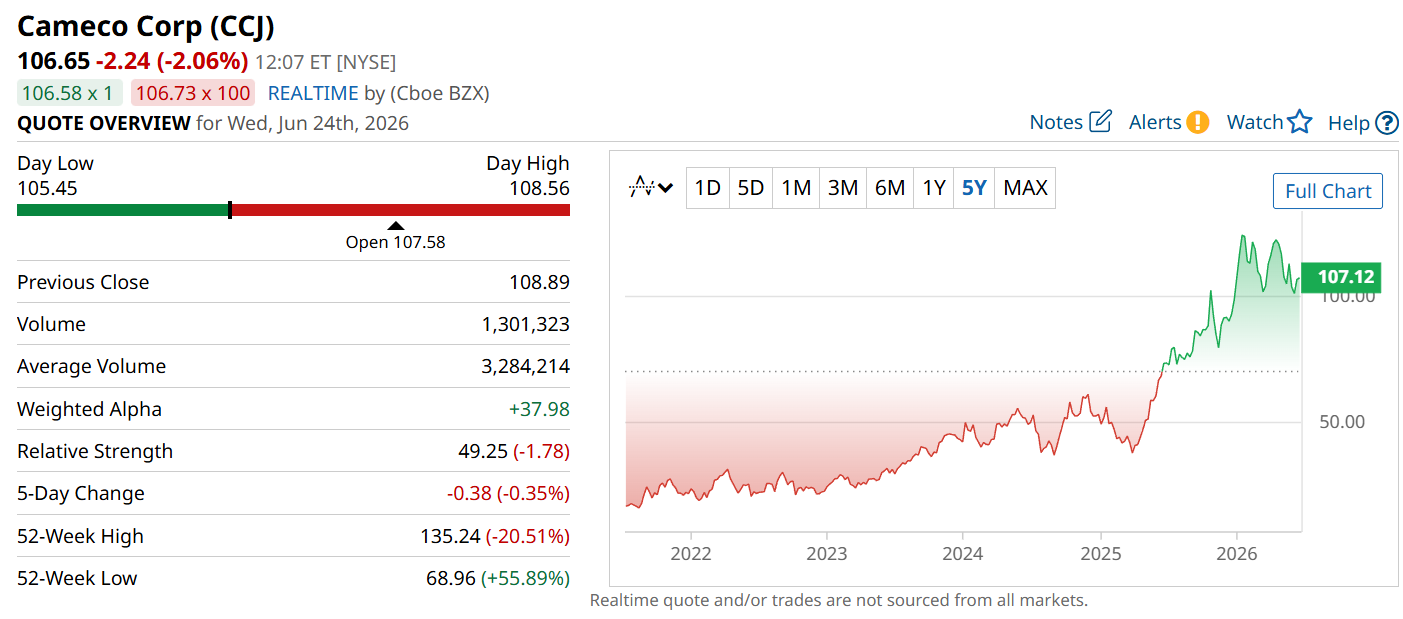
Cameco Corp (CCJ): The uranium picks-and-shovels play for AI
Now, as for the raw material providers, the relationship is one step removed from hyperscaler deals, but that doesn’t mean they don’t benefit from them. In fact, let me call your attention to another interesting player in the nuclear power space.
CCJ sits further down the value chain.
Cameco Corp operates a little further down the value chain. It doesn’t generate electricity, but it does produce uranium oxide concentrate, otherwise known as yellowcake. This is the preferred fuel by many nuclear reactor operators due to its high energy density, reliability, and ability to provide consistent baseload power.
Cameco has major mining operations in Canada and Kazakhstan, and also participates in nuclear fuel services and reactor technology. And while the company’s involvement in AI power growth isn’t as direct as CEG’s, as hyperscalers increasingly lean into nuclear, Cameco should grow. As demand for nuclear energy continues to rise, utilities like Constellation benefit from selling more electricity, while uranium suppliers like Cameco benefit from increased fuel demand. It’s a symbiotic relationship.
Of course, the relationship isn’t perfect. Cameco’s performance is still heavily influenced by uranium prices, supply dynamics, and long-term contracting activity. But as hyperscalers continue signing nuclear deals and utilities respond by extending the lives of existing reactors or building new capacity, the long-term outlook for uranium demand becomes increasingly attractive.
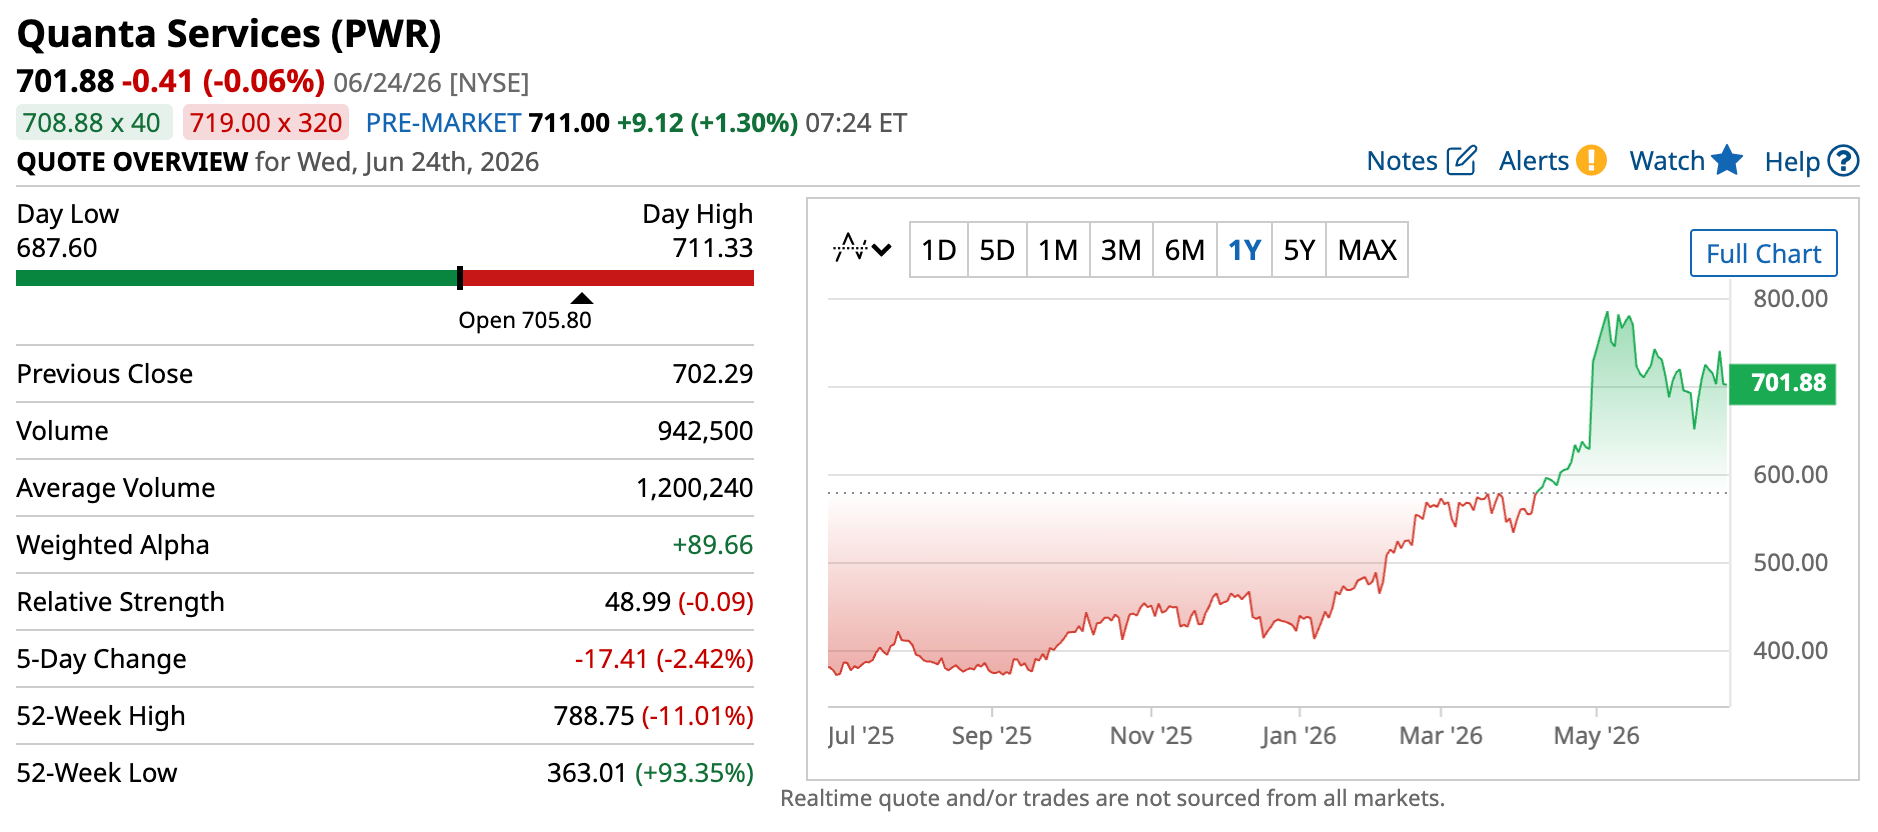
Quanta Services (PWR): The grid bottleneck behind AI power
Another bottleneck that’s becoming increasingly important for AI power demand is distribution. Transmission lines, substations, and grid infrastructure are all critical to supplying power-hungry data centers. And as one might expect, companies sitting in the crossroads are likely to benefit from the growing demand.
Certain companies that operate with true adjacency, like Talen Energy, remove this requirement entirely. But that’s somewhat unique in the space, so many power providers and hyperscalers still need to deal with distributors.
One of the clearest examples of this is Quanta Services.
Quanta provides the “blood vessels” of the industry.
Quanta operates in the physical layer that makes large-scale AI deployment possible in the first place. That includes transmission buildouts, high-voltage substations, and the electrical infrastructure required to connect new data center campuses to increasingly constrained regional grids. It is one of the largest engineering and construction services contractors in North America’s power transmission sector.
Think of it this way: energy producers operate the heart, while companies like Quanta make and maintain the blood vessels.
Every new data center, manufacturing facility, or large industrial project still needs to be physically connected to the grid, and they usually opt for the biggest and most capable players. That leaves Quanta well-positioned to capture that demand.
In many cases, the constraint isn’t the generation capacity itself, but the ability to interconnect new load to an already congested transmission system. And that’s where the opportunity is: to take part in data center demand.
Quanta’s management has already highlighted that AI-driven power demand is now a major growth driver for the company. But because of its broader distribution business, demand across other large-load industries also serves as a catalyst.
Now, to be clear, power distribution won’t enter into PPAs. But there is a clear line between increased PPAs from the producers and increased demand for distribution. In fact, if you’ll notice, all four companies I’ve covered so far practically have the same graph over the last five years. Sure, there are small differences in magnitude, but the broader trend is unmistakable: these companies are beneficiaries of the same secular tailwind, practically all at the same time. And it makes sense when you think about it. More AI workloads require more data centers.
More data centers require more electricity, which leads to more power generation, more fuel consumption, and massive investments in transmission and grid infrastructure.
Bottom line: As long as hyperscalers continue their aggressive spending on AI infrastructure, every link in the power production chain stands to benefit.
Electrical equipment stocks: Eaton, Schneider, and GE Vernova
Now, if you thought we were on the ground level, we’re not – at least, not yet. One level deeper are those companies that support both power generation and grid infrastructure. These are the players that actively build, connect, and scale the physical backbone that enables both.
In the broader structure of the AI power stack, this layer sits between high-level grid construction and end-use electricity consumption. It serves as the industrial foundation that determines whether capacity can actually be deployed at speed. In practice, this is where the constraint becomes physical rather than theoretical. Because even if generation capacity is available and even if demand is fully contracted through long-term agreements, none of it translates into usable supply unless the underlying infrastructure can be built fast enough.
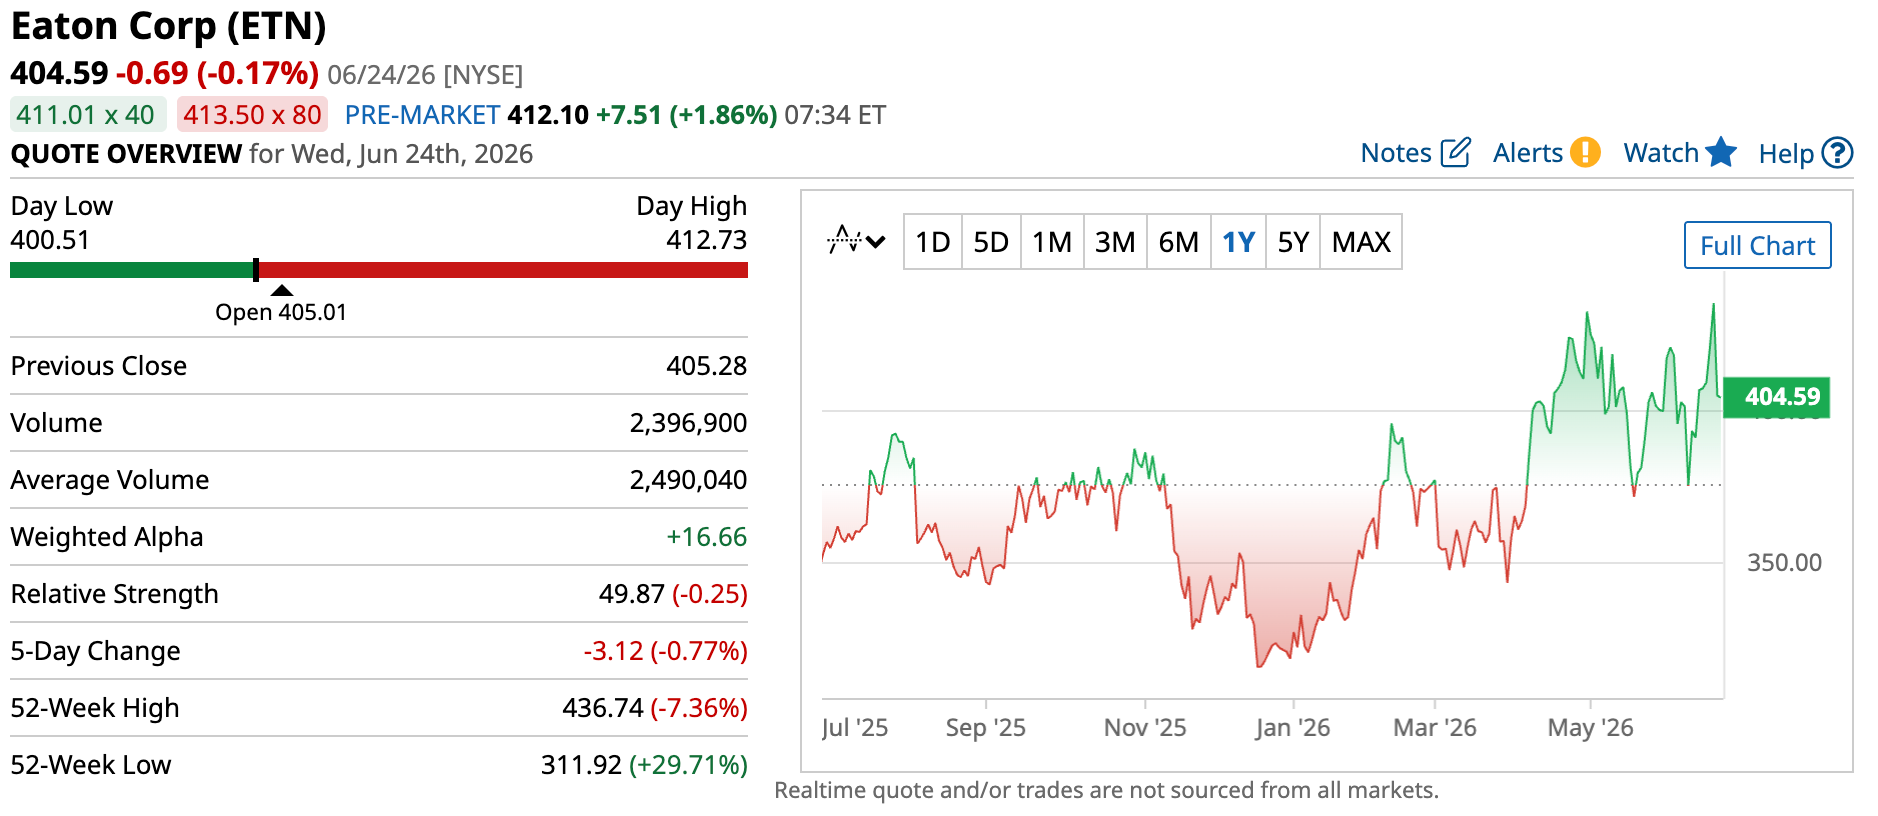
Now we can look to the companies that supply those parts of power production and infrastructure. One good example is Eaton Corp (ETN).
ETN is a clutch equipment pick.
The company manufactures electrical hardware such as switchgear, breakers, transformers, uninterruptible power supply systems, and more. These pieces of equipment are critical components to running not just data centers but also your typical modern industrial enterprise as well.
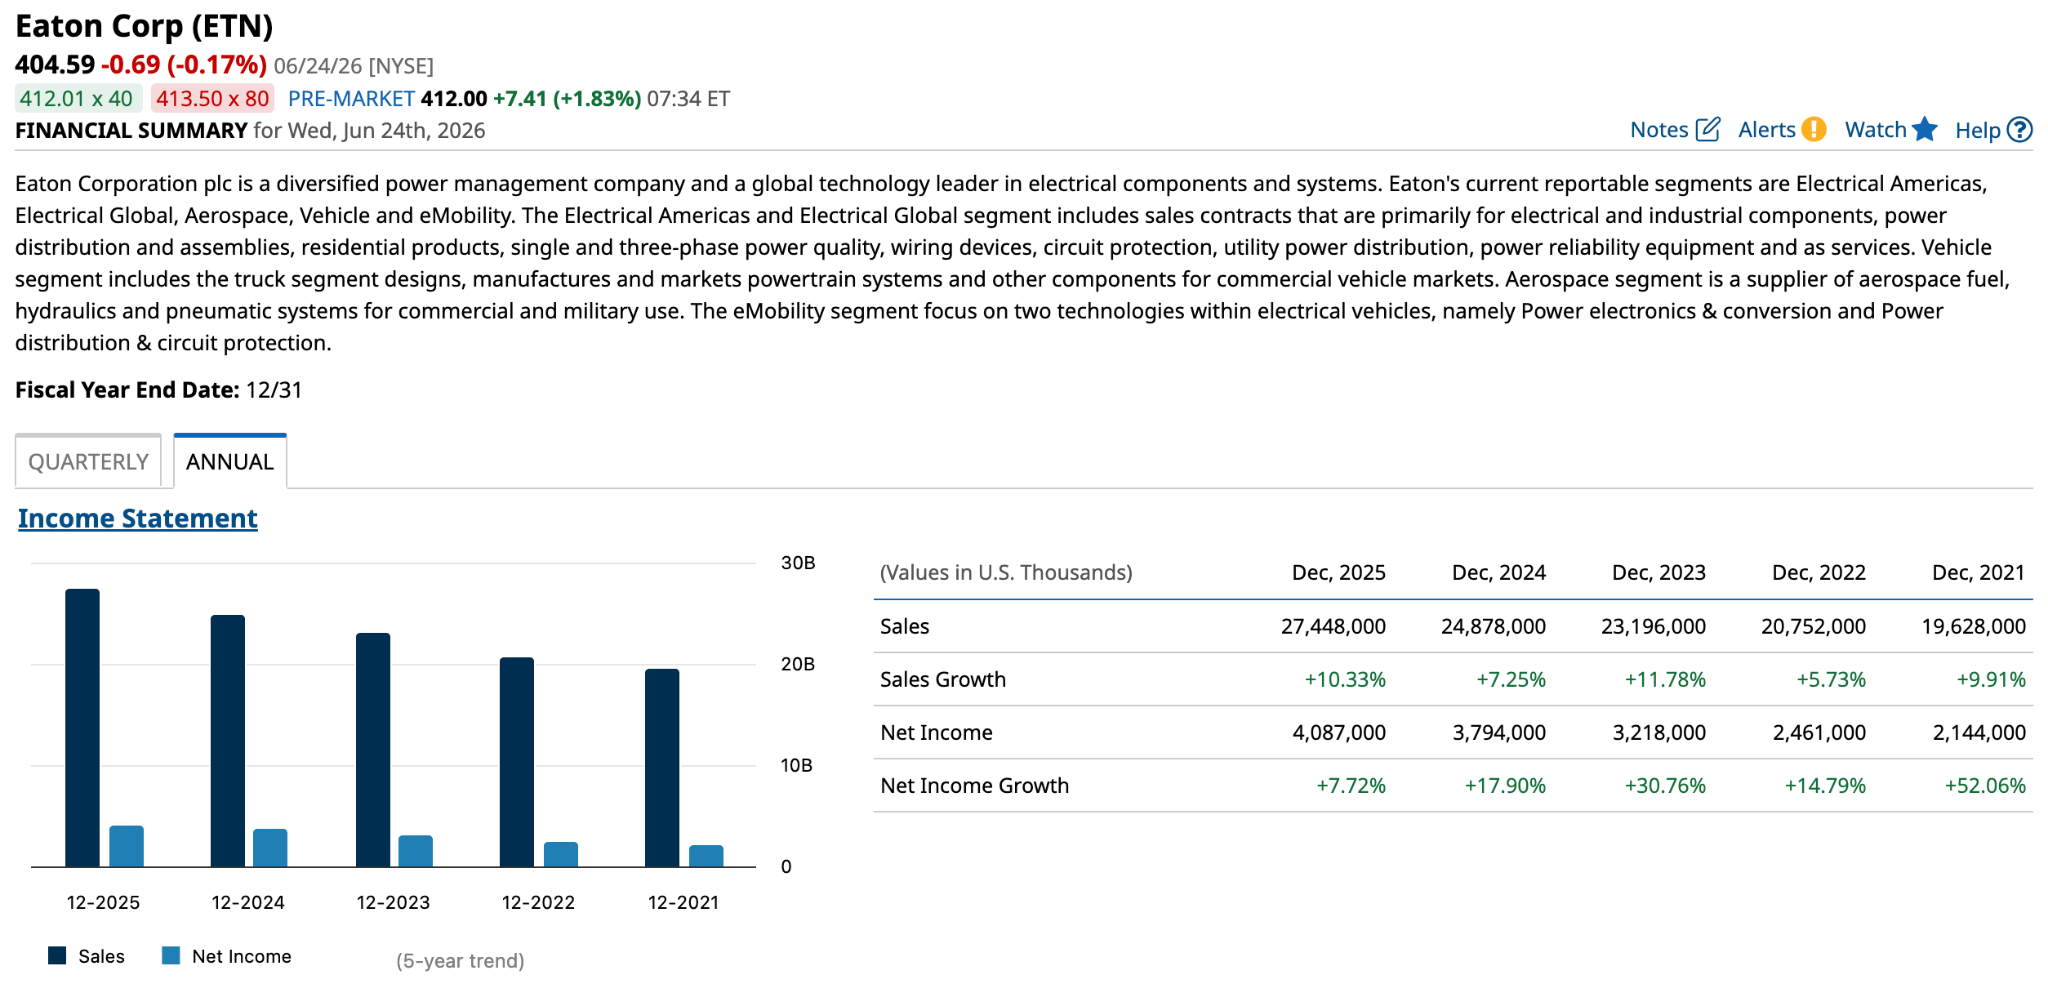
What makes Eaton particularly relevant today is that these components are not optional upgrades. Electrical systems need these parts. So, we can say increased demand directly translates into increased sales, as a quick snapshot of Eaton’s annual financials will attest.
In effect, Eaton sits in the electrical component layer of the stack, supplying the core hardware that allows both industrial facilities and hyperscale data centers to safely distribute and regulate power at scale.
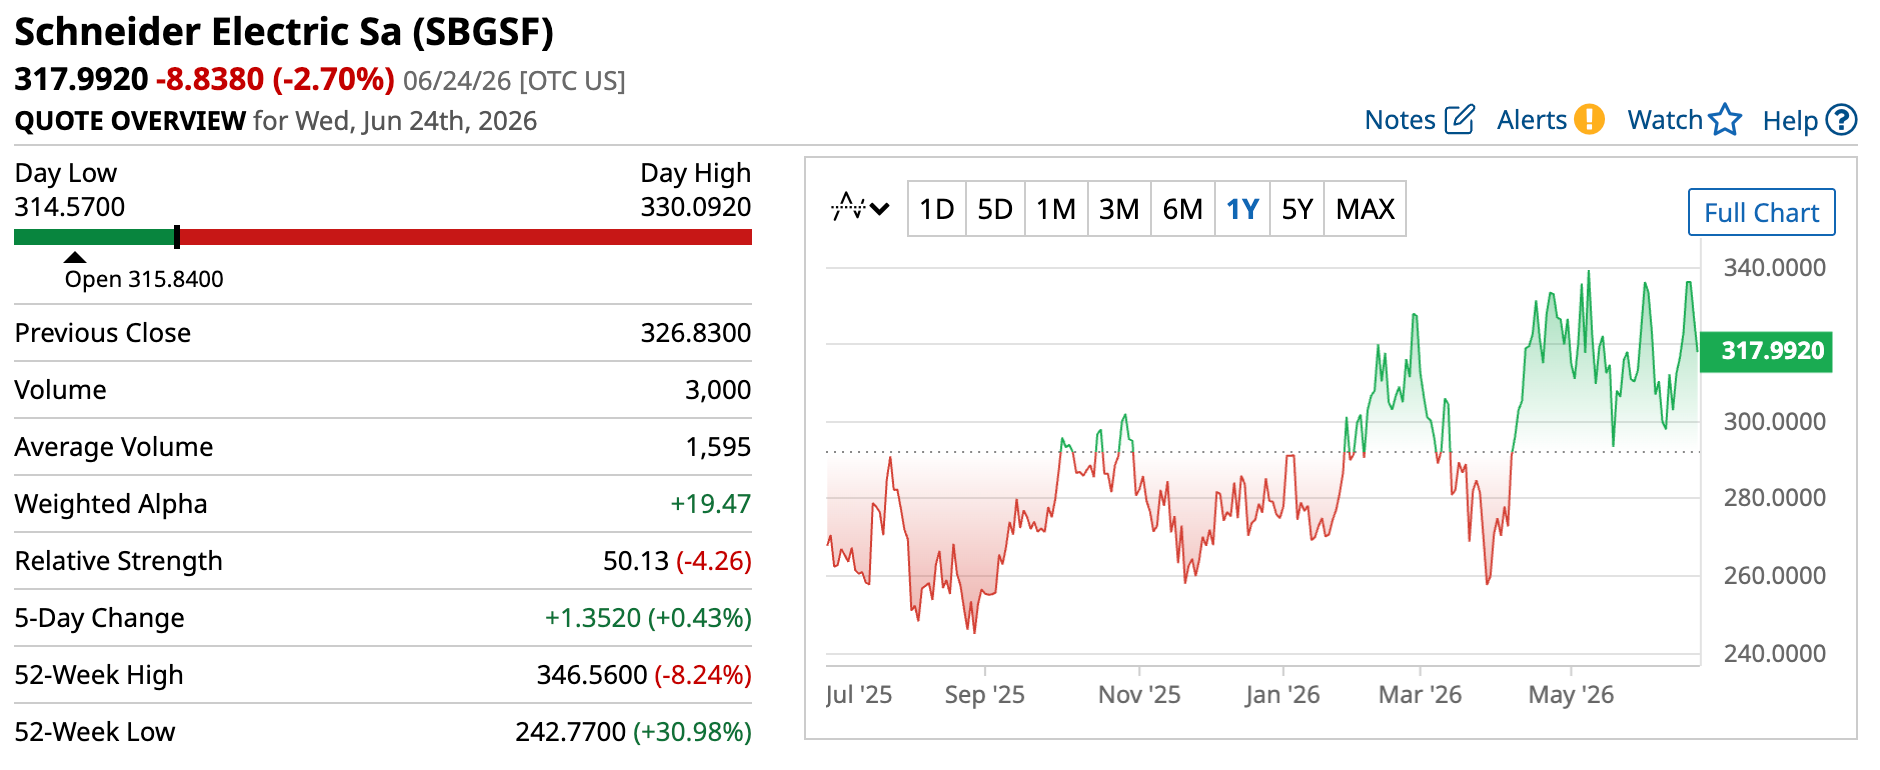
Another, albeit different, example here is Schneider Electric (SBGSF).
Schneider trades OTC.
Unlike component manufacturers, Schneider designs and deploys integrated energy management systems that get deployed in data centers, industrial facilities, and utility networks. The entire value chain.
In practical terms, more and more, Schneider is responsible for how entire facilities manage power flow end to end. Power efficiency matters more in data centers that consume enough electricity to power small cities, where every kilowatt counts and even small, persistent energy losses can translate into massive financial costs.
This positions Schneider closer to the systems and control layer of the grid, where software, monitoring, and integrated electrical architecture determine how efficiently large-scale infrastructure operates once built.
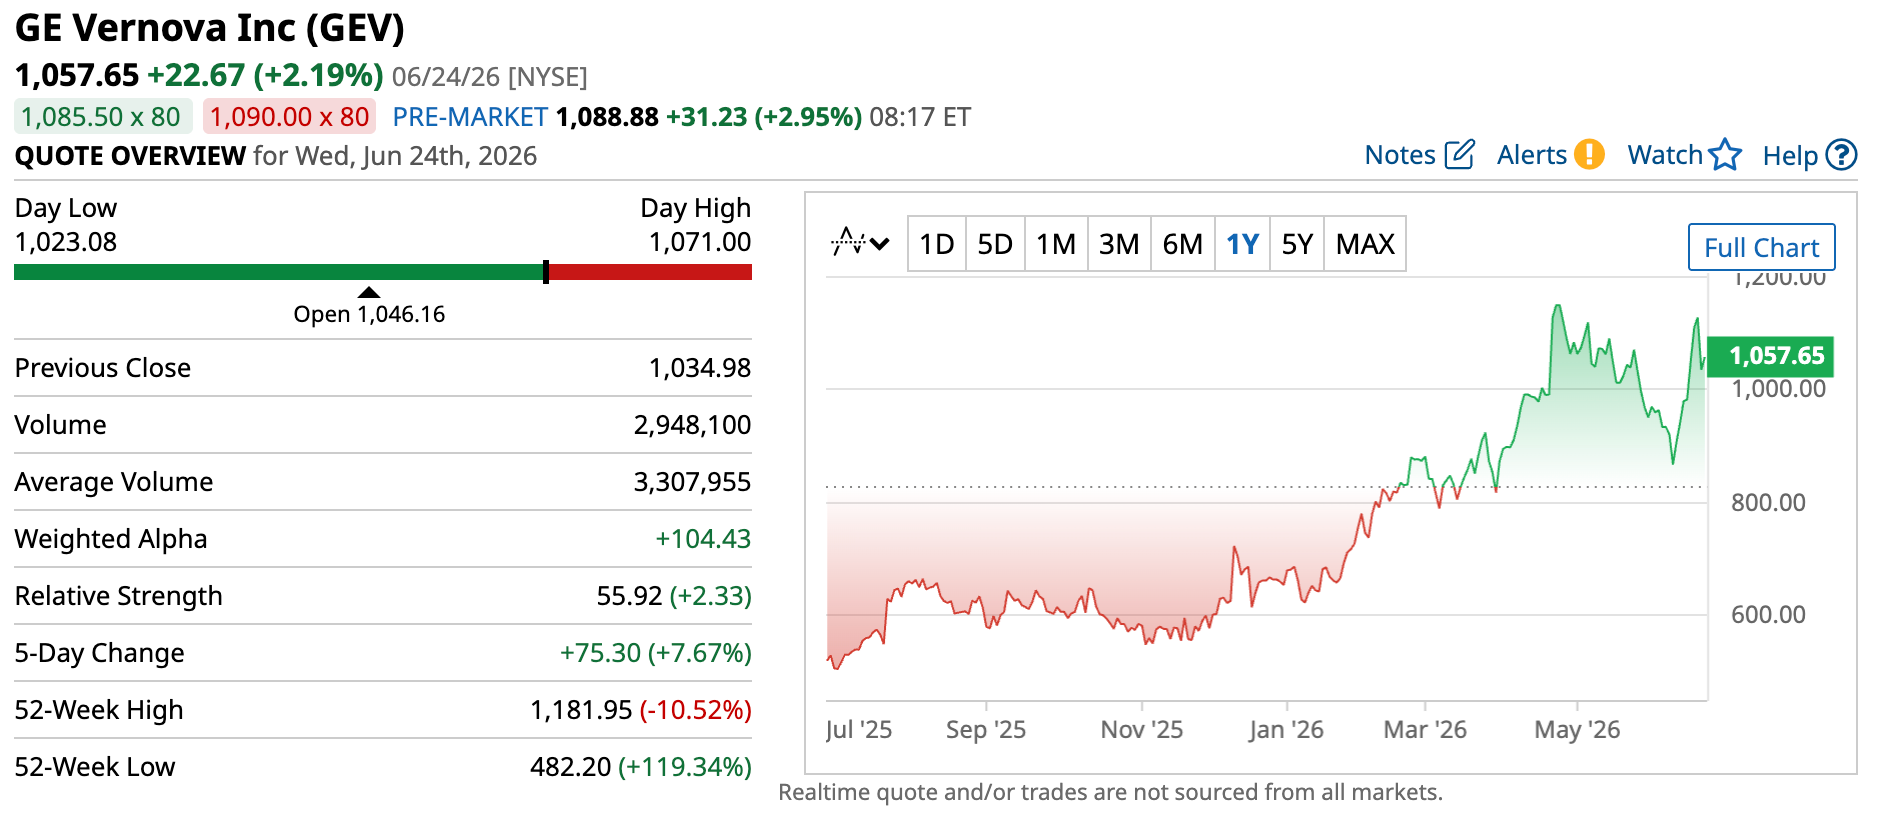
Finally, there’s GE Vernova (GEV), representing a different but equally critical layer: power-generation equipment itself.
GEV is the blue-chip spinoff champ.
GE Vernova makes gas turbines, renewable energy systems, and grid-scale electrification infrastructure. While companies like Constellation and Talen generate electricity, GE Vernova often supplies the equipment that makes it possible.
Increasing AI demand results in more power demand, and if the producers don’t have the existing facilities to cover that demand – well, then, they’re going to need to expand. That means GE Vernova directly benefits from increased AI power requirements. Here are a few examples.
Last year, GE Vernova partnered with Crusoe, a vertically integrated AI infrastructure provider, to deliver 29 new gas turbines to its data centers. This combined deployment is expected to support up to 1 gigawatt of electricity production. They also partnered with Amazon Web Services, Inc. to offer a broad range of energy solutions covering electrification systems, renewables, and power generation services all to support global data center expansion.
And I wouldn’t want to suggest that the client base is limited to hyperscalers. GE Vernova is one of the most dominant and important energy infrastructure players in the world, so naturally, the deals go beyond AI. Companies like Duke Energy (DUK) and Chevron (CVX) all have existing deals with GE Vernova. The company is also a key player in national energy expansion initiatives, such as the one in Saudi Arabia, which is estimated to reach up to $14.2 billion over its lifetime.
The risks of investing in AI power stocks
Overall, the AI data center build-out is extremely beneficial to all links of the energy value chain. But there are risks that investors need to grapple with. Some of them aren’t even theoretical; they’re here, and they’re looming. The only thing we don’t know is when exactly they will make landfall.
The first risk is the cycle
The first and arguably the most critical risk is cyclicality. Right now, the world’s largest companies are shelling out billions to each support their own AI initiatives. Microsoft, Amazon, Alphabet, and Meta have already committed to increasing their capex explicitly to expand their data centers and other AI infrastructure. They want better LLMs, features, functionality, and narratives for their shareholder presentations.
The race, as they say, is on. But how long will the run last? Because let’s face it: even though it seems like hyperscalers have bottomless wells of money, they will eventually hit bedrock with increasing and sustained AI expenditure. One of these days, they will have to slow down spending. And once they do, power will be one of the cut-off points.
That means less demand for equipment, power generation, infrastructure, system solutions, and all the rest.
By the way, this isn’t me reading tea leaves for the AI power industry. There’s a historical precedent here. Capital-intensive industries have always been cyclical. Cycles may expand for years or even decades, but a downturn is always inevitable. We saw it with telecom, oil and gas, the first nuclear buildout cycle, and other emerging sectors during their times.
Too hot, too cold, never just right
Investors also need to keep an eye on signs of under- and overbuilding. The power sector is notoriously sensitive to such risks, due to the long lead times for buildouts across, well, every link in the value chain.
Turbines, transformers, and nuclear power plants don’t magically appear whenever a hyperscaler wants them to. They could take years to manufacture – even longer if the infrastructure to build them isn’t in place yet – which leads to a nice little two-sided risk for both the manufacturer and the client.
Too much demand and too little infrastructure? Those are underbuilds. The logical fix for that is to expand.
But what if demand fizzles out?
That same expanded infrastructure that was so critical to meet demand a few years before is now sitting idle, collecting dust.
In short, overbuilds.
Two sides of the same coin.
The last risk is concentration
And finally, one of the biggest risks of AI power is in the name itself.
Artificial intelligence.
One sector. One market. One group of customers pay all the bills.
That’s the reality today behind the AI boom. I know it might sound like I’m scratching my nails against a chalkboard by repeating the same few names, but be that it as it may, Microsoft, Amazon, Google, and Meta are among the biggest and most aggressive spenders right now. Every decision they make trickles down the AI value chain, including power.
So, if even one of those tech giants decides to slow down, delay projects, or build their own power solutions, the effects could ripple across the sector. Suddenly, utilities find themselves needing less incremental generation capacity. Fewer data centers would need to be connected to the grid. Equipment orders could slow. Infrastructure projects could be deferred.
The bottom line for AI power stocks
What this ultimately comes down to is a shift in where the constraints sit in the AI ecosystem. The early phase was defined by compute scarcity, and that’s when semiconductors took center stage. Then memory became the hot commodity, and RAM manufacturers got their moment in the sun.
But as the buildouts scale, the constraints keep moving downstream, into the physical infrastructure that supports all that compute. Power generation. Transmission. The equipment that makes it all run.
So the next shift in the industry’s center of gravity? It’s heading straight to power. And that’s what makes this so compelling: the companies at these bottlenecks aren’t betting on which chatbot wins or whose model tops the leaderboard. They get paid no matter which name comes out on top, because every one of them needs electricity to compete.
But here’s the part that should excite long-term investors most. Even when the AI spending cycle eventually cools – and it will – the world doesn’t suddenly need less power. Electrification, reshoring, grid modernization, and rising global demand were already pushing this sector higher long before the first hyperscaler signed a PPA. AI didn’t create the power supercycle. It simply poured gasoline on the fire (so to speak).
That’s the rare setup: a theme with a massive near-term catalyst and a durable, decades-long tailwind underneath it. The bottleneck is real, the demand is here, and the companies that deliver the electricity, systems, and infrastructure to run the AI era are positioned to benefit for years to come.
Just remember that market positions and moats can shift, so stay on top of your picks. But if the center of gravity really is moving to power, the opportunity in front of investors right now is hard to ignore.
In mid-2026, the attention of financial markets is focused on the de-escalation of the situation in the Middle East and the race for dominance in the artificial intelligence sector, although at the same time, there is more and more talk about a bubble rather than further development. Parallelly, however, a climatic phenomenon is developing in the equatorial belt of the Pacific Ocean that has the potential to destabilize global supply chains, hit the production of key commodities, and trigger another wave of food inflation. Meteorological data from mid-2026 indicates a rapid transition of the ocean from a neutral phase to an active El Niño.
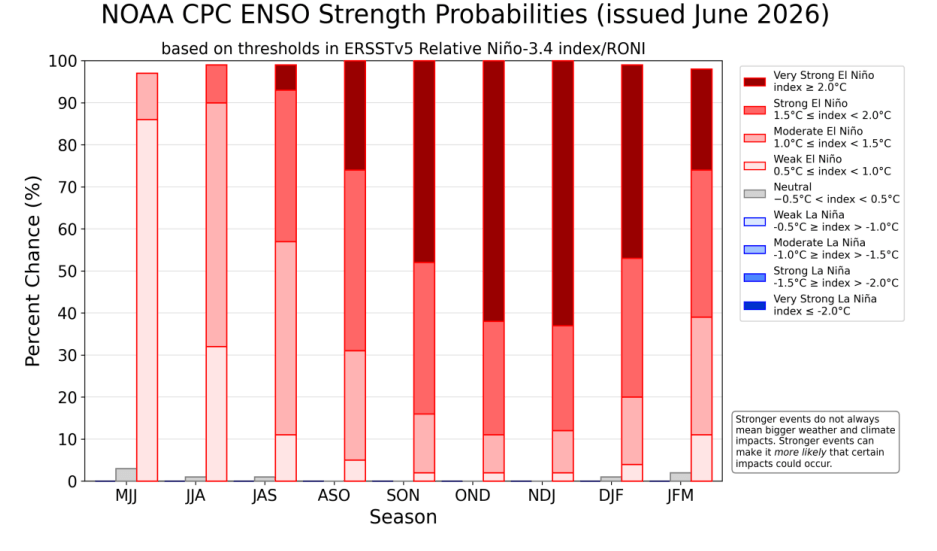
Forecasts from the American Climate Prediction Center (CPC) and the World Meteorological Organization (WMO) set the probability of this phenomenon transforming into a so-called Super El Niño before the end of the year at a level of 60% to 67%. If these forecasts materialize, the upcoming episode from the turn of 2026 and 2027 could become one of the strongest thermal anomalies recorded since 1950. How, then, should one react in market terms?
Graphic representing the height of the Pacific surface, which also coincides with water temperatures. Source: NASA
NOAA predicts over 60% probability of a Super El Niño occurring at the turn of 2026 and 2027. Source: NOAA
Physics and Climatology of ENSO: From Walker Circulation to the Implementation of the RONI IndexNormal Situation
Understanding the economic mechanism of El Niño requires an analysis of the physical processes occurring in the atmosphere and hydrosphere of the Pacific. Under neutral conditions, constant winds, called trade winds, blow from east to west, pushing sun-warmed surface waters toward Southeast Asia and Indonesia. This causes a physical accumulation of water off the coast of Asia, where the sea level is about 0.5 meters higher than off the coast of South America. Simultaneously, intense upwelling occurs off the coast of Peru and Ecuador, which is the rising of cold, oxygen- and nutrient-rich waters from the ocean floor, fueling local ecosystems and allowing for massive fish catches.
El Nino
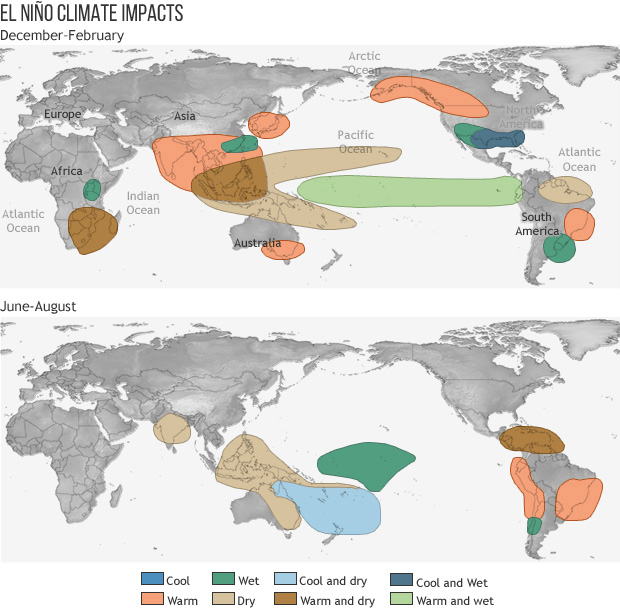
During the El Niño phase, the trade winds weaken, and sometimes even reverse their direction. Warm water accumulated in the west begins to spill back to the east, raising the sea surface temperature off the coast of South America by 1 to even 3 degrees Celsius, although most often 2 degrees are already treated as a very serious disturbance to the entire ecosystem. This process completely flattens the thermocline and blocks the pushing of cold water to the surface. The resulting giant “heater” releases thermal energy into the atmosphere, which disrupts the Walker circulation, shifts storm tracks, triggers heavy rains in South America, and catastrophic droughts in Asia and Australia, partially also affecting the situation across the globe, including Africa, which is key in the case of cocoa crops.
Weather conditions during El Niño. Source: NOAA
How to measure El Niño?
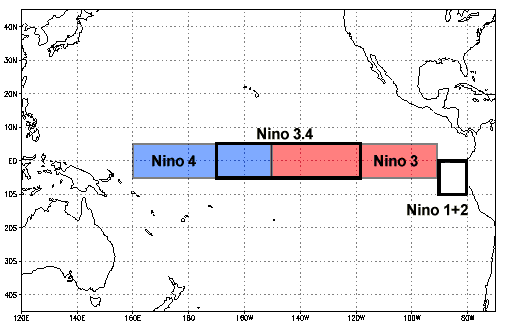
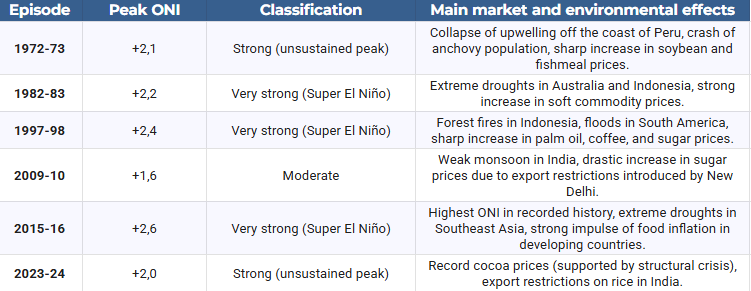
The traditional tool used to measure the strength of ENSO is the ONI (Oceanic Niño Index), calculated as a three-month moving average of sea surface temperature (SST) anomalies in the key Niño 3.4 region. A threshold of +0.5 signifies the formal occurrence of El Niño, a threshold of +1.5 defines a strong episode, and from the value of +2.0, the very strong zone begins, i.e., Super El Niño.
Key location where the El Niño phenomenon forms. Source: NOAA
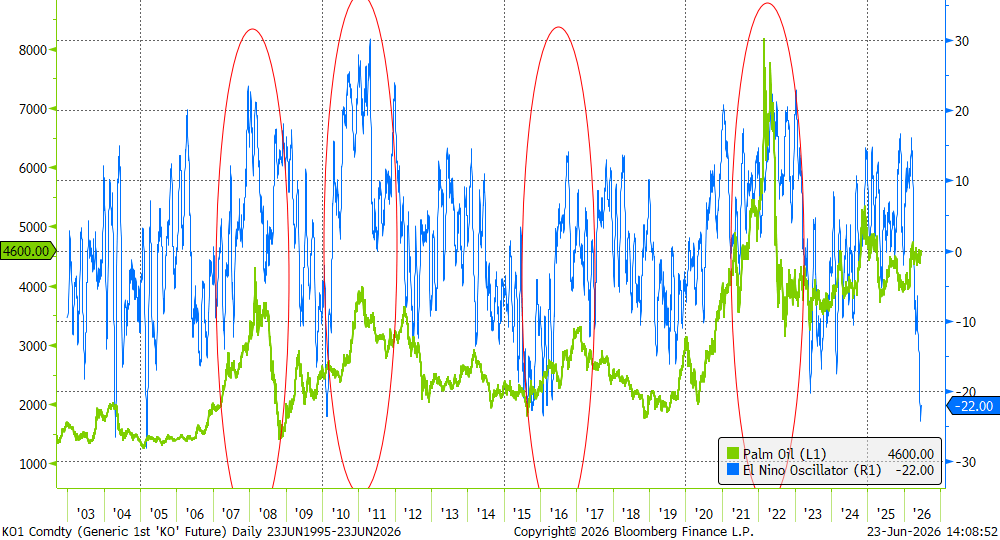
El Niño Oscillator index and palm oil prices. As can be seen, the index is currently clearly negative, indicating the absence of the phenomenon. However, this is usually a prelude to a later, stronger hit. Source: Bloomberg Finance LP Modern global warming significantly complicates the interpretation of ONI results. Record hot oceans worldwide mean that traditional indicators give misleading, inflated readings.
For example, the episode from 2023–2024 peaked according to the old methodology at +2.0, but due to a lack of stability in the anomaly, it was classified only as “strong.” For this reason, meteorological agencies in Australia (BOM), the USA (NOAA), and New Zealand implemented a new indicator – RONI (Relative Oceanic Niño Index). This index dynamically filters out the general planetary warming trend from the real, cyclic anomaly of the Pacific. It is RONI that confirms in mid-2026 that the approaching phenomenon is developing extremely fast, moving from a neutral phase into a strong strike. For comparison purposes, the table below presents the classification of historical episodes according to their maximum intensity measured by the ONI index.
Source: own study based on NOAA
Impact on GDP and the Role of the “Conflict Multiplier”
The relationship between climate physics and financial markets has been precisely described in economic research, including those published by the European Central Bank (ECB). A strong El Niño phenomenon raises global prices for non-energy commodities (agricultural goods and metals) by an average of about 5%. Crucially for monetary policy, this effect persists in markets for 6 to even 16 months after the weather shock itself. This anomaly does not affect all economies in the same way, creating drastic discrepancies in GDP dynamics:
Indonesia: Records an average GDP drop of 1% due to paralyzing droughts destroying agriculture and limiting coal and nickel mining.
United States: Gains about 0.5% of GDP (which translates to over 150 billion dollars) thanks to milder winters in the north and more favorable rainfall in the agricultural belt in the south (lower gas consumption, higher yields).
Thailand: May record a GDP growth of almost 1%, provided there is appropriate water resource management in agriculture.
On a global scale, the balance is decidedly negative. Losses resulting from lost productivity were estimated at nearly 5.7 trillion dollars for the 1997–1998 episode and over 7.8 trillion dollars for the phenomenon of 2015–2016. In mid-2026, the global economy is exceptionally vulnerable to these types of shocks due to elevated core inflation, shipping restrictions, and energy costs driven up by a previous conflict in Iran. The USDA forecasts a 4.7% increase in food prices in the USA in 2026, and for products based on sugar and cocoa, it indicates an increase of up to 8.4%. For this reason, the FAO and WFP launched a joint appeal for 202 million dollars for preventive actions in 22 priority countries.
Parallelly, drought caused by El Niño acts as a factor creating conflict. Model studies conducted by Bloomberg Economics indicate that a drastic drop in rainfall and loss of income from agriculture exacerbate competition for shrinking natural resources. Countries with low GDP per capita, high corruption, and weak institutions are particularly sensitive to this mechanism. Myanmar, Pakistan, and Nigeria are identified as countries with the highest risk of outbreaks or escalation of internal conflict in 2026. Conversely, in Latin America (Mexico, Colombia, Brazil), a prolonged lack of rainfall could overlap with existing tensions and escalate violence from drug cartels controlling water resources and rural territories.
El Niño and Key Soft Commodity Markets: Coffee and Cocoa
The coffee and cocoa markets are considered litmus tests for the strength of El Niño due to the geographical concentration of crops in the equatorial zone. In the years 2026–2027, this phenomenon overlaps with previous structural shortages, triggering powerful reshuffles in the pricing of futures contracts.
Cocoa: Threat to Main Harvests in West Africa and Disease Crisis in Ecuador
A popular market narrative assumes the simplification that El Niño means drought in West Africa, which will translate into an uncontrolled increase in cocoa prices. The reality, however, is more complex because the direct ENSO climate signal for Côte d’Ivoire and Ghana (accounting for nearly 60% of global supply) is weaker than for Asia. The historical price record from 2023–2024 resulted mainly from structural problems: a fertilizer crisis caused by war, a lack of investment in tree rejuvenation, and destructive Harmattan winds. In the second half of 2026, markets fear the superimposition of these structural weaknesses on weather anomalies. Three factors determine the current, pro-growth positioning of capital:
Weak fruit setting: Early surveys on plantations in West Africa point to extremely low setting of young fruits (cherelles) for the 2026/2027 season, which heralds poor main harvests starting in October.
Revision of the commodity balance: StoneX drastically cut its global cocoa surplus forecast for the 2026/2027 season to just 149,000 tons (compared to an estimated 267,000 tons in January). Conversely, Citigroup predicts a deep deficit of 56,000 tons in the 2026/2027 season. On the other hand, forecasts appeared that the current season might end with an oversupply as high as 400,000 tons, mainly due to weak demand.
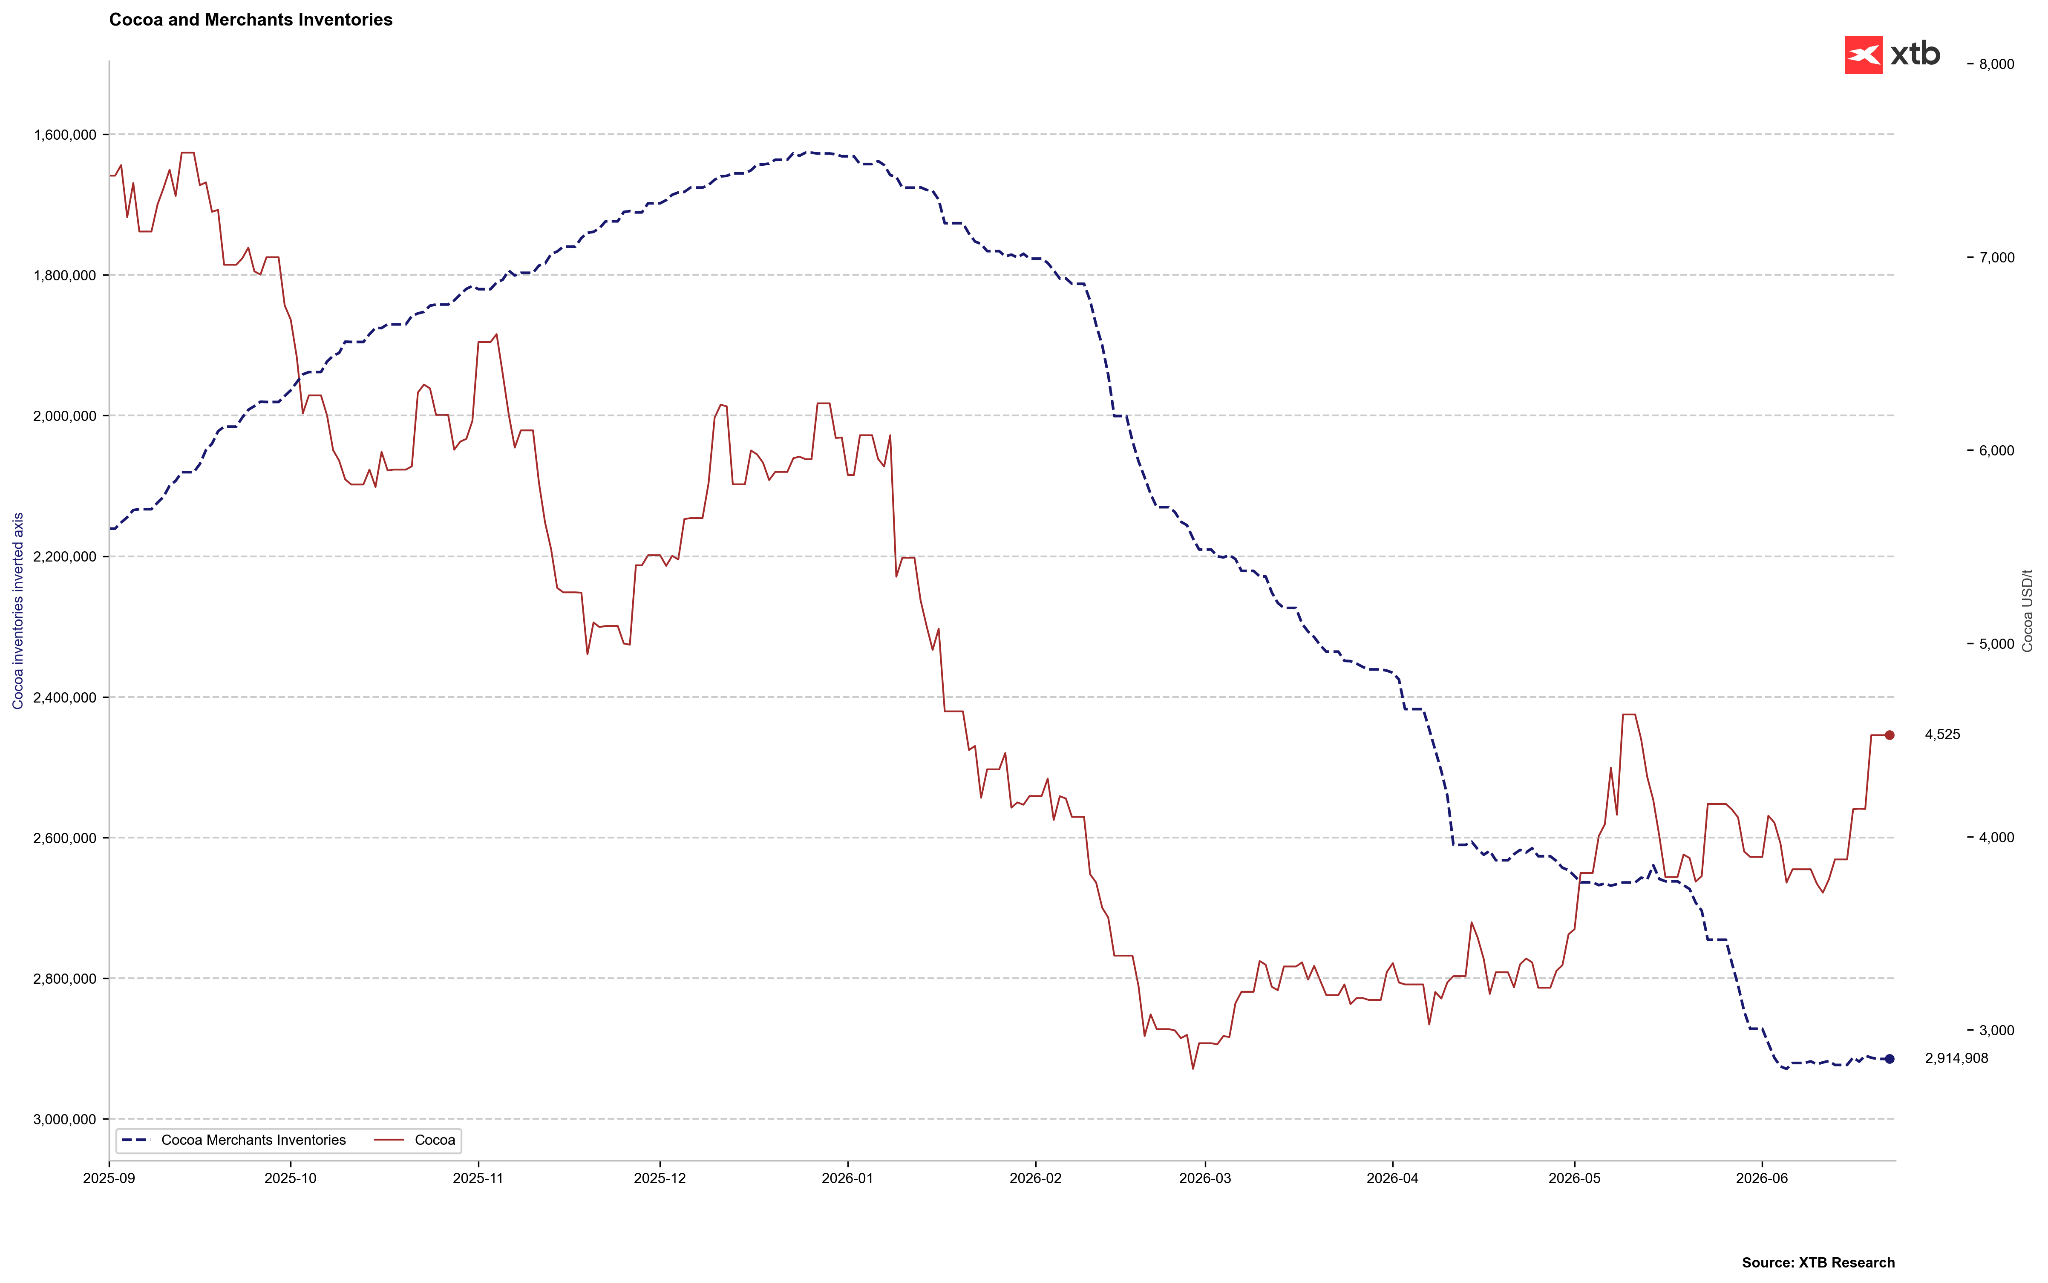
Demand destruction as a brake: A bearish counterweight is the high ICE-certified stocks (reaching nearly 2.9 million bags in June 2026) and a clear drop in cocoa processing (grinding) in Europe (down 7.8% year-on-year in the first quarter of 2026 – the lowest reading in 17 years) and North America (down 3.8% year-on-year).
Cocoa stocks are at their highest in several years, though it is worth remembering that in 2023-2024 there was a massive contraction in stocks. We are now theoretically at the seasonal peak. If stocks start to grow, however, it could mean the scale of oversupply is larger than expected. Source: Bloomberg Finance LP, XTB
Despite weakening demand in developed countries, Citigroup predicts that due to Super El Niño, cocoa prices will permanently exceed the level of 5,000 dollars per ton in the next three months, with the potential to reach 6,000 dollars per ton on a 12-month horizon. An additional catalyst for increases is the situation in Ecuador (the world’s third-largest producer). El Niño brings heavy rains and floods there. Extreme humidity in the period from December 2026 to February 2027 creates ideal conditions for the spread of fungal diseases (such as moniliasis or black pod rot), which directly destroys crops and prevents traditional sun-drying of harvested beans. Ecuador recently aspired to second place in terms of production, but due to its own problems, it will likely remain in third place, just behind Ghana.
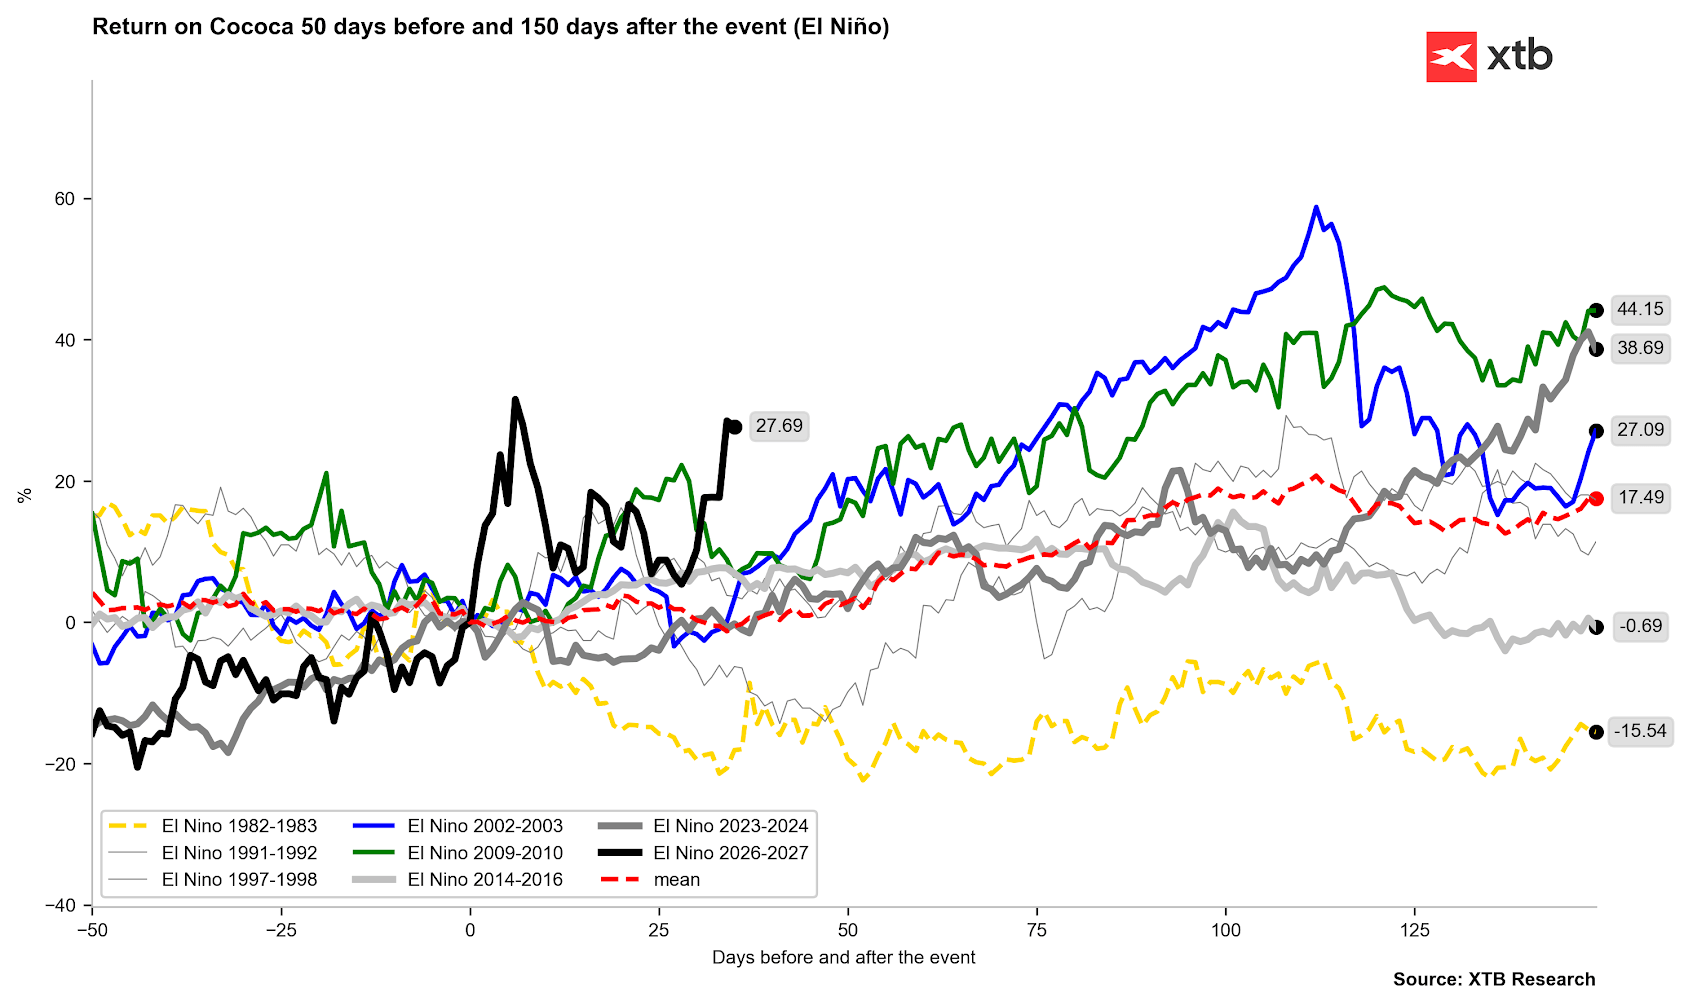
Most El Niño periods ended with clear price increases. What’s more, the impact of El Niño from 2023 still reached strongly into 2024. Source: Bloomberg Finance LP, XTB
Coffee: Extreme Drought for Robusta and Vegetative Anomalies for Arabica
In the coffee market, the El Niño phenomenon triggers starkly different reactions depending on the species and growing region:
Robusta (Vietnam, Indonesia): Southeast Asia accounts for about 50% of global Robusta production. El Niño brings extreme heatwaves and droughts to these areas, which drastically lowers yields. Although Vietnamese exports in the period of January-May 2026 increased by 7.9% year-on-year, the upcoming lack of rainfall creates a high risk of a drastic supply shortage in the next several months, which is already pushing Robusta futures contracts to multi-month highs.
Arabica (Brazil): El Niño initially brings excessive rains in Brazil. In the short term, this complicates and delays harvesting (by mid-June 2026, only 15.8% of crops were harvested compared to 26.6% in the same period of 2024). Although the USDA forecasts record Brazilian harvests at 71.9 million bags (up 14% year-on-year), rains deteriorate the quality of harvested beans and stimulate premature flowering of coffee trees before the harvest is complete, which threatens bud dropping and damage to production potential for the 2027/2028 season. There is also a high risk that heavy rains will give way to a severe drought in key growing regions in September and October 2026, which will prevent proper flowering and trigger a sharp rise in Arabica prices.
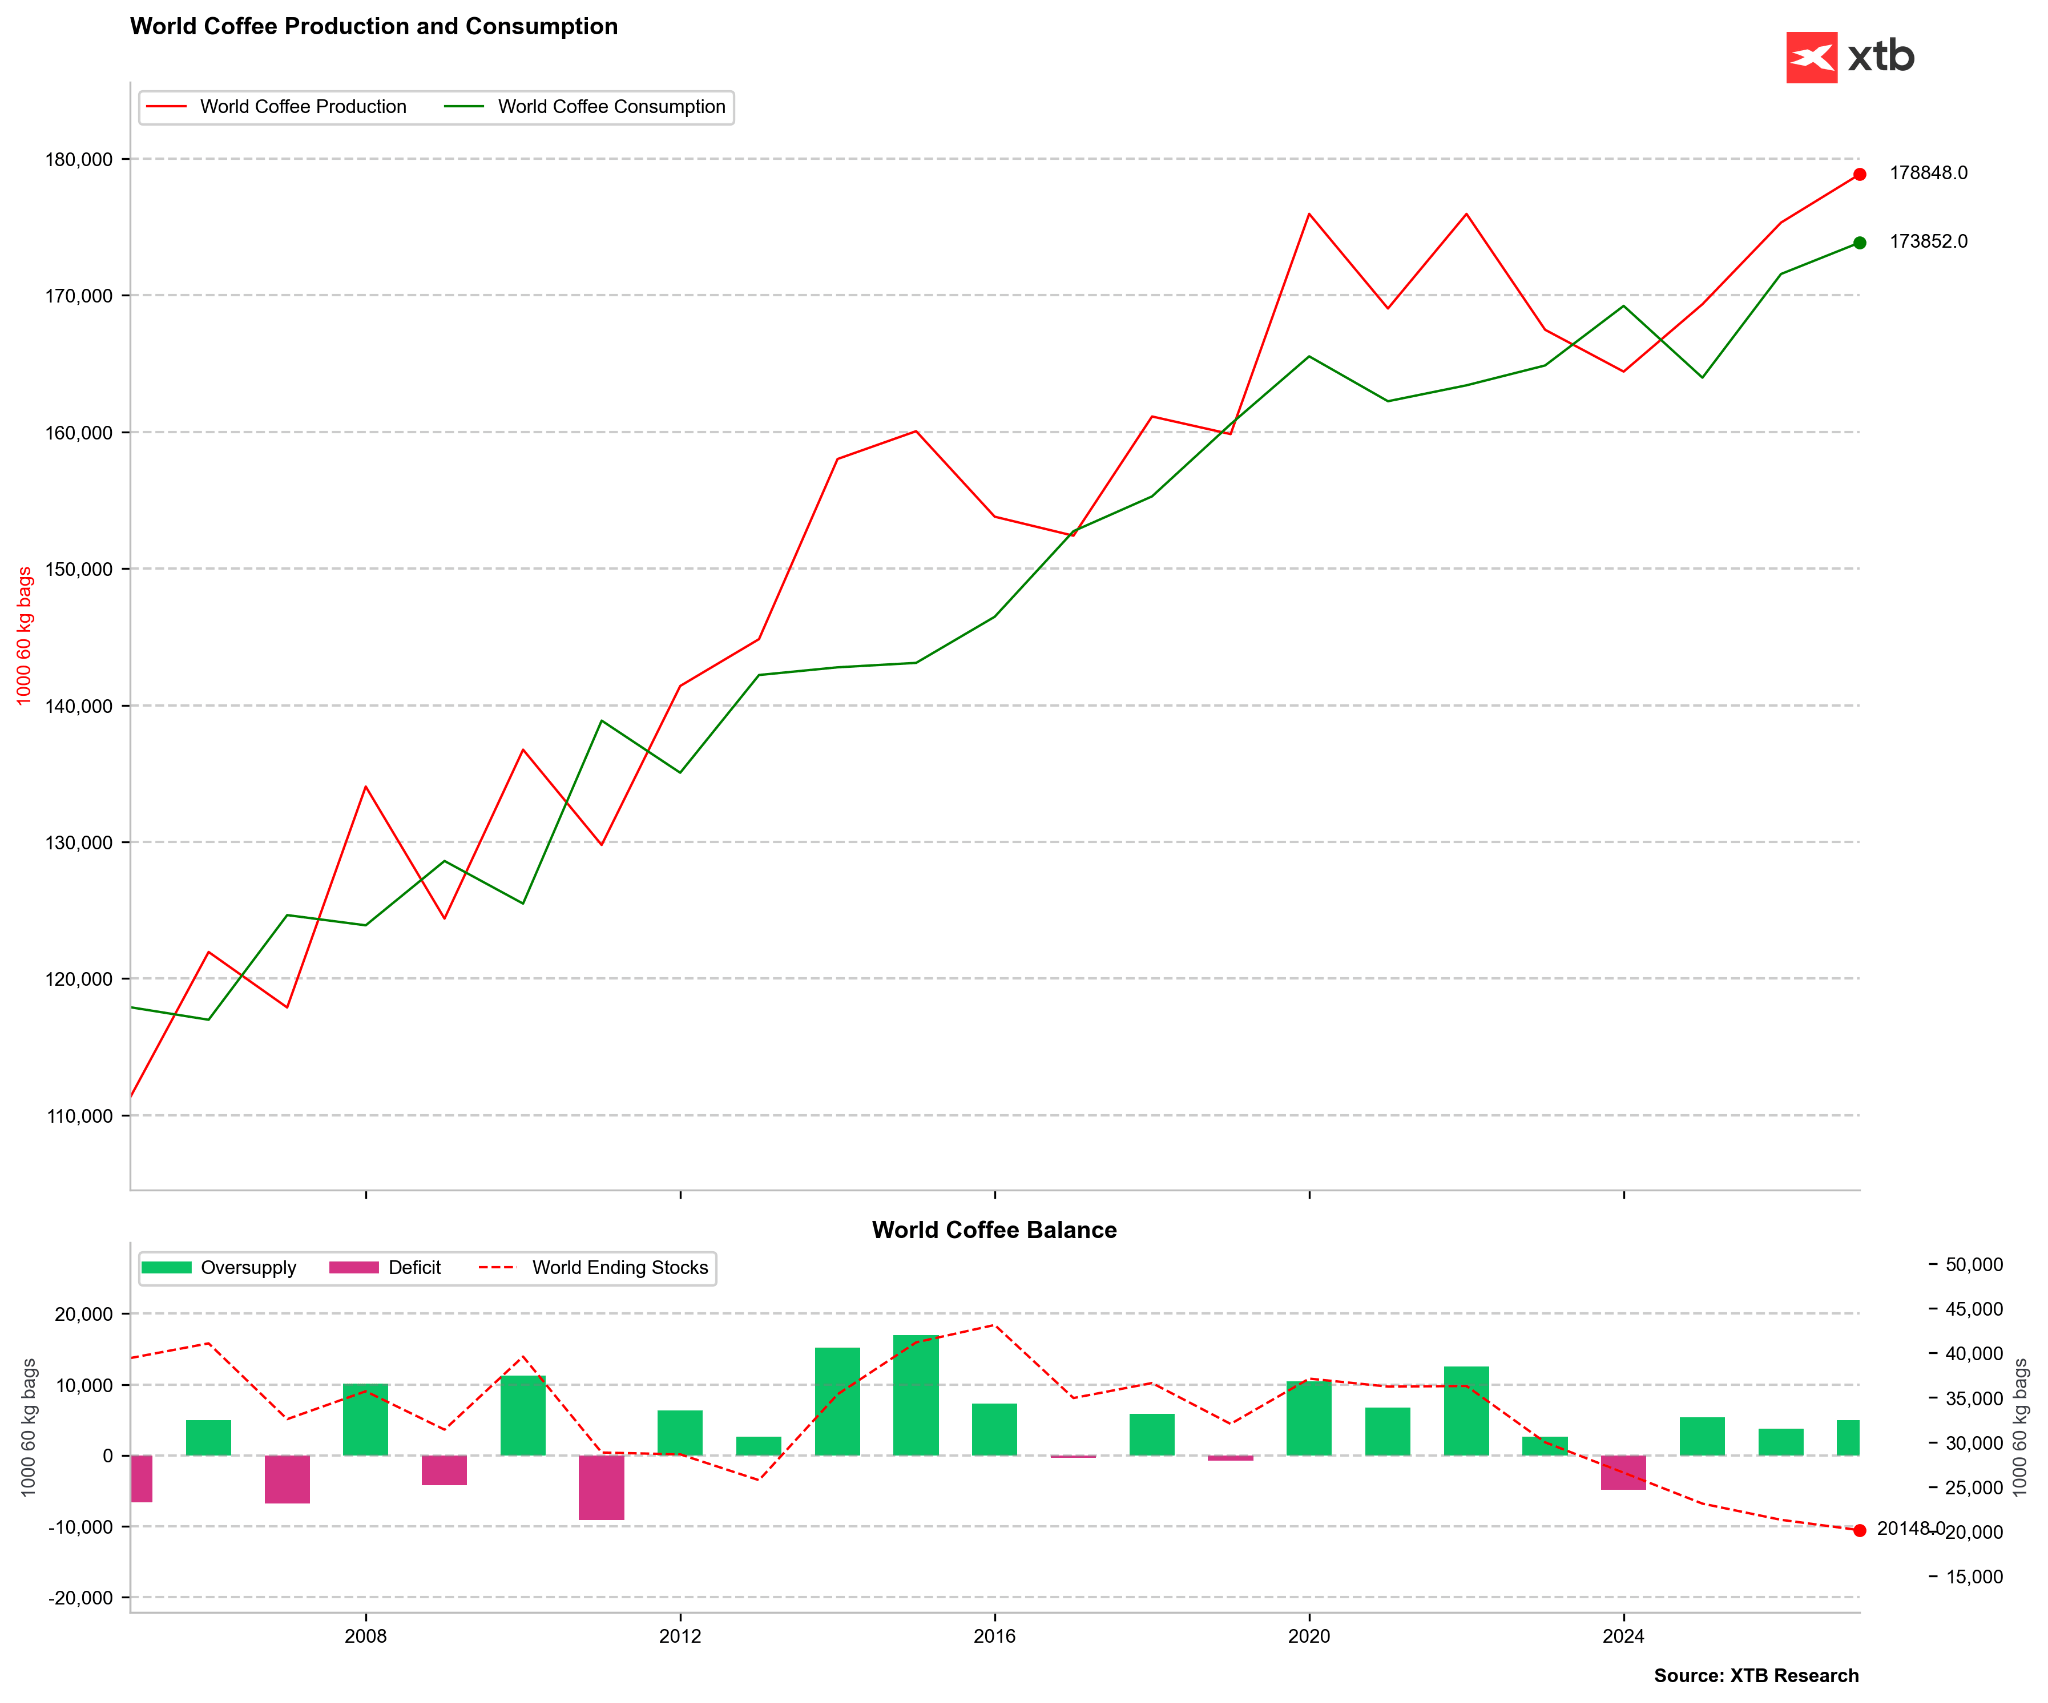
USDA data for several years has shown an oversupply, but this does not always coincide with the narrative from other institutions, particularly the Brazilian CONAB. Source: Bloomberg Finance LP
Market Paradoxes and Energy-Industrial Commodities
The impact of El Niño on commodity markets abounds in anomalies that defy the intuition of inexperienced market participants:
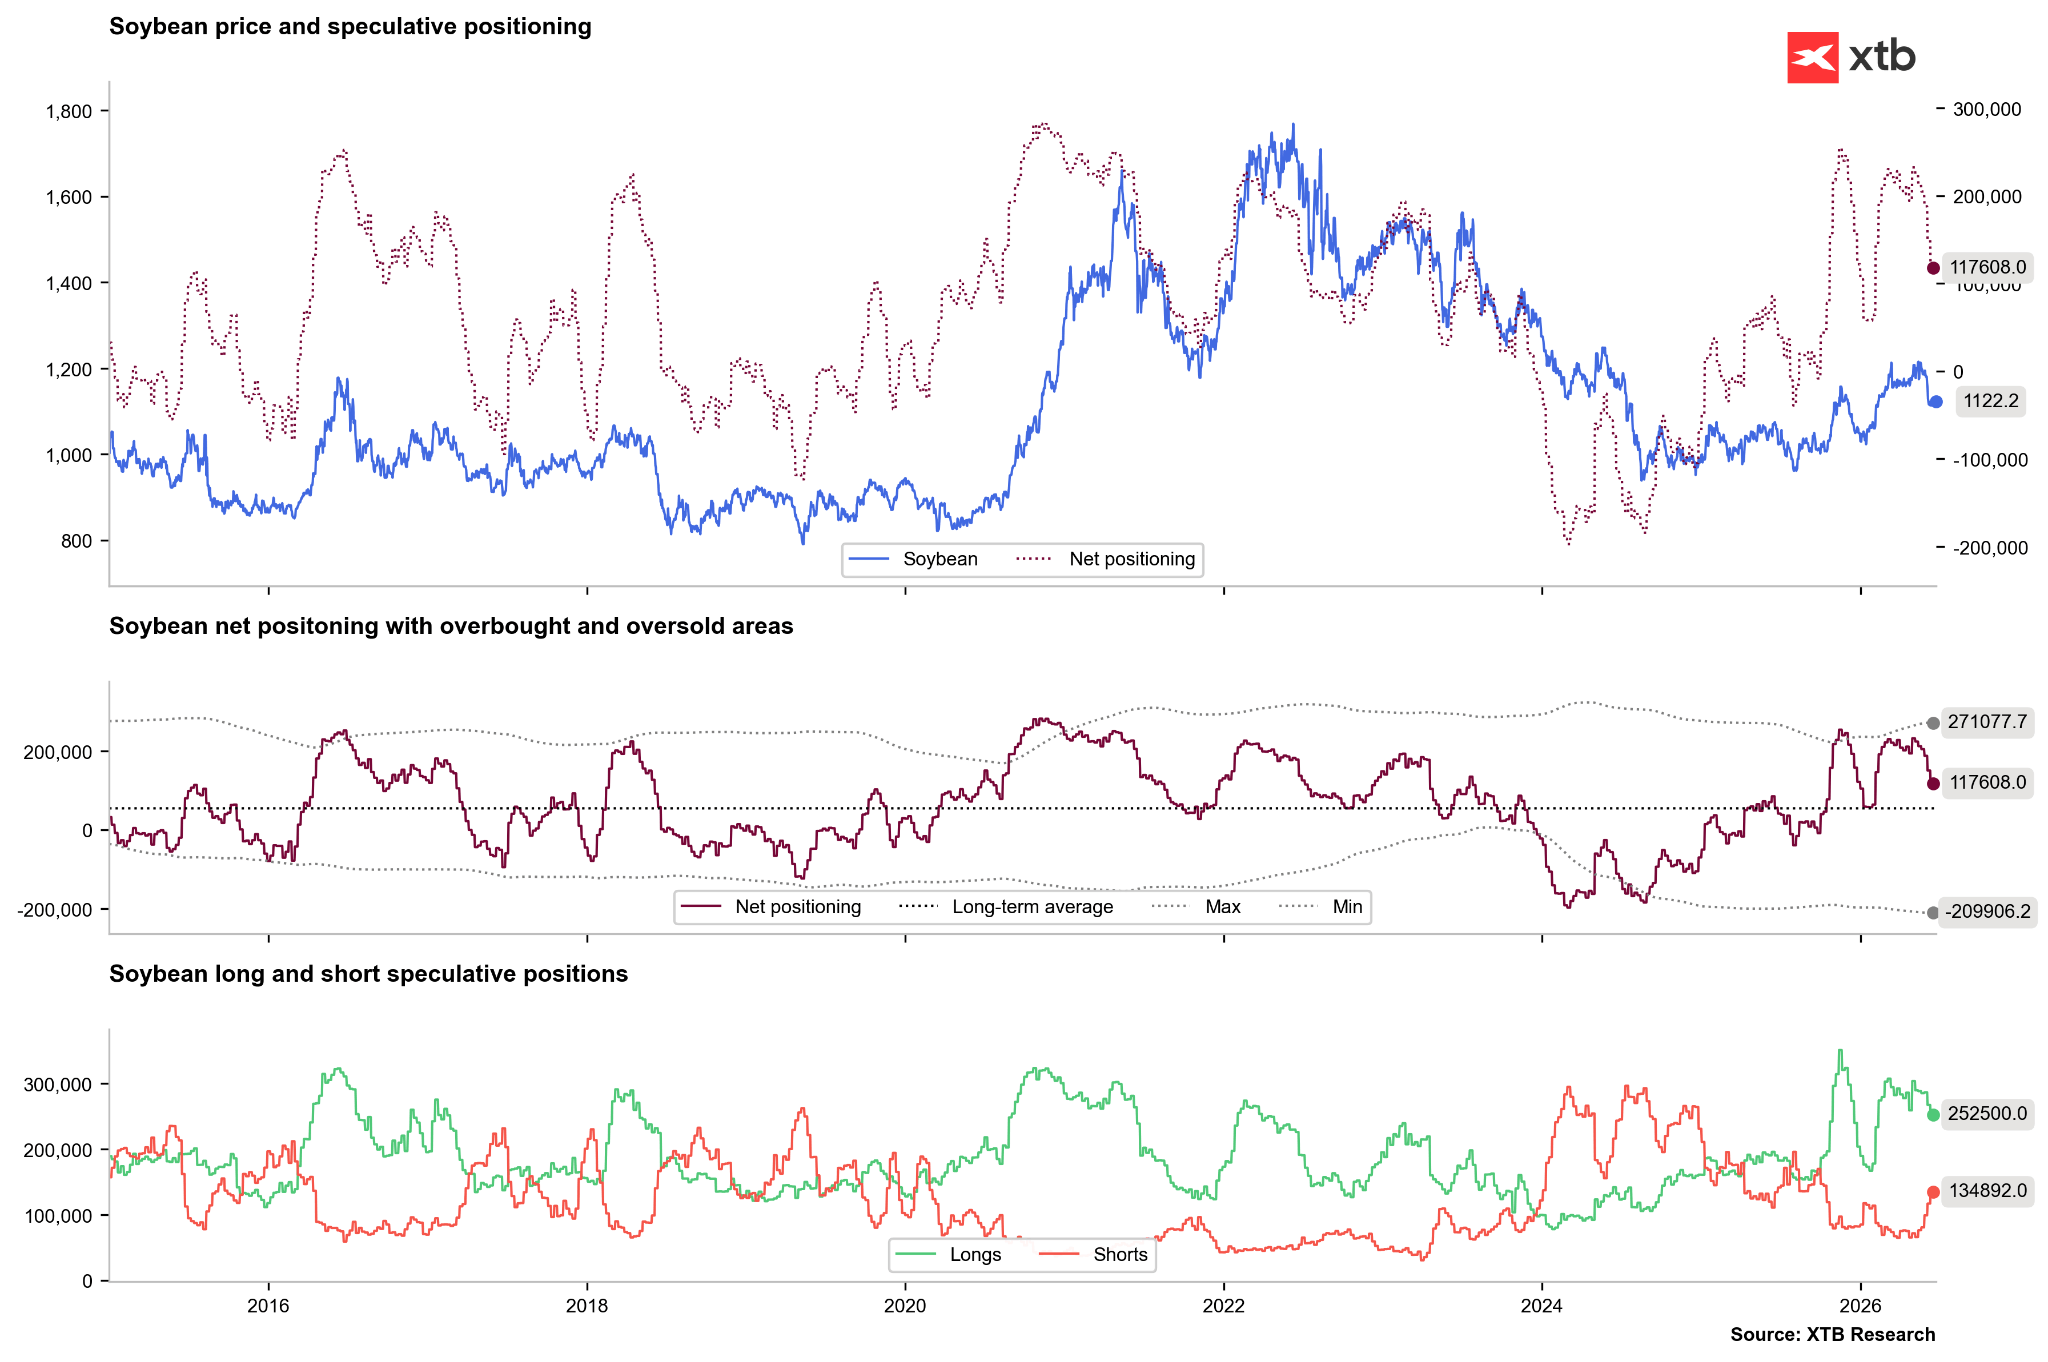
Soybeans as a beneficiary of rainfall: While most crops are destroyed, soybeans are a structural beneficiary of El Niño. This phenomenon brings abundant rainfall to the US growing belt, in Argentina, and in southern Brazil. Historically, this translates into yield increases of 10% to 15% above the trend, generating global oversupply and triggering sharp price drops on the Chicago exchanges.
Bearish pressure on American natural gas: El Niño brings milder and warmer winters to the northern United States. This results in a drastic drop in demand for gas for home heating, exerting strong downward pressure on the commodity’s price (bear market) in the USA, which stands in contradiction to the general trend of rising commodity prices.
Hydroelectric crisis in China: Chinese electricity demand in 2026 is growing by 5% year-on-year, driven by the development of AI data centers and EV charging. The drought caused by El Niño drastically limits production from Chinese hydroelectric plants. Consequently, local governments are forced to substitute hydro energy with coal and gas generation. Beijing issued a categorical decree ordering power plants to rebuild coal stocks to a level covering a minimum of 20 days of consumption, which stimulates price increases for thermal coal.
Copper logistics paralysis in Chile and Peru: South America in copper mining zones experiences heavy rains and floods. This leads to the washing out of transport roads, flooding of mine infrastructure, deficits in local hydro energy, and mudslides. The supply restriction from these two key countries constitutes a strong upward impulse for copper prices on the LME.
Investors are starting to position for a soybean production surplus. The number of longs is clearly being reduced, while the number of shorts is rising. Source: Bloomberg Finance LP, XTB
Guide to Listed Companies: Winners and Losers of Super El Niño
For stock market investors, Super El Niño constitutes a significant capital allocation factor. The following discussion presents companies that may see improvement in financial results, and those that are exposed to serious operational and financial risks.
Fertilizer and Crop Protection Sector
Weather anomalies and falling yields force farmers to intensify fertilization and protection of surviving crops to save revenues, which supports producers of agricultural production inputs.
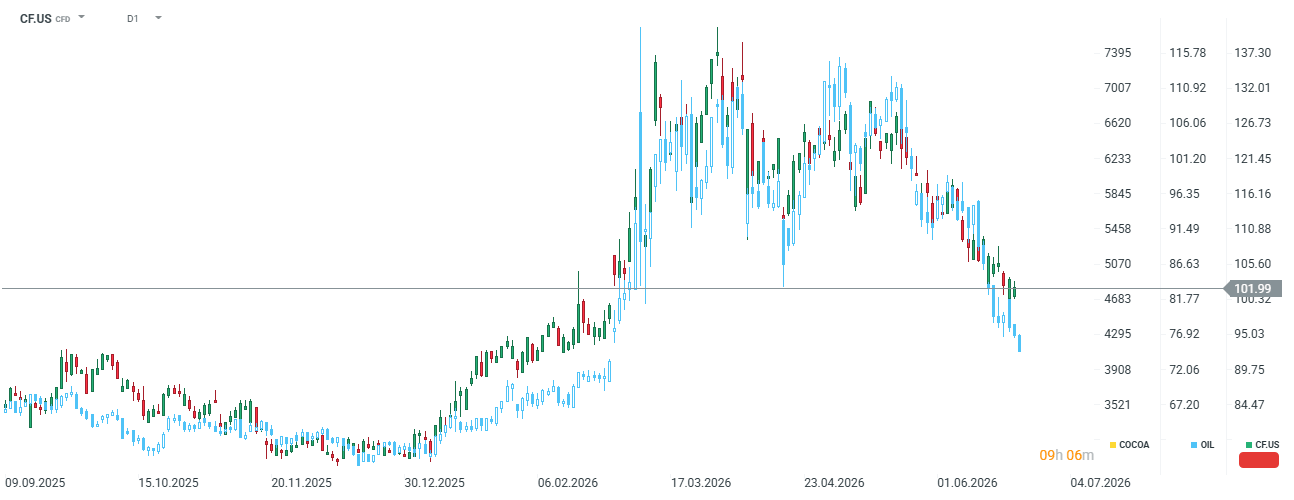
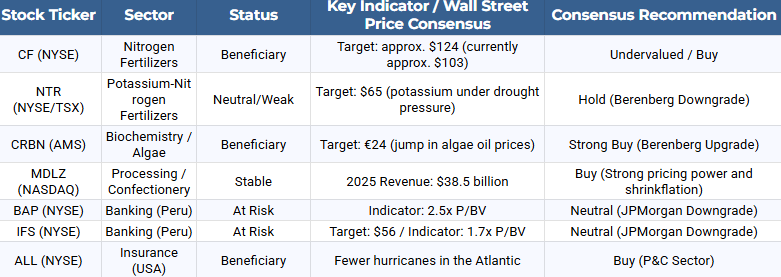
CF Industries Holdings Inc. (CF): The company focuses on nitrogen fertilizers. In mid-2026, its valuation fluctuates around 102 dollars (about 19% below the analyst consensus of 124 dollars). CF Industries benefits from cheap gas in the USA (the main raw material for ammonia production), maintaining a high EBITDA margin while European competitors struggle with more expensive raw materials. An additional long-term factor is the implementation of the 3.7 billion dollar Blue Point project in the low-emission ammonia segment.
The company gained significantly in value during the crisis related to the Strait of Hormuz. It may turn out that fertilizers will again come under upward pressure. Source: xStation5
Nutrien Ltd. (NTR): The company shows a more nuanced risk profile. It has strong nitrogen exposure, but droughts caused by El Niño drastically delay farmer demand for potash, leading Berenberg to downgrade NTR to “Hold” with a target price of 65 dollars. The company offers a stable dividend yield of 3.4%, but its growth potential in 2026 is limited by the fall in potash prices. Currently, shares are trading around 61 USD.
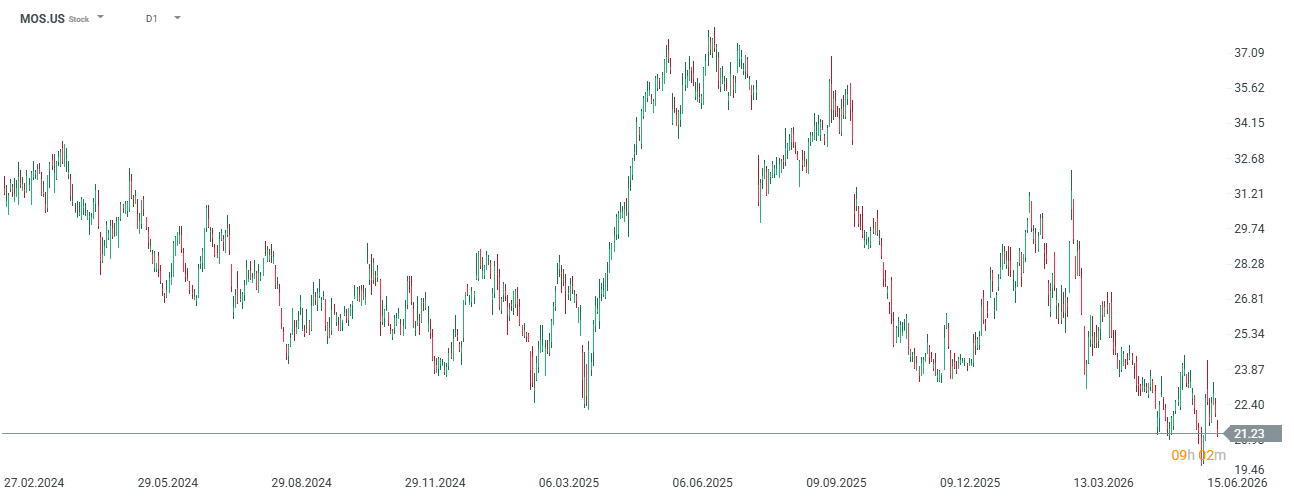
The Mosaic Co. (MOS): The company is heavily dependent on potash sales, which in drought conditions weakening demand for this nutrient puts it in a worse market position. The company is currently at multi-year lows, around 21 USD, but in 2025 it traded as high as 37 USD.
Corteva Inc. (CTVA): As a global provider of advanced seeds and chemical crop protection, it may see revenue growth as farmers pay a premium for drought- and pathogen-resistant biotechnologies.
Biochemical and Aquaculture Sector
Thermal anomalies in the Pacific drastically change the cost structure in global feed and food production.
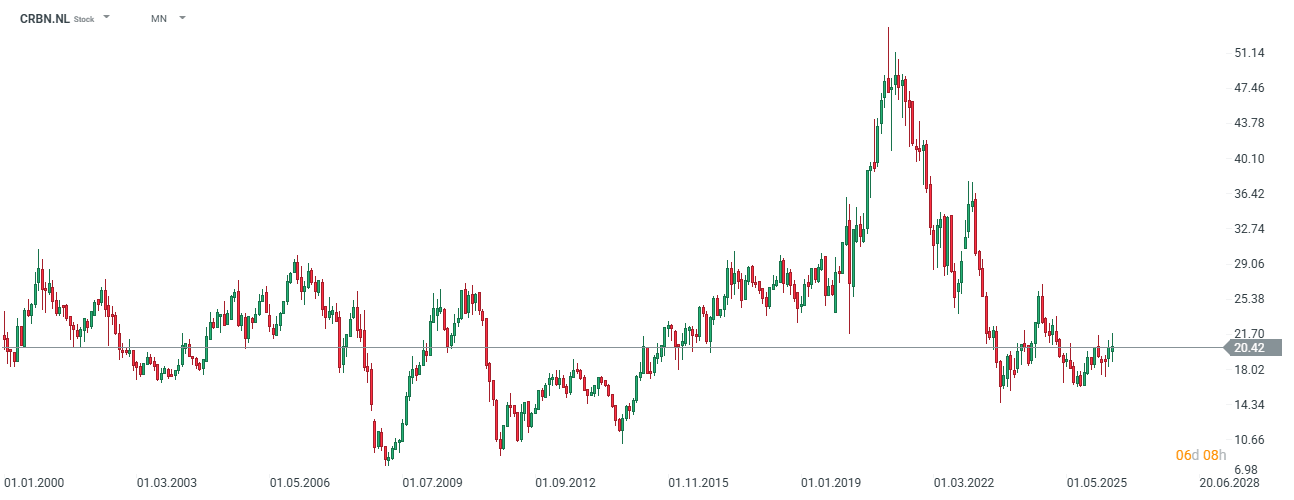
Corbion NV (CRBN.NL): The company is a key winner of the raw material crisis in Peru. The upwelling blockage off the coast of Peru led to a complete halt of anchovy fishing in May 2026. Prices of traditional fish oil (a key ingredient in salmon feeds and dietary supplements) jumped from 3.10 dollars per kilogram in July 2025 to a record 10 dollars per kilogram in June 2026. Corbion is a global leader in industrial production of alternative algae oil rich in Omega-3 fatty acids. The price jump of natural fish oil made Corbion’s product reach price parity, generating powerful demand from feed and baby formula producers. Berenberg raised its recommendation for Corbion to “Buy” with a target price of 24 euros, forecasting EBITDA growth from the algae segment alone to 44 million euros in 2026 and 49 million euros in 2027. The company is also cited as an attractive acquisition target for global players following the planned spin-off of the polylactic acid (PLA) segment.
The company has lost almost 1/3 of its value since the peak in 2020. Source: xStation5
Food Processing and Candy Manufacturer Sector
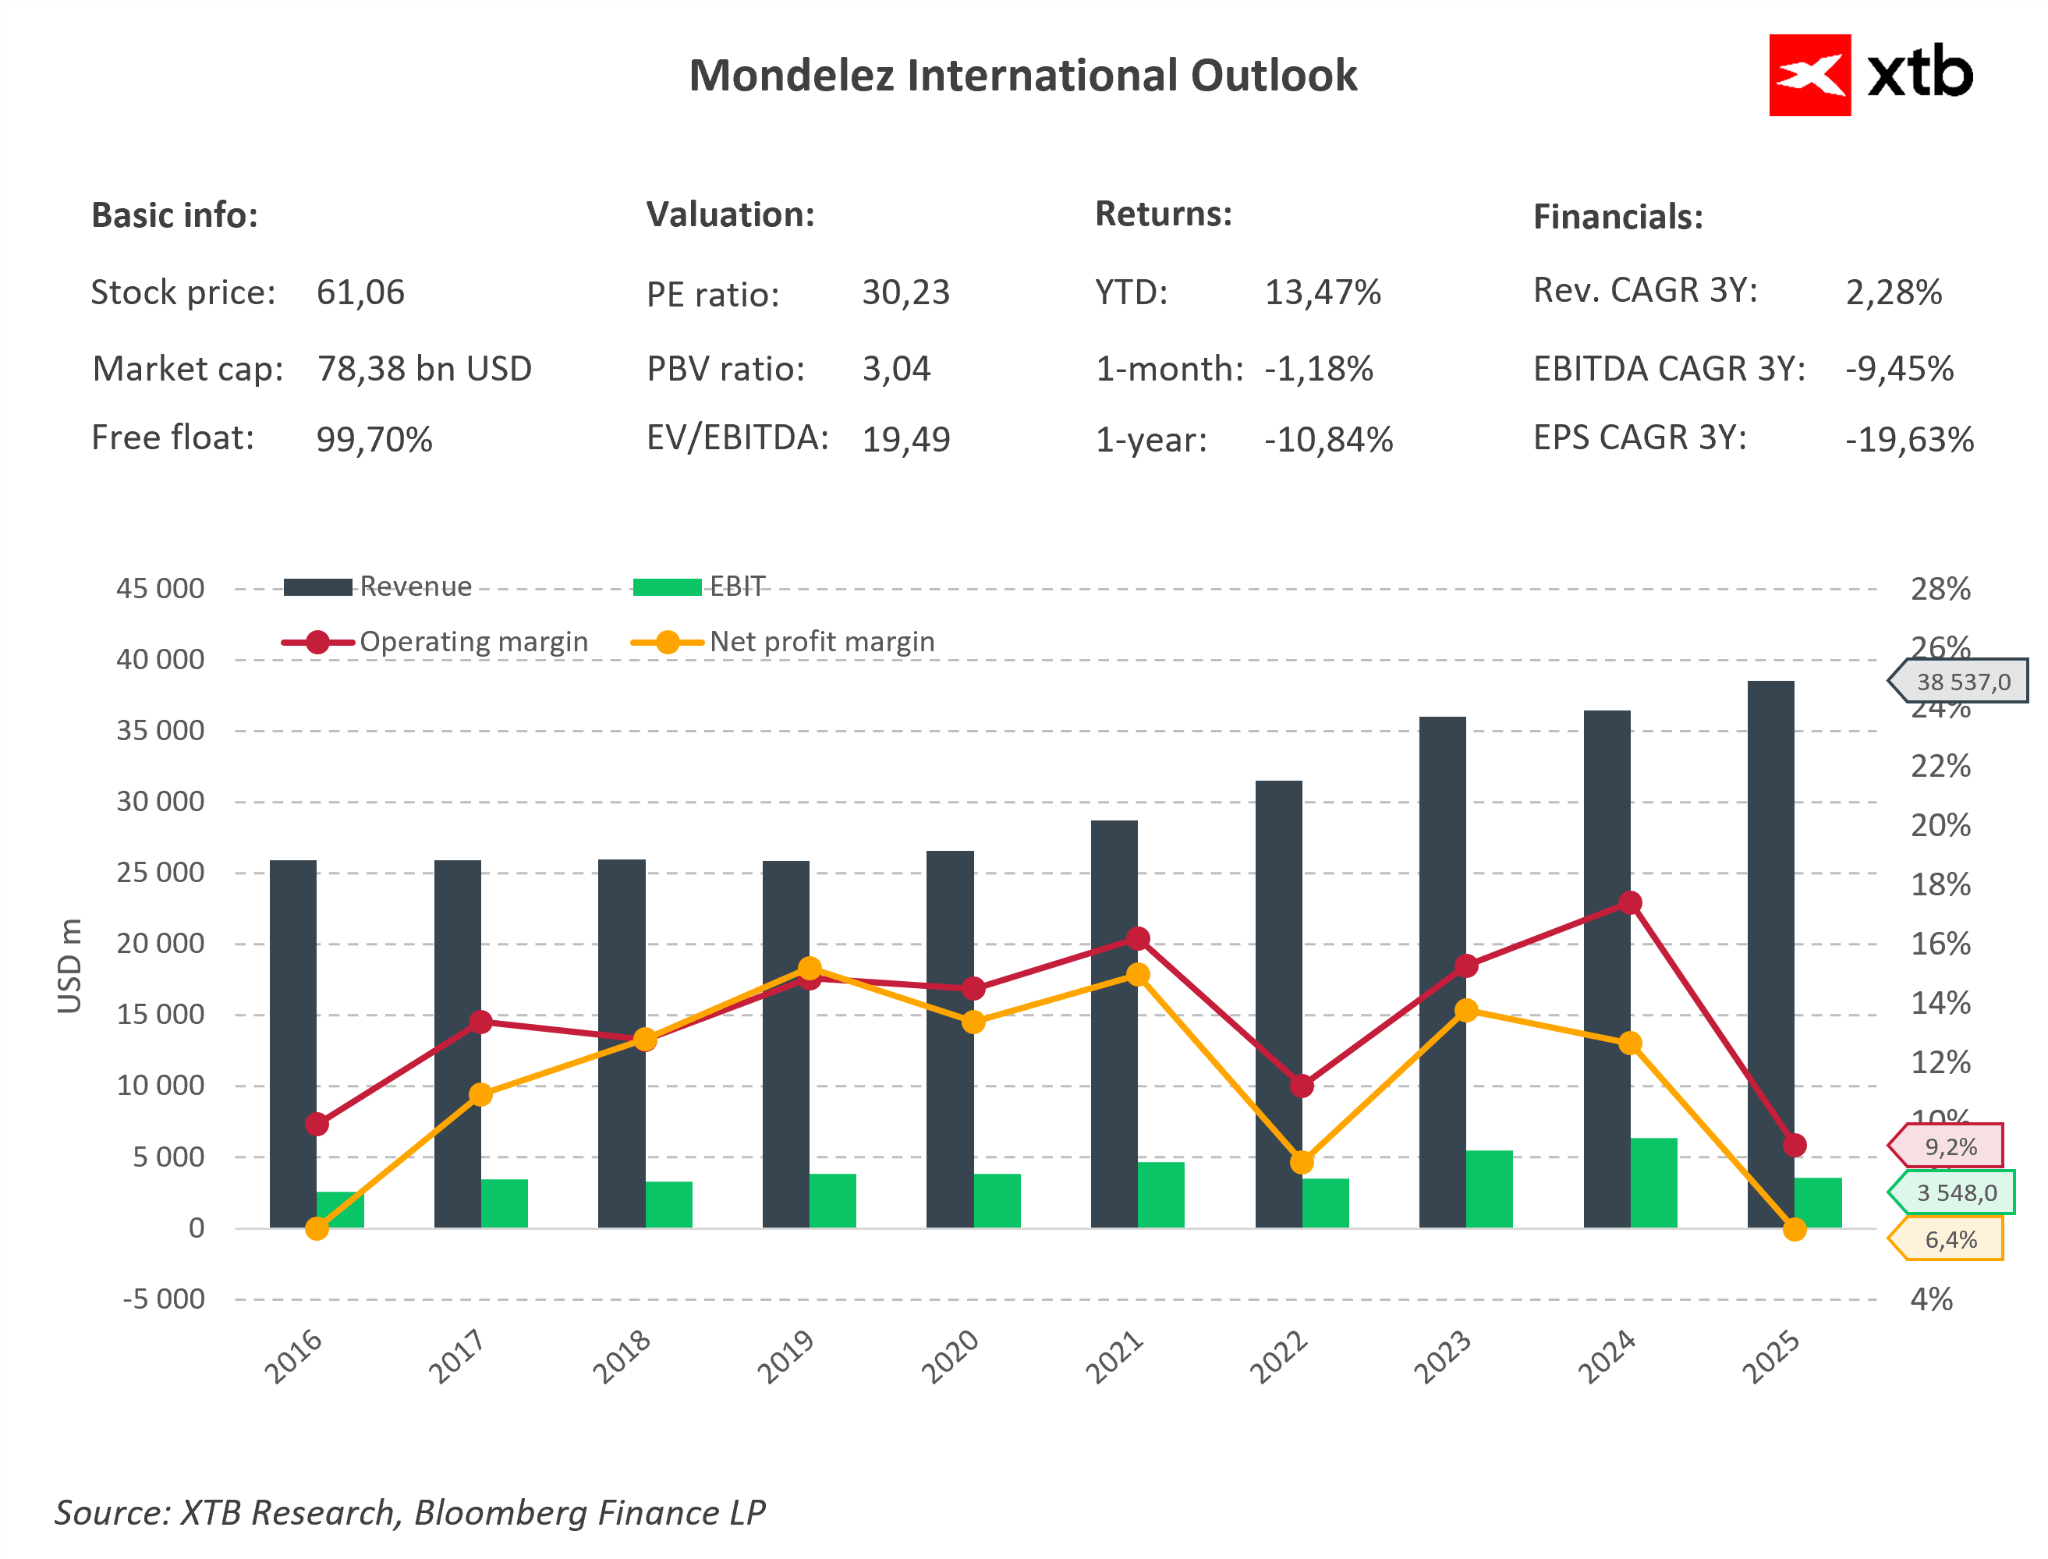
Mondelēz International Inc. (MDLZ): As the owner of brands such as Cadbury, Milka, and Toblerone, the company is one of the largest global consumers of cocoa and sugar. In conditions of raw material crisis caused by El Niño, Mondelez uses a highly effective margin protection strategy through so-called “shrinkflation” (reducing the weight of products while maintaining existing price points) and intense expansion in the premium segment. CEO Dirk Van de Put argues that consumers are more willing to accept a smaller bar than a higher price on the shelf. Additionally, the company invested 65 million CHF in expanding the Toblerone factory in Bern, transforming it into a global Center of Excellence. This strategy allows for maintaining high profitability (in 2025 revenues grew 5.8% y/y to 38.5 billion USD, and net profit reached 2.45 billion USD). Although CFO Luca Zaramella indicates some stabilization and “normalization” of cocoa prices from extreme highs, this raw material remains structurally expensive, meaning Mondelez’s ability to pass costs on to consumers (pricing power) will be a key factor deciding the preservation of margins in the 2026/2027 season.
The company currently has fairly low margins, but due to the situation, there is significant potential for a return to the 2023 situation. Additionally, the company appears to be undervalued currently, looking at a fundamental valuation based on averages from the last 5 years. The company’s shares are more than 20% below historical peaks. Source: Bloomberg Finance LP, XTB
Insurance and Financial Sector
Shifts in jet streams caused by El Niño generate asymmetric risks for financial institutions.
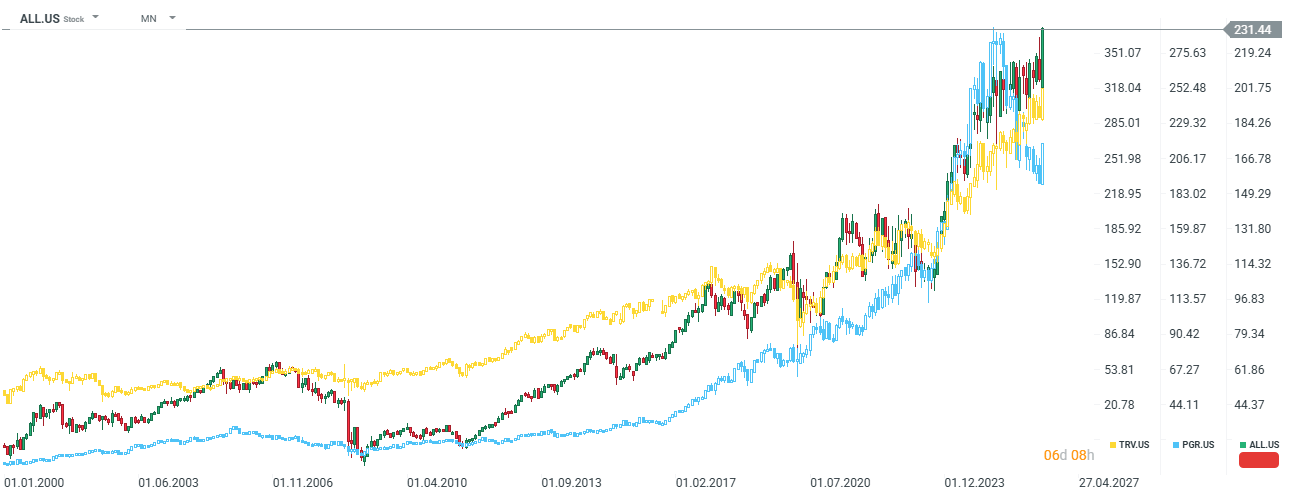
Allstate Corp. (ALL.US). Progressive Corp. (PGR) / Travelers (TRV): Theoretical beneficiaries of El Niño. This phenomenon causes strong wind shear over the Atlantic, which makes it difficult for destructive hurricanes to form off the coast of Florida and in the Gulf of Mexico (NOAA forecasts indicate a drop in the number of named storms to a level of 8 to 14 in the 2026 season compared to a norm of 14). Fewer hurricanes mean a radical reduction in claim costs for American property insurers. However, the unpredictability of climate change remains a risk, as it could bring other local disasters.
Allstate and Travelers are currently at historical levels, while Progressive Corp may appear somewhat undervalued relative to the sector. Source: xStation5
Credicorp Ltd. (BAP). Intercorp Financial Services (IFS): Peruvian financial holdings were downgraded by JPMorgan to a “Neutral” recommendation. El Niño directly hits key sectors of the Peruvian economy, namely fishing and agriculture. JPMorgan indicates that bank valuations at 2.5 times book value for BAP (target price around 360 dollars) and 1.7 times for IFS (target price around 56 dollars) do not fully discount the risk of an increase in write-offs on unpaid agricultural and fishing loans and the political uncertainty associated with the power transition process in Peru.
Summary and Conclusions for Commodity and Equity Investors
The Super El Niño anomaly at the turn of 2026 and 2027 should not be treated as a simple signal for speculative purchase of all agricultural commodities. Precise positioning in the market requires considering climate asymmetry and overlapping structural factors. The basis of an effective strategy is abandoning traditional ONI index readings in favor of the RONI index, which is cleared of the ocean warming trend. Investors should avoid exposure to soybeans and American natural gas (or look for sell signals), which, due to the specificity of Pacific teleconnections, become natural beneficiaries and exhibit a downward trend.
In turn, the key growth potential lies in soft commodities such as Robusta coffee (which partially translates into Arabica coffee prices) and cocoa, where El Niño drastically deepens an already tight supply-demand balance. On the other hand, an aspect that El Niño does not take into account is demand, which is depleted after these commodities hit historical peaks. In the equity segment, the optimal choice is capital allocation into companies with a high barrier to entry and direct operational leverage on the effects of
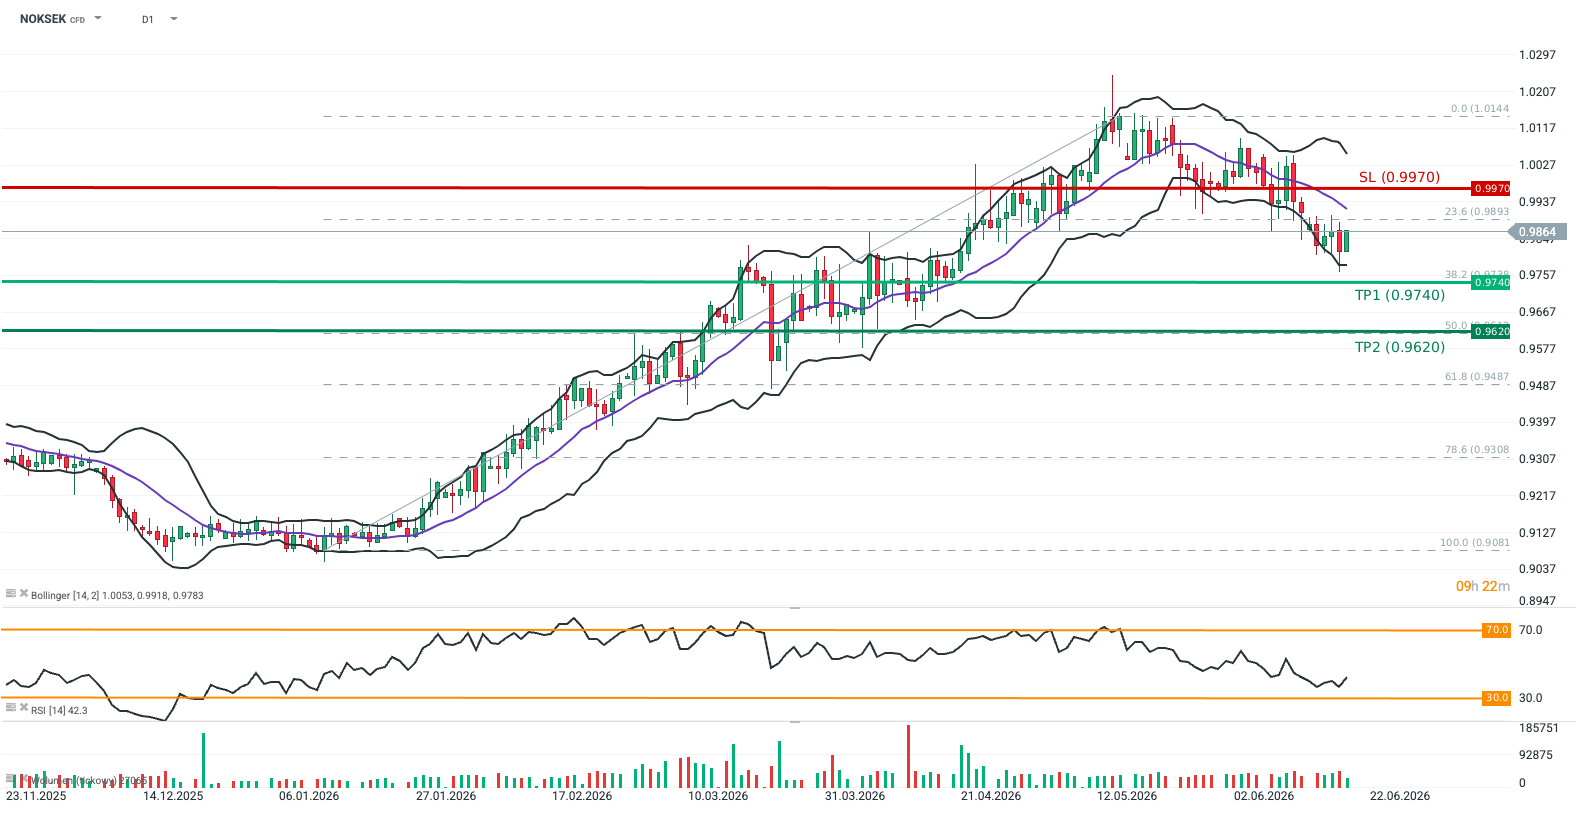
The NOKSEK closing price has remained below the 23.6% Fibonacci retracement level (measured from January 13 to May 15) for the last five consecutive sessions.
The exchange rate failed to return above the middle Bollinger Band on the 14-day timeframe, despite yesterday’s declaration from Norges Bank indicating its intention to hike interest rates in the coming months.
Crude oil futures (OIL) have lost approximately 7.5% since the beginning of the week.
NOKSEK broke its upward trend alongside the de-escalation of the Middle East conflict due to its tight correlation with oil prices (Norway remains one of the key net exporters of the commodity). The cross also failed to react significantly to the hawkish rhetoric from Norges Bank, which announced interest rate hikes in the coming months in the face of elevated CPI inflation (3.1% in May 2026). The rate remains in a downward trend (consistently trading between the middle and lower Bollinger Bands on the 14-day interval) despite the recent widening of the yield spread between 2-year Norwegian and Swedish government bonds.
This suggests that the exchange rate’s correlation with oil prices and the fading geopolitical risk premium remain the dominant drivers. Upside for the NOK may also be capped by the broader macroeconomic outlook—Norges Bank projects elevated inflation above target until 2029, alongside the risk of unemployment rising to pre-pandemic levels. Conversely, forecasts for Sweden point to accelerating GDP growth (1.8% in 2026 and 2.2% in 2027; source: Eurostat) combined with falling inflation below 2% (1.5% in 2026 and 1.8% in 2027; source: Eurostat).
Methodology
This recommendation was prepared based on a technical analysis of the NOKSEK chart, a fundamental analysis of the respective economies (monetary policy in Norway and Sweden), and the exchange rate’s correlation with crude oil prices. The directional bias of the recommendation was determined using Bollinger Bands. Take Profit and Stop Loss levels were established using Fibonacci retracements and price action (TP1 and TP2 at the 38.2% and 50.0% Fibo levels of the latest upward wave; SL placed at the resistance of the last rebound prior to the trend reversal).
To provide the best experiences, we use technologies like cookies to store and/or access device information. Consenting to these technologies will allow us to process data such as browsing behavior or unique IDs on this site. Not consenting or withdrawing consent, may adversely affect certain features and functions.
Functional
Always active
The technical storage or access is strictly necessary for the legitimate purpose of enabling the use of a specific service explicitly requested by the subscriber or user, or for the sole purpose of carrying out the transmission of a communication over an electronic communications network.
Preferences
The technical storage or access is necessary for the legitimate purpose of storing preferences that are not requested by the subscriber or user.
Statistics
The technical storage or access that is used exclusively for statistical purposes.The technical storage or access that is used exclusively for anonymous statistical purposes. Without a subpoena, voluntary compliance on the part of your Internet Service Provider, or additional records from a third party, information stored or retrieved for this purpose alone cannot usually be used to identify you.
Marketing
The technical storage or access is required to create user profiles to send advertising, or to track the user on a website or across several websites for similar marketing purposes.