
The New Zealand dollar remained at a six-week high, hovering around $0.584, as the prospect of additional rate hikes at home helped offset a broader risk-off move amid escalating US-Iran tensions. The Reserve Bank of New Zealand is widely expected to raise interest rates again in September, with the OCR projected to reach at least 3.0% by the end of the year. Earlier this week, RBNZ Chief Economist Paul Conway warned that renewed hostilities in the Middle East could reignite inflationary pressures, potentially prompting the central bank to tighten policy further after last week’s first hike in more than three years. Meanwhile, the US dollar rebounded from a near one-month low after the latest data pointed to continued resilience in the US economy, capping further gains in the kiwi. For the week, the currency rose more than 1%, marking its third straight week of gains.

New Zealand Dollar Trades Near 6-Week High
The New Zealand dollar hovered near a six-week high at around $0.583, supported by expectations that the Reserve Bank of New Zealand will continue tightening monetary policy, alongside broad weakness in the US dollar. Markets widely expect the RBNZ to deliver another rate hike in September, with the OCR seen reaching at least 3.0% by the end of the year. RBNZ Chief Economist Paul Conway said earlier this week that renewed conflict in the Middle East could fuel inflationary pressures, reinforcing the case for further policy tightening following last week’s first rate increase in more than three years. Meanwhile, the greenback hovered near a one-month low as investors scaled back bets on a near-term Federal Reserve rate hike after softer-than-expected inflation data. However, escalating geopolitical tensions remain a downside risk for the New Zealand dollar, as heightened uncertainty could weaken global risk appetite and weigh on risk-sensitive currencies such as the kiwi.
Chart of the Day – What is next for July’s strongest currency?
The geopolitically turbulent start of July has brought a strengthening of commodity currencies (among them, the Norwegian krone). However, the top of the G10 list is occupied by the New Zealand dollar, which may come as a surprise to some. The currency has strengthened by nearly 2.5% against the dollar over the past two weeks.
What lies behind such a significant move?
Fundamental to this, as is often the case, were the actions of the central bank. On 8 July, the Reserve Bank of New Zealand raised the main interest rate by 25 bps, lifting it to 2.5%. This was the first rate hike in New Zealand in over three years. The key, however, was not just the decision to raise rates (which was largely priced in by markets) but the communication that accompanied it.
- The decision was made unanimously by the committee. At the previous meeting in May, there was a 3-3 split in votes, and the balance was only tipped by the new governor, Anna Breman.
- The RBNZ Chief Economist, Paul Conway, drew clear attention to pro-inflationary risks resulting from the escalation of tensions in the Middle East.
- The Bank stated in its communiqué that “while further interest rate hikes seem likely at upcoming meetings, their timing is highly uncertain.”
- RBNZ research suggests that after a long period of elevated inflation, New Zealand companies are significantly more inclined to immediately pass costs on to consumers and less willing to lower prices when costs fall.
As a result, the market’s baseline scenario is another hike in September and another upward move in October or December. This would bring the main interest rate (cash rate) to 3%, which the bank currently defines as the neutral level.
What lies ahead? There is still plenty of time until September.
- In the meantime, the Q2 inflation report will be published. The consensus assumes a significant increase in the headline indicator, most likely to around 4%.
- After the manufacturing PMI rose to its highest level since 2021 (59.7), data on production could prove particularly interesting.
Data from China, New Zealand’s largest trading partner, which absorbs nearly 25% of the country’s total exports (mainly dairy, meat, wood, and fruit), will also be significant.
- Stronger economic data from the Middle Kingdom usually means greater demand for products imported from New Zealand.
- In this context, the readings published today are not particularly optimistic. GDP dynamics fell to the lowest level since 2022 (+4.3% year-on-year).
- The Asian giant is burdened by a property market crisis, weak domestic demand, and a decline in investment (down 5.7% year-on-year in the first half of the year).
The strength of the dollar itself, which is awaiting further news from the geopolitical front and the September FOMC decision, could, of course, also prove key.
- The market does not really expect a hike, so the focus will be on communication. Kevin Warsh remains enigmatic, so upcoming conferences may attract particular attention.
Technical Analysis Figure 1: NZDUSD [D1] (08.07.2025 – 15.07.2026)
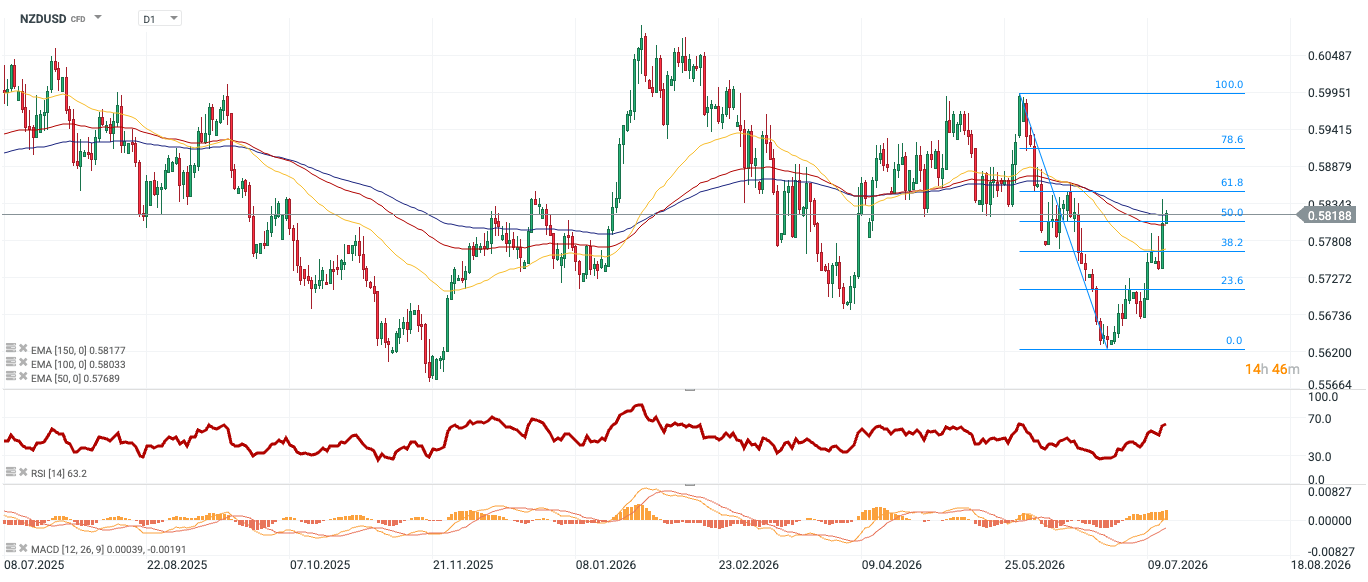
Source: xStation, 15.07.2026 The NZDUSD pair has broken out of the downtrend and is currently testing key support levels. The price has breached the 50% Fibonacci retracement and is hovering around the 150-day moving average. The upward momentum is also suggested by the MACD indicator. The Relative Strength Index (RSI) has reached 63.4, which confirms a clear advantage for market bulls, while at the same time indicating that the market is not yet in the extreme overbought zone (above 70).
Kiwi Dollar Rises to 4-Week High
The New Zealand dollar rose to around $0.577 on Tuesday, its highest level in four weeks, following remarks from RBNZ Chief Economist Paul Conway. Conway warned that inflation may not ease as quickly as the central bank expects, raising the possibility of further interest rate hikes. Last week, the RBNZ lowered its forecast for third-quarter inflation to 3.3% from 4.3%, citing lower fuel prices following the interim US-Iran agreement. However, oil prices have rebounded in recent days as renewed fighting in the Middle East fueled supply concerns. The RBNZ’s hawkish stance last week, combined with a series of upbeat domestic economic data, has led markets to price in two additional rate hikes this year. However, the kiwi’s gains were limited as the standoff between the US and Iran intensified, with President Trump reimposing a US naval blockade of Iranian ports and announcing a 20% charge on all cargo shipped through the Strait of Hormuz, dampening risk appetite.
Kiwi Dollar Near 3-Week Highs
The New Zealand dollar held around $0.576 on Monday, hovering near its highest level in more than three weeks, supported by expectations of further interest rate hikes from the Reserve Bank. Swaps traders are pricing in nearly two additional quarter-point rate hikes from the Reserve Bank of New Zealand by year-end, following the central bank’s hawkish stance and strong manufacturing data last week. Additional support came from fresh data showing that New Zealand’s services sector returned to expansion in June for the first time since January, reinforcing the view that the economy is regaining momentum. However, escalating tensions in the Middle East are weighing on risk sentiment and limiting the kiwi’s gains. The US and Iran exchanged heavy missile and drone strikes over the weekend, with Tehran targeting US facilities across the Gulf and claiming it had once again closed the Strait of Hormuz.
New Zealand Dollar extends hawkish RBNZ-inspired rally; hits three-week high vs weaker USD
- NZD/USD builds on the hawkish RBNZ-inspired gains for the third straight day on Friday.
- The USD drops to a fresh weekly trough and provides an additional boost to spot prices.
- Mixed US-Iran signals do little to impress the USD bulls or hinder the pair’s momentum.
The NZD/USD pair gains strong follow-through positive traction for the third straight day and rallies to an over three-week top during the Asian session on Friday. Spot prices currently trade around the 0.5775-0.5780 region, up nearly 0.40% for the day, and remain on track to register strong gains for the second week in a row amid a combination of supporting factors.
The New Zealand Dollar (NZD) continues to be underpinned by the Reserve Bank of New Zealand’s (RBNZ) hawkish outlook, which, along with a broadly weaker US Dollar (USD), acts as a tailwind for the NZD/USD pair. As was widely expected, the RBNZ raised the Official Cash Rate (OCR) by 25 basis points (bps) to 2.50% following the conclusion of the June monetary policy meeting on Wednesday. The central bank also indicated that some further reduction in monetary stimulus is likely to be required to curb inflationary pressures.
In contrast, the Minutes from the June 16–17 FOMC meeting revealed on Wednesday that policymakers were divided over the direction of interest rates. The minutes further stated that many participants indicated the appropriate level of the federal funds rate would be within or slightly below the current target range at the end of this year. The less hawkish outlook, in turn, drags the USD Index (DXY), which tracks the Greenback against a basket of currencies, to a fresh weekly low and contributes to the bid tone around the NZD/USD pair.
Meanwhile, the geopolitical risk premium resurfaced this week after the US military unleashed a new wave of strikes against Iran earlier this week in retaliation for Tehran’s attacks on commercial ships in the Strait of Hormuz. Iran responded by targeting American allies and bombing US military installations across Bahrain and Kuwait. The market anxiety, however, subsided after Trump on Thursday claimed that Iran had called to make a deal with the US, denting the USD’s safe-haven status and lending additional support to the NZD/USD pair.
Moving ahead, there isn’t any relevant market-moving economic data due for release from the US on Friday, leaving the USD at the mercy of comments from influential FOMC members. Apart from this, the market focus will be on further developments surrounding the Middle East crisis, which might continue to infuse volatility in global financial markets and drive the USD. Nevertheless, the fundamental backdrop backs the case for a further appreciating move for the NZD/USD pair, which remains on track to register gains for the second straight week.
New Zealand Dollar Price This week
The table below shows the percentage change of New Zealand Dollar (NZD) against listed major currencies this week. New Zealand Dollar was the strongest against the Japanese Yen.
| USD | EUR | GBP | JPY | CAD | AUD | NZD | CHF | |
|---|---|---|---|---|---|---|---|---|
| USD | -0.09% | -0.66% | 0.19% | -0.30% | -0.23% | -1.29% | 0.13% | |
| EUR | 0.09% | -0.60% | 0.24% | -0.23% | -0.10% | -1.23% | 0.18% | |
| GBP | 0.66% | 0.60% | 0.74% | 0.36% | 0.50% | -0.63% | 0.77% | |
| JPY | -0.19% | -0.24% | -0.74% | -0.49% | -0.26% | -1.42% | -0.05% | |
| CAD | 0.30% | 0.23% | -0.36% | 0.49% | 0.20% | -0.94% | 0.41% | |
| AUD | 0.23% | 0.10% | -0.50% | 0.26% | -0.20% | -1.13% | 0.27% | |
| NZD | 1.29% | 1.23% | 0.63% | 1.42% | 0.94% | 1.13% | 1.41% | |
| CHF | -0.13% | -0.18% | -0.77% | 0.05% | -0.41% | -0.27% | -1.41% |
The heat map shows percentage changes of major currencies against each other. The base currency is picked from the left column, while the quote currency is picked from the top row. For example, if you pick the New Zealand Dollar from the left column and move along the horizontal line to the US Dollar, the percentage change displayed in the box will represent NZD (base)/USD (quote).

AUD/USD Price – 0.6860 is key support level amid geopolitical risks
- The Australian Dollar edges up against the US Dollar despite multiple headwinds.
- Middle East war may last longer due to US attacks on Iranian infrastructure.
- The FOMC minutes show that several policymakers see the need for monetary policy tightening.
The Australian Dollar (AUD) trades marginally higher at around 0.6935 against the US Dollar (USD) during the European trading session on Thursday. The Aussie pair edges up as the US Dollar ticks lower despite escalating Middle East risks and hawkish Federal Open Market Committee (FOMC) Minutes of the June policy meeting.
At press time, the US Dollar Index (DXY), which gauges the Greenback’s value against six major currencies, trades 0.13% lower to near 100.92.
The attacks on Iranian infrastructure by United States (US) military forces signal that the restart of the war would last long, a scenario that might keep oil prices higher and the appeal of safe-haven assets upbeat. According to Axios, the US Air Force bombed two railway bridges in Iran on Wednesday.
Meanwhile, the FOMC Minutes showed on Wednesday that policymakers are concerned about upside inflation risks and several of them see the need to tighten monetary conditions to ease price pressures.
In the Australian region, traders might consider raising hawkish Reserve Bank of Australia (RBA) bets again as Assistant Governor Sarah Hunter has reiterated that the central bank would act, if needed, for inflation to return to target and maintain sustainable full employment.
Lately, traders pared hawkish RBA bets as the Australian monthly Consumer Price Index (CPI) has cooled down in the last two months.
AUD/USD technical analysis
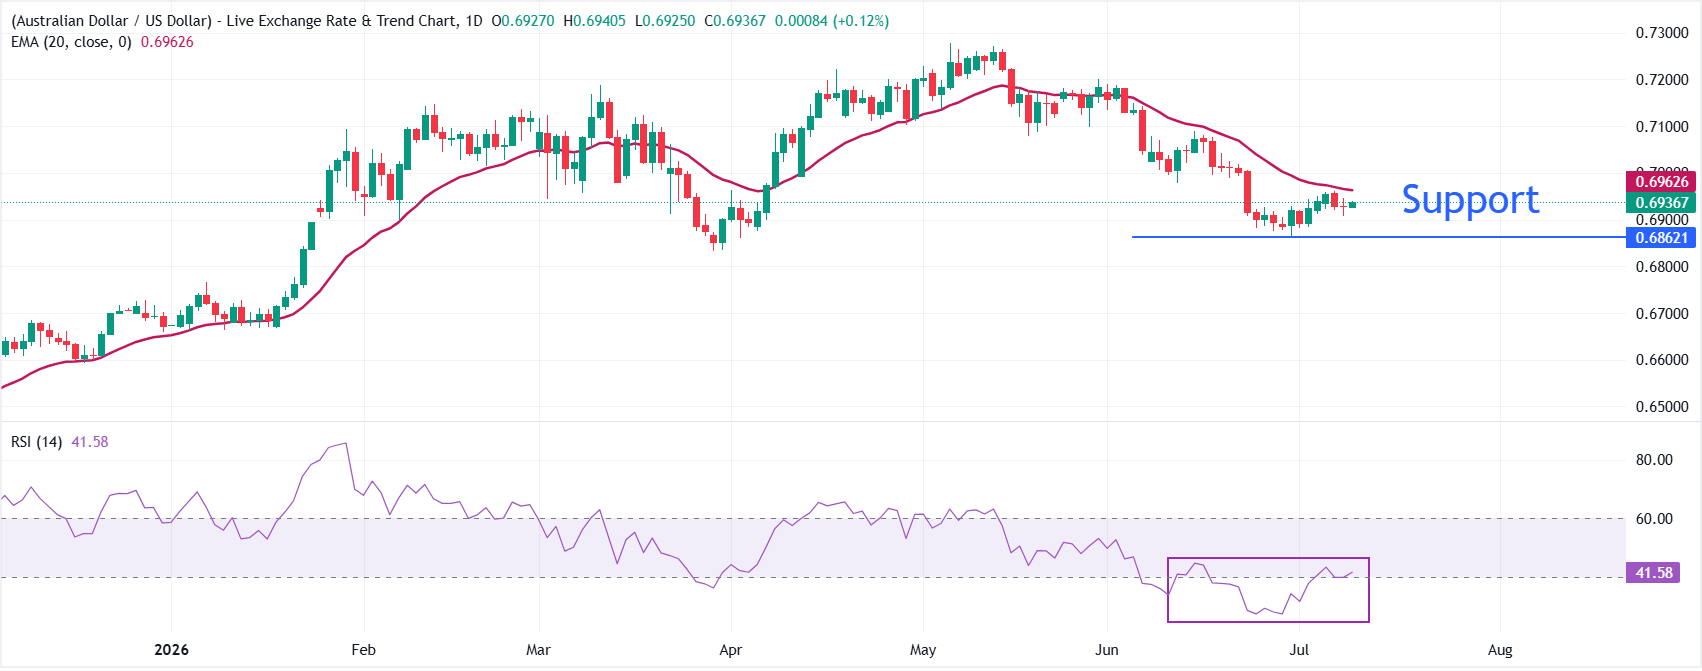
AUD/USD trades slightly higher at around 0.6936, but maintains a bearish near-term tone as it remains below the 20-period exponential moving average (EMA) at 0.6963.
The pair has been unable to reclaim this short-term trend proxy, suggesting that rallies are likely to be capped while price holds under the EMA. The Relative Strength Index (RSI) at 41.46 stays below the midline, hinting at persistent, though not extreme, selling pressure.
On the topside, initial resistance is defined by the 20-period EMA at 0.6963, which is the first level bulls would need to overcome to ease the current downside bias. Above the moving average, the next resistance for the pair will be the psychological level of 0.7000. Looking down, the June low at 0.6865 is the key support level; a break below that would expose the pair to the March low at 0.6833.
New Zealand Dollar rallies to 0.5700 vs USD on expected RBNZ rate hike
- NZD/USD gains some positive traction after the widely expected RBNZ rate hike.
- Renewed US-Iran hostilities underpin the safe-haven USD and cap spot prices.
- Reviving inflation fears further support the buck ahead of the FOMC Minutes.
The NZD/USD pair attracts some buyers in reaction to the Reserve Bank of New Zealand’s (RBNZ) anticipated interest rate hike and reclaims the 0.5700 mark during the Asian session on Wednesday. Spot prices, for now, seem to have snapped a two-day losing streak, though the upside potential seems limited amid geopolitical uncertainties.
As was widely expected, the RBNZ decided to raise the Official Cash Rate (OCR) by 25 basis points (bps) to 2.50% following the conclusion of the June monetary policy meeting. The New Zealand Dollar (NZD) bulls, however, seem hesitant and opt to wait for further insight if this is a one-off move rather than the start of further tightening. Hence, the focus will be on the post-meeting press conference, where comments from RBNZ Governor Dr. Anna Breman will influence the NZD and provide a fresh impetus to the NZD/USD pair.
In the meantime, renewed US-Iran hostilities assist the safe-haven US Dollar (USD) to stand firm near the weekly high, which is seen acting as a headwind for the currency pair. The US military unleashed a new wave of strikes against Iran on Tuesday following reports of attacks on three oil tankers in the Strait of Hormuz, jeopardizing the already fragile ceasefire. The US also moved to withdraw a concession that allowed Iran to sell oil on international markets, triggering a sharp rally in Oil prices and reviving inflation fears.
The concerns, in turn, lift market expectations that the Fed will hike interest rates at least once by the end of this year, triggering a fresh leg up in US Treasury bond yields and further underpinning the Greenback. This contributes to capping the upside for the NZD/USD pair. Traders also seem hesitant and keenly await the release of FOMC Minutes before positioning for the next leg of a directional move, warranting caution before positioning for the resumption of the recent recovery from the year-to-date low, touched in June.
