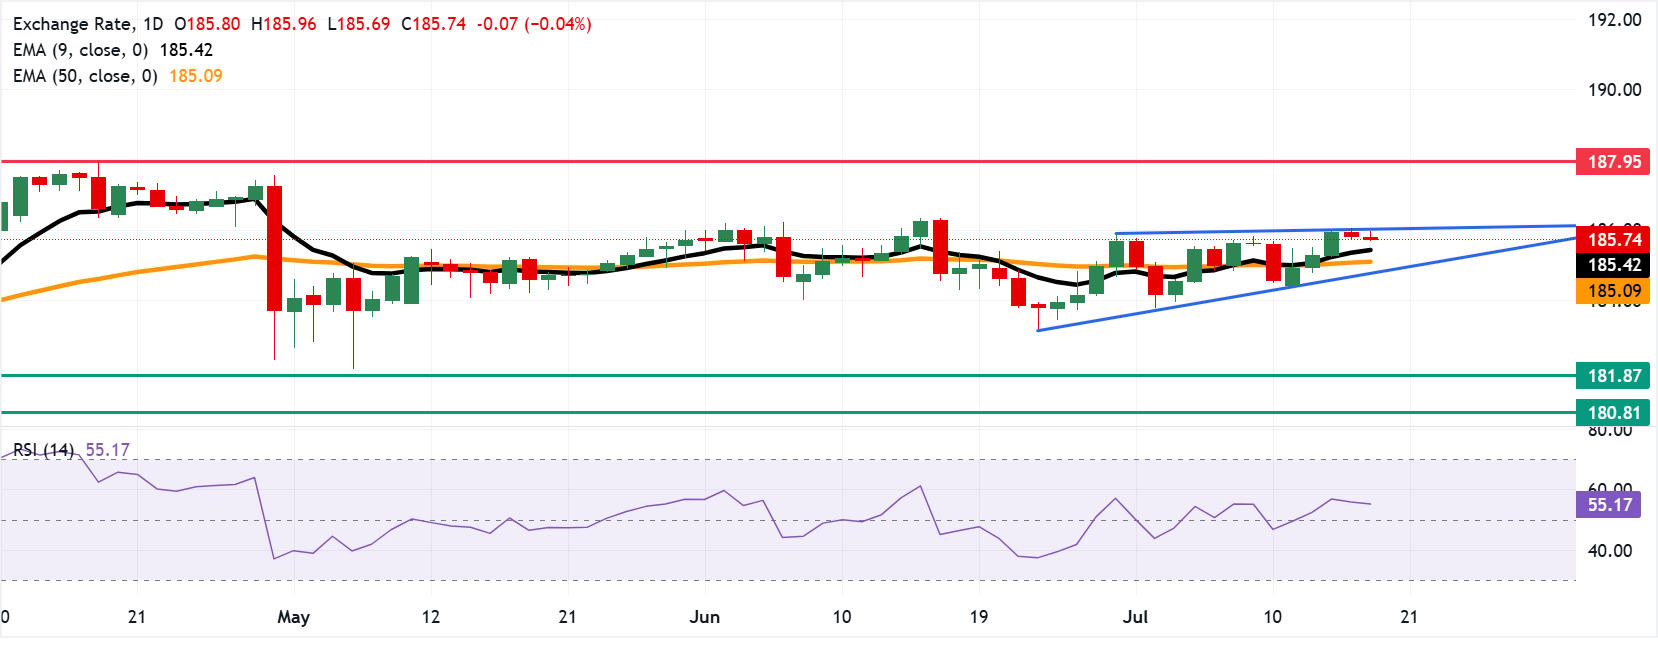
Currency Hedger No Comments

Fed’s Kashkari says AI will force a rate hike; EURUSD and USD reverse early moves

s now losing buying momentum. In the second half of the session, the momentum has clearly shifted to the sellers. The US100, on the other hand, reflects relative strengthโ€”the index has gradually lost its downward momentum and is stabilizing in the second half of the day, ignoring some of the negative market signals.

The main topic of the day in the tech world is the potential delay of OpenAIโ€™s IPO โ€” reports in the NYT about the debut being pushed back to next year (in part due to SpaceXโ€™s poor performance following its IPO) have hit the entire semiconductor sector hard. Micron, AMD, and Intel are down about 2% each, while Oracle is down more than 1%. The ripple effect was particularly evident in Asia: SoftBank, a key investor in OpenAI, plummeted by more than 12% , the Nikkei 225 lost 4.15% , and South Koreaโ€™s Kospi plunged by 5.81% .

JPMorgan warns outright that the IPO delay โ€œcould slow the pace of spending on AI infrastructure.โ€ On the other hand, however, postponing the launch date will keep market expectations alive, which, paradoxically, could have a positive effect on market returns given the narrative being built and the promises of increasingly advanced AI development.

The main risk factor on the geopolitical front, however, is the U.S.-Iran situation. Trump reported on Truth Social that Iran had launched at least four kamikaze drones at ships in the Strait of Hormuz. One struck the deck of a large container shipโ€”the vessel sustained damage but continued its voyage. The other three drones were shot down. Trump called the incident a โ€œstupid violation of the ceasefire agreement.โ€ The Strait of Hormuz is a key route for about 20% of global oil suppliesโ€”any escalation in this region immediately catches the attention of commodity markets.

At the same time, Fedโ€™s Kashkari spoke out on inflationโ€”according to him, the labor market is not currently a source of inflation. Price pressures are being driven by the supply side, and one of the factors he mentioned isโ€ฆ the expansion of AI infrastructure. Kashkari of the Fed said that the development of artificial intelligence likely means the Fed will have to raise interest rates.

Source: xStation

Currency Hedger No Comments

Intraday USD correction, but UBS sees the greenback regaining a new trend โ€” what’s next for EUR/USD?

hursdayโ€™s and Fridayโ€™s trading sessions saw a sharp rebound in the EUR/USD pair, which is now attempting to consolidate above 1.14 after a series of strong bullish daily candles in recent weeks pushed the dollar to levels not seen since May 2025. Meanwhile, UBS analysts take the opposite viewโ€”arguing that the current weakness of the USD is a temporary phenomenon, not a structural one.

UBS vs. the Market โ€” A Discrepancy in Narratives

UBS lowered its forecast for the EUR/USD exchange rate at the end of 2026 to 1.12 from the previous 1.14 , signaling that the bank expects the current trend to reverse. This view is based on a reassessment of U.S. interest rate expectationsโ€”the market is beginning to price in the possibility that the Fed may maintain a restrictive monetary policy for longer than previously anticipated. UBS notes that the DXY index has the potential to test the 102 level, which was last seen in May 2025. Although long positions in the dollar have increased, the bank assesses that they are far from the extreme levels seen in 2024โ€”which means there is still room for further USD buying.

Fed vs. ECB โ€” The Divergence Persists

The key driver for the EUR/USD pair remains the divergence in monetary policy on both sides of the Atlantic.

The Fed โ€”despite some market expectations of rate cutsโ€”maintains a hawkish stance, emphasizing the resilience of the U.S. economy and labor market.

The ECB , in turn, is continuing its easing cycle, and further rate cuts are almost fully priced in by the market for the second half of the year. This asymmetry naturally favors the dollar over the euro in the medium term. Todayโ€™s rebound in EUR/USD can therefore be interpreted as a technical correction following an extremely rapid move, rather than a change in the pairโ€™s fundamental outlook.

Technical Context and Carry Trade

It is worth noting that, in the same analysis, UBS points to the Swiss franc as a currency that may weaken in the short term due to its growing role as a carry trade funding currencyโ€”which indirectly supports risk appetite and may temporarily curb the dollarโ€™s strength. The Australian dollarโ€™s target was lowered to 0.68 from 0.74 , reflecting the global context: weaker macroeconomic data outside the U.S. and narrowing interest rate differentials are boosting the greenback against commodity and emerging-market currencies.

Technical Analysis: EURUSD D1

The pair is currently testing a key level at 1.1392โ€”a break below or above this level could determine the pairโ€™s trajectory for the coming sessions. On the upside, resistance comes from the 50/100/200 EMAs clustered around 1.1560โ€“1.1615. The RSI, at 34.4, is approaching the oversold zone (30)โ€”similar to February 2026โ€”which could trigger a short-term technical rebound. Nevertheless, as long as the pair does not close the day clearly above 1.1392, technical analysis favors a continuation of the downtrend. It is worth noting, however, that the pair has been highly volatile in recent days, so price movements may remain chaotic in the near term.

Currency Hedger No Comments

Euro steadies against Canadian Dollar after paring recent losses

  • EUR/CAD recovers its daily losses on ECB rate hike bets.
  • ECB policymaker Isabel Schnabel stated that monetary tightening is not over.
  • The Canadian Dollar may struggle as the BoC is expected to hold interest rates steady all year.

EUR/CAD remains flat after paring intraday losses, trading around 1.6150 during the European hours on Friday. The currency cross receives support as the Euro (EUR) gains ground following European Central Bank (ECB) policymaker Isabel Schnabel’s comments, reiterating on Thursday that the central bankโ€™s monetary tightening cycle is not yet over.

While acknowledging that short-term economic conditions have outpaced expectations, Schnabel warned that a recent ceasefire should not prompt policymakers to lower their guard. She emphasized that, from today’s perspective, further interest rate hikes will be necessary to steer inflation back down to the ECB’s 2% medium-term target.

However, ECB President Christine Lagarde noted earlier this week that the central bank can avoid aggressive policy reactions to geopolitical spillovers from the Middle East. While Lagarde acknowledged that the Eurozone’s inflation shock is too significant to ignore, she emphasized it remains insufficient to drive up long-term inflation.

The EUR/CAD cross may further advance as the commodity-linked Canadian Dollarโ€™s (CAD) upside could be capped as the Bank of Canada (BoC) is expected to hold interest rates steady for the remainder of the year.

According to the minutes from the BoCโ€™s policy meeting, the governing council agreed to keep its monetary policy nimble to respond to the simultaneous risks of new US trade restrictions and volatile energy prices. Reflecting this cautious outlook, Reuters data shows traders have sharply scaled back expectations for further tightening, now pricing in just 17 basis points by December, down from 60 basis points last month.

Euro Price Today

The table below shows the percentage change of Euro (EUR) against listed major currencies today. Euro was the strongest against the Australian Dollar.

USDEURGBPJPYCADAUDNZDCHF
USD-0.06%-0.03%-0.08%-0.05%0.26%0.05%-0.16%
EUR0.06%0.01%-0.02%0.03%0.31%0.07%-0.10%
GBP0.03%-0.01%-0.02%-0.02%0.30%0.08%-0.12%
JPY0.08%0.02%0.02%0.02%0.32%0.08%-0.09%
CAD0.05%-0.03%0.02%-0.02%0.30%0.06%-0.13%
AUD-0.26%-0.31%-0.30%-0.32%-0.30%-0.22%-0.42%
NZD-0.05%-0.07%-0.08%-0.08%-0.06%0.22%-0.18%
CHF0.16%0.10%0.12%0.09%0.13%0.42%0.18%

The heat map shows percentage changes of major currencies against each other. The base currency is picked from the left column, while the quote currency is picked from the top row. For example, if you pick the Euro from the left column and move along the horizontal line to the US Dollar, the percentage change displayed in the box will represent EUR (base)/USD (quote).

Currency Hedger No Comments

EUR/USD Price – Holds above mid-1.1300s amid Hormuz risks, bearish setup

  • EUR/USD struggles to lure buyers on Friday as Hormuz risks support the safe-haven USD.
  • Receding Fed rate hike bets keep a lid on the USD appreciation and limit losses for the pair.
  • The bearish technical setup suggests that the path of least resistance is to the downside.

The EUR/USD pair struggles to capitalize on the previous day’s modest recovery gains and oscillates in a narrow band during the Asian session on Friday. Spot prices, however, hold above mid-1.1300s and the lowest level since May 2025, set on Thursday, warranting some caution for bearish traders.

Reports that Iranโ€™s Islamic Revolutionary Guard Corps (IRGC) attacked a Singapore-flagged cargo ship in the Strait of Hormuz reignite worries about the sustainability of an interim US-Iran peace deal and support the safe-haven US Dollar (USD). This, in turn, is seen as a key factor acting as a headwind for the EUR/USD pair.

Meanwhile, traders trimmed their bets for interest rate hikes by the US Federal Reserve (Fed) this year amid expectations that inflation likely peaked last month or is โ€Œclose to doing so in the face of the recent fall in Crude Oil prices. This caps the upside for the USD and helps limit any further downside for the EUR/USD pair.

The recent repeated failures to find acceptance above the 100-period Simple Moving Average (SMA) on the 4-hour chart and the EUR/USD pair’s inability to gain any meaningful traction favor bears. Moreover, the Relative Strength Index (RSI) near 42 hints at a gradual recovery from oversold conditions rather than a bullish shift.

Meanwhile, the Moving Average Convergence Divergence (MACD) has now turned modestly positive, though the EUR/USD pair remains structurally pressured in the near-term. This, in turn, suggests that any meaningful recovery attempt might still be seen as a selling opportunity and runs the risk of fizzling out rather quickly.

Immediate resistance is located at the 1.1440 region, and a break above could lift the EUR/USD pair back to the 100-period SMA at 1.1514. A move beyond this hurdle is needed to ease the current bearish tone and open the way for a more meaningful correction higher. Until then, the pair seems vulnerable to test fresh lows.

(The technical analysis of this story was written with the help of an AI tool.)

EUR/USD 4-hour chart

Chart Analysis EUR/USD

US Dollar Price Today

The table below shows the percentage change of US Dollar (USD) against listed major currencies today. US Dollar was the strongest against the Australian Dollar.

USDEURGBPJPYCADAUDNZDCHF
USD-0.02%-0.05%-0.10%-0.06%0.25%0.14%-0.08%
EUR0.02%-0.05%-0.06%-0.02%0.27%0.12%-0.06%
GBP0.05%0.05%0.00%0.00%0.32%0.19%-0.02%
JPY0.10%0.06%0.00%0.02%0.33%0.19%-0.01%
CAD0.06%0.02%0.00%-0.02%0.31%0.16%-0.05%
AUD-0.25%-0.27%-0.32%-0.33%-0.31%-0.13%-0.35%
NZD-0.14%-0.12%-0.19%-0.19%-0.16%0.13%-0.20%
CHF0.08%0.06%0.02%0.00%0.05%0.35%0.20%

The heat map shows percentage changes of major currencies against each other. The base currency is picked from the left column, while the quote currency is picked from the top row. For example, if you pick the US Dollar from the left column and move along the horizontal line to the Japanese Yen, the percentage change displayed in the box will represent USD (base)/JPY (quote).

Currency Hedger No Comments

EUR/JPY Price – Slips below 184.00 due to bearish near-term bias

  • EUR/JPY is bearish, trading below its nine-period and 50-period EMAs.
  • The 14-day Relative Strength Index at 38 signals continuing downside momentum, not an oversold reversal.
  • Spot above 183.81 VWAP means buyers control the EUR/JPY cross in intraday trading.

EUR/JPY inches lower after registering minor gains in the previous day, trading around 183.90 during the Asian hours on Friday. The currency cross maintains a bearish near-term bias as it holds below both the nine-period and 50-period Exponential Moving Averages (EMAs) at 184.38 and 184.91, respectively.

The EUR/JPY cross is remaining within the symmetrical triangle, suggesting market indecision and an impending breakout as energy builds, while the 14-day Relative Strength Index (RSI) has eased toward 38, hinting at lingering downside pressure rather than a decisive oversold reversal.

However, the session Volume-Weighted Average Price (VWAP) represents the true average price paid for a stock or asset throughout the day, weighted by volume. Because the spot price is higher than the VWAP of 183.81, it means buyers are firmly in control and are willing to pay a premium to acquire the EUR/JPY cross.

In context with the symmetrical triangle, volatility is shrinking. Think of it like a compressed spring; the market is resting and storing energy for a major breakout. Because the price is trapped between two converging trendlines, momentum indicators like VWAP lose their directional edge until a breakout occurs.

The initial support is aligned at the lower boundary of the symmetrical triangle around 183.40. Further declines would expose the four-month low of 181.87, recorded on March 16, followed by the six-month low of 180.81.

On the upside, primary resistance is seen at the nine-period EMA at 184.38, followed by the 50-period EMA at 184.91; a sustained break above these levels would soften the bearish tone and expose the upper boundary of the symmetrical triangle around 186.00. Further advances would support the EUR/JPY cross to test the all-time high of 187.95.

Chart Analysis EUR/JPY
EUR/JPY: Daily Chart

Euro Price Today

The table below shows the percentage change of Euro (EUR) against listed major currencies today. Euro was the weakest against the Swiss Franc.

USDEURGBPJPYCADAUDNZDCHF
USD-0.03%-0.05%-0.11%-0.06%0.33%0.14%-0.17%
EUR0.03%-0.03%-0.06%-0.01%0.36%0.14%-0.13%
GBP0.05%0.03%-0.04%-0.01%0.39%0.19%-0.11%
JPY0.11%0.06%0.04%0.05%0.43%0.22%-0.06%
CAD0.06%0.00%0.00%-0.05%0.39%0.16%-0.13%
AUD-0.33%-0.36%-0.39%-0.43%-0.39%-0.20%-0.48%
NZD-0.14%-0.14%-0.19%-0.22%-0.16%0.20%-0.29%
CHF0.17%0.13%0.11%0.06%0.13%0.48%0.29%

The heat map shows percentage changes of major currencies against each other. The base currency is picked from the left column, while the quote currency is picked from the top row. For example, if you pick the Euro from the left column and move along the horizontal line to the US Dollar, the percentage change displayed in the box will represent EUR (base)/USD (quote).

Currency Hedger No Comments

EUR/JPY Price – Trades near 184.00 after rebounding from symmetrical triangle

  • EUR/JPY remains stuck in a corrective phase dominated by short-term downward pressure.
  • The 14-day Relative Strength Index at 36.96 suggests downside momentum is slowing but not yet fully exhausted.
  • The currency cross trades above the 183.69 VWAP, indicating mild bullish sentiment for the current session.

EUR/JPY pares its daily losses, remaining in the negative territory and trading around 183.80 during the Asian hours on Thursday. The currency cross holds in a corrective phase below the short- and medium-term trend filters, with the nine-day Exponential Moving Average (EMA) at 184.47 and the 50-day EMA at 184.95 acting as immediate overhead caps and reinforcing a bearish near-term bias.

The EUR/JPY cross has slipped back under the moving averages after failing to sustain gains near recent highs, while the 14-day Relative Strength Index (RSI) at 36.96 approaches oversold territory, hinting that downside momentum is softening but not yet exhausted.

The EUR/JPY cross is remaining within the symmetrical triangle, suggesting market indecision and an impending breakout as energy builds.

The spot price is trading slightly above the Volume-Weighted Average Price (VWAP) at 183.69, suggesting a mild bullish sentiment for the current trading session. Buyers are willing to pay more than the average price paid by all other traders throughout the day.

In context with the symmetrical triangle, trading just above the day’s average volume weight indicates that bulls are trying to push the price toward the upper boundary of that triangle for a potential breakout.

The initial support is aligned at the lower boundary of the symmetrical triangle around 183.40. Further declines would expose the four-month low of 181.87, recorded on March 16, followed by six-month low of 180.81.

On the upside, a recovery above the nine-day EMA at 184.47 would be the first sign of easing pressure, though bulls would likely need a daily close over the 50-day EMA at 184.95 to challenge the major resistance band near all-time high of 187.95.

Chart Analysis EUR/JPY

Euro Price Today

The table below shows the percentage change of Euro (EUR) against listed major currencies today. Euro was the weakest against the Swiss Franc.

USDEURGBPJPYCADAUDNZDCHF
USD-0.05%-0.09%-0.06%-0.03%0.10%0.17%-0.15%
EUR0.05%-0.02%0.04%0.06%0.18%0.25%-0.08%
GBP0.09%0.02%0.02%0.07%0.19%0.27%-0.08%
JPY0.06%-0.04%-0.02%0.03%0.16%0.21%-0.11%
CAD0.03%-0.06%-0.07%-0.03%0.12%0.20%-0.15%
AUD-0.10%-0.18%-0.19%-0.16%-0.12%0.06%-0.24%
NZD-0.17%-0.25%-0.27%-0.21%-0.20%-0.06%-0.35%
CHF0.15%0.08%0.08%0.11%0.15%0.24%0.35%

The heat map shows percentage changes of major currencies against each other. The base currency is picked from the left column, while the quote currency is picked from the top row. For example, if you pick the Euro from the left column and move along the horizontal line to the US Dollar, the percentage change displayed in the box will represent EUR (base)/USD (quote).

Currency Hedger No Comments

EUR/USD Price – Rebounds above 1.1350, but outlook stays bearish below key resistance

  • EUR/USD gains ground to near 1.1370 in Thursdayโ€™s early European session. 
  • The bearish outlook of the major pair remains intact below the key 100-day SMA, with oversold RSI momentum. 
  • The initial support level to watch is 1.1350; the first upside barrier is seen at 1.1411. 

The EUR/USD pair trades in positive territory around 1.1370 during the early European session on Thursday. A surprisingly hawkish message from Kevin Warsh as the new Federal Reserve (Fed) chair last week has traders pricing a US hike as soon as September. Markets might turn cautious later in the day ahead of the key US Personal Consumption Expenditures (PCE) report. 

The headline PCE is expected to show a rise of 4.1% YoY in May, versus 3.8% prior, while the core PCE is projected to show an increase of 3.4% YoY in May, compared to 3.3% in April. If the reports show hotter-than-expected outcomes, this could reinforce the expectation of US interest rate hikes later this year and underpin the US Dollar (USD) against the Euro (EUR). 

Chart Analysis EUR/USD

Technical Analysis:

In the daily chart, EUR/USD extends its decline below the 20-day Bollinger simple moving average and remains well under the 100-day moving average, keeping the broader tone decisively bearish. Price is only slightly above the lower Bollinger Band support at 1.1351, while the Relative Strength Index (14) at 28.3 slips into oversold territory, hinting at stretched downside conditions but not yet signaling a firm rebound.

On the downside, immediate support is located at the lower Bollinger Band around 1.1350, where a sustained break would open the door to further losses toward the 1.1300 psychological level. On the topside, initial resistance emerges at the March 13 low of 1.1411, en route to the 20-day Bollinger middle band near 1.1530 and the 100-day moving average at 1.1650. Only a recovery above this layered resistance zone would start to ease the current bearish pressure.