USD/CAD struggles to build on its modest gains amid a combination of factors.
The door for further diplomacy remains open, capping the USD and the major.
Rallying Oil prices underpin the Loonie and act as a headwind for spot prices.
The USD/CAD pair retreats a few pips from the Asian session high and currently trades around the 1.3860-1.3855 region, up around 0.15% for the day. Meanwhile, the mixed fundamental backdrop warrants caution before positioning for an extension of a modest recovery from sub-1.3800 levels, or over a two-week low set on Friday.
The US Dollar (USD) struggles to capitalize on the weekly bullish gap opening amid reports that regional countries are racing to bring the US and Iran back to the negotiating table within days. This keeps the door open for further diplomacy and caps the safe-haven Greenback. Moreover, an intraday rally in Crude Oil prices underpins the commodity-linked Loonie and contributes to capping the USD/CAD pair.
West Texas Intermediate (WTI) – the benchmark US Crude Oil price – rallies back to the $105/barrel mark in reaction to failed US-Iran peace talks over the weekend. In fact, US Vice President JD Vance said that he placed a final and best offer on the table, but Iran declined to accept the terms, leading to a stalemate. Meanwhile, Iranian state media said that excessive demands sank the possibility of an agreement.
Furthermore, US President Donald Trump said that the US Navy would start blockading the Strait of Hormuz, jeopardizing a fragile two-week ceasefire. Adding to this, continued Israeli strikes in Lebanon raise the risk of a renewed escalation of tensions in the Middle East and support oil prices. However, hawkish US Federal Reserve (Fed) bets should limit deeper losses for the buck and the USD/CAD pair.
Data released on Friday showed that inflation in the US surged by the most in nearly four years during March. Apart from this, the war-driven surge in elevated energy prices led investors to abandon bets on Fed rate cuts and shift focus to potential interest rate hikes this year. The outlook triggers a fresh leg up in US Treasury bond yields, which favors the USD bulls and acts as a tailwind for the USD/CAD pair.
The offshore yuan weakened to around 6.83 per dollar on Monday, snapping a six-session winning streak, as the greenback strengthened broadly after US–Iran peace talks ended without a breakthrough. The face-to-face negotiations between the two countries’ delegations concluded with both sides acknowledging that significant differences remain. Vice President JD Vance reiterated the lack of progress, while Iranian representatives echoed similar concerns. Following the talks, President Trump announced that the US Navy would begin blockading the Strait of Hormuz, raising further concerns over potential disruptions to global energy supplies. On the domestic front, investors are closely watching a packed economic calendar this week. Key data releases, including the trade balance, Q1 GDP growth, industrial output, retail sales, and the unemployment rate, are expected to provide fresh insights into the strength and trajectory of the economy.
Markets are in a jubilant mood as we lead up to the weekend. Spurred by a milder March reading of US inflation than expected, rate cut expectations are building, and stocks are rallying. Headline CPI in the US rose at a 3.4% annual rate, a hefty jump from the 2.4% rate in February, but lower than the 3.5% expected core prices rose by a 2.6% annual rate, also weaker than expected. The BLS reported that the index for energy rose by 10% in March, driven by a 21% rise in the price of gasolene.
US price growth not as bad as feared
The jump in gasolene prices accounted for three quarters of the rise in inflation last month, according to the BLS. Airline fares also rose sharply last month, but this was partly offset by a drop in medical costs and in used car prices. Today’s data suggests two things: 1, the inflationary impact from this crisis has been huge, but it is offset by weaker inflation growth elsewhere, such as a moderate increase in shelter costs, a drop in the cost of utilities and no change in food prices last month. 2, if the Strait of Hormuz is not reopened soon, then the impact on inflation could spread to food prices and to core inflation, which typically takes longer to absorb energy price shocks.
The immediate market reaction has been relief. A higher-than-expected reading for inflation could have spooked financial markets as we lead up to the weekend. Instead, this supports current expectations of a rate cut from the Federal Reserve by year end, which is boosting the market mood.
Markets optimistic about peace talks
Some concrete economic data that quantifies the effect of the war as being less onerous than first anticipated, combined with hopes for successful peace talks is helping US stocks to extend their longest winning streak this year. Rather than selling stocks on a Friday in case of an escalation of the conflict in the Middle East over the weekend, the market is willing to ‘give peace a chance.’
Stocks have strong week, as dollar reverses course
The dollar is weaker across the board on Friday after the lower-than-expected US inflation print, which is boosting hopes of a rate cut from the Fed. However, the bond market is less enthusiastic, and bonds are selling off across Europe after Forties crude from the North Sea reached a fresh record high above $147 per barrel. Until the Strait of Hormuz is fully open and Gulf energy infrastructure is operational, the bond market is likely to trade with a more cautious tone compared to stocks.
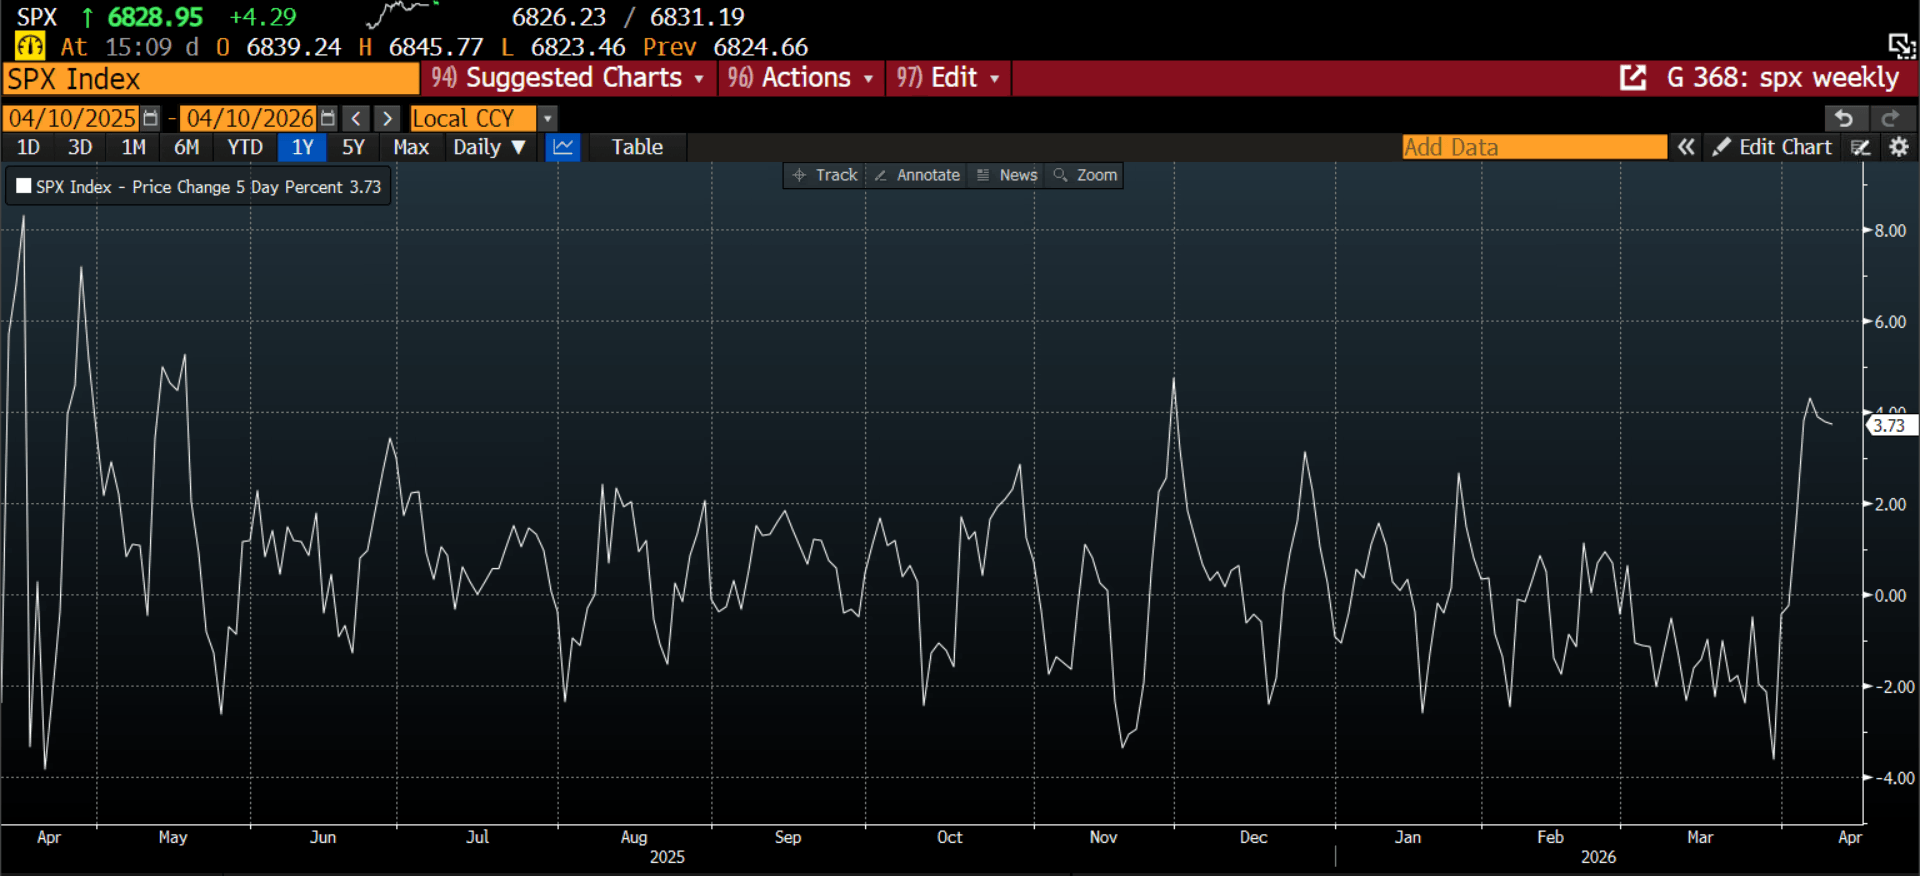
Stocks are on course for their best weekly performance of the year so far, as you can see below, and this has been spurred by the market’s conviction that President Trump will continue with a ceasefire and the conflict in the Middle East is now at its end stages. The Trump reversal index is now back at levels last reached before the war started. The market is pricing for a positive outcome from the negotiations between the US and Iran this weekend, below, we assess potential outcomes from this weekend’s talks and their impact on financial markets:
Peace talks, assessing the potential outcomes
1, Positive outcome: The two sides agree to reopen the Strait of Hormuz, which leads to an immediate reopening of the waterway. An even better outcome would be one without tariffs to pass through the Strait. The oil price is likely to fall back to pre-war levels for Brent, between $75 and $80 per barrel, stocks could surge and bonds will also rally, leading to another sharp decline in global bond yields. We believe there is a low probability, 30% or less, of this perfect outcome happening straight away.
2, Moderate outcome: The negotiations end without a deal, but more talks are expected. The prospect of prolonged negotiations could knock sentiment at the start of next week, but any weakness could fade if there are continued pledges to work towards a lasting peace. While stocks may extend this week’s rally, a high oil price could stymie further gains, especially if there is no concrete plans to reopen the Strait of Hormuz. We think that this is the most likely outcome and think there is a 70-80% chance that further talks will be needed.
3, Negative outcome: The talks fail, both sides walk away and the bombing in Iran and around the Gulf resumes. This could see the oil price reach fresh highs above $120 per barrel for Brent, stocks will tank and bond yields will surge. We believe that this is also a low probability outcome, with 10-15% chance.
Overall, the outcome of negotiations are the main focus for markets as we end the week.
Chart 1: S&P 500, weekly performance chart 1 year
Source: XTB and Bloomberg
The material on this page does not constitute financial advice and does not take into account your level of understanding, investment objectives, financial situation or any other specific needs. All information provided, including opinions, market research, mathematical results and technical analyzes published on the Website or transmitted To you by other means, it is provided for information purposes only and should in no way be construed as an offer or solicitation for a transaction in any financial instrument, nor should the information provided be construed as advice of a legal or financial nature on which any investment decisions you make should be based exclusively To your level of understanding, investment objectives, financial situation, or other specific needs, any decision to act on the information published on the Website or sent to you by other means is entirely at your own risk if you In doubt or unsure about your understanding of a particular product, instrument, service or transaction, you should seek professional or legal advice before trading. Investing in CFDs carries a high level of risk, as they are leveraged products and have small movements Often the market can result in much larger movements in the value of your investment, and this can work against you or in your favor. Please ensure you fully understand the risks involved, taking into account investments objectives and level of experience, before trading and, if necessary, seek independent advice.
The Mexican peso strengthened 0.3% on Friday, trading around 17.31 as markets focused on geopolitical developments, including US–Iran negotiations. Uncertainty in the Middle East, particularly risks around the Strait of Hormuz, continues to support a geopolitical risk premium. The US dollar remains under pressure as US inflation stays broadly in line with expectations and the Federal Reserve maintains a cautious, data-dependent stance, limiting Treasury yield upside. At the same time, resilient but uneven US growth keeps markets balanced between inflation and slowdown risks. Risk appetite supports emerging market currencies, with the peso benefiting from strong carry appeal and a wide interest rate differential versus the US. USD/MXN is down 14.79% this year, reflecting dollar weakness and sustained inflows into Mexican assets.
This analysis from the Overbalance series aims to identify three financial instruments, analyzed primarily on the daily/four-hour (D1/H4) timeframe. The analysis relies solely on the Overbalance methodology, which helps determine points where a trend may continue or where a reversal might occur. Today’s analysis covers three instruments, evaluated solely in terms of 1:1 correction structures.
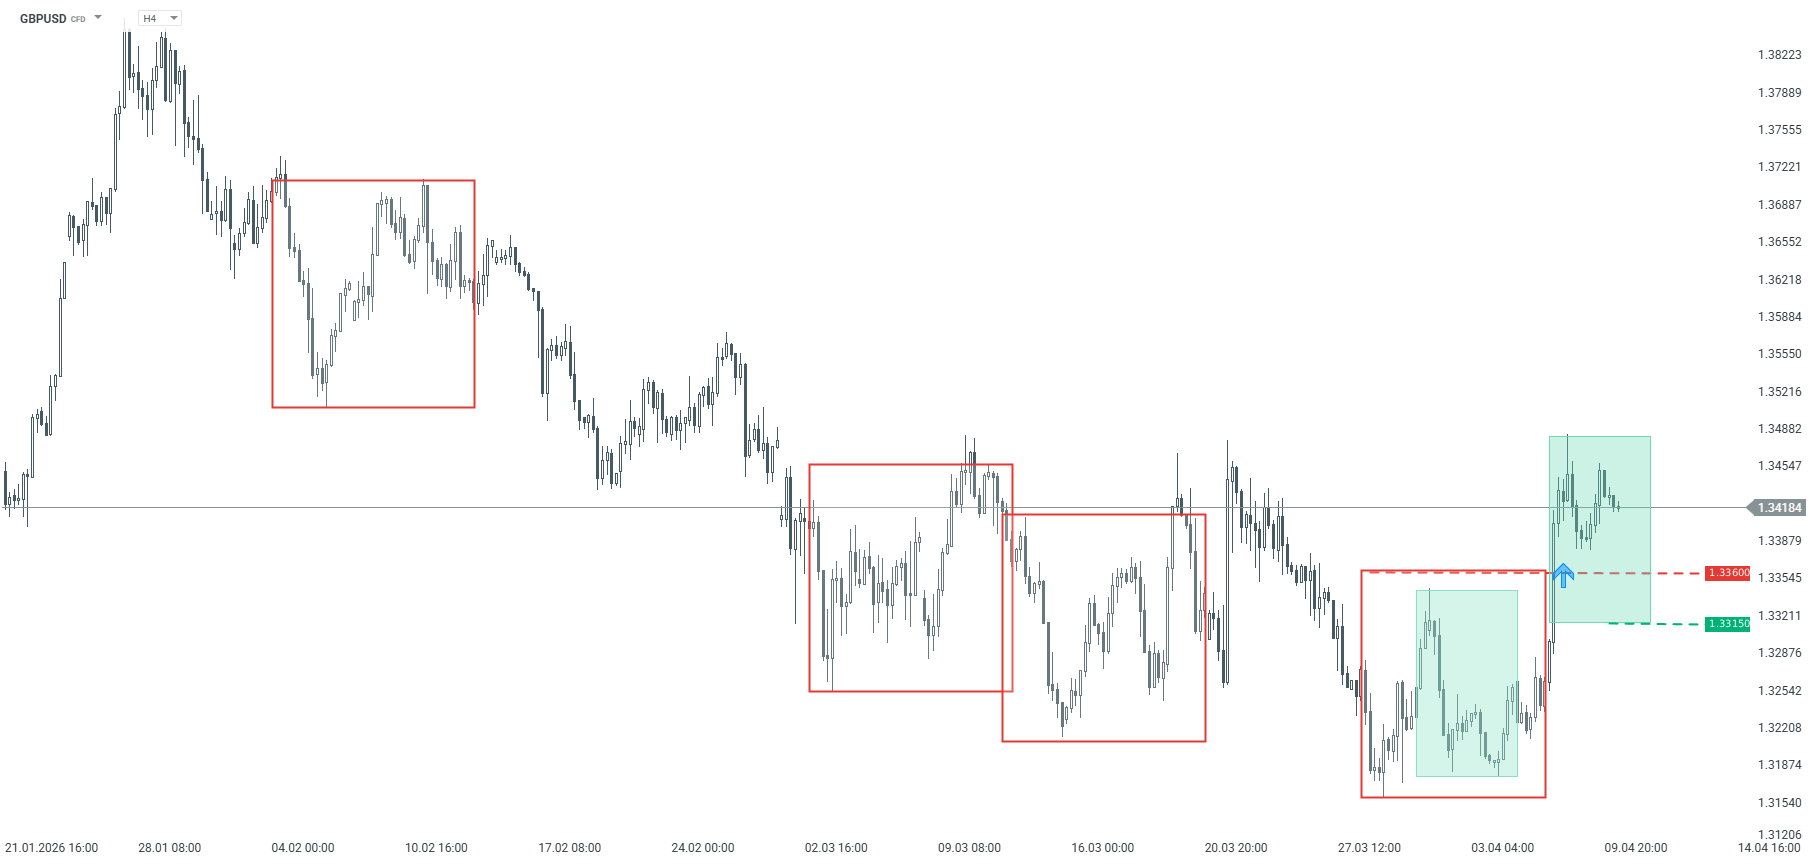
GBPUSD The GBPUSD price has broken its downward trend by rising above the 1.3360 level, which, according to the Overbalance methodology, paves the way for a larger upward correction or even a trend reversal. Currently, the 1.3360 level—the upper boundary of the negated 1:1 geometry—serves as key support. Conversely, for a return to the downtrend, the price would also need to fall below the 1.3315 level, where the lower boundary of the local 1:1 uptrend pattern is located.
GBPUSD – H4 chart. Source: xStation
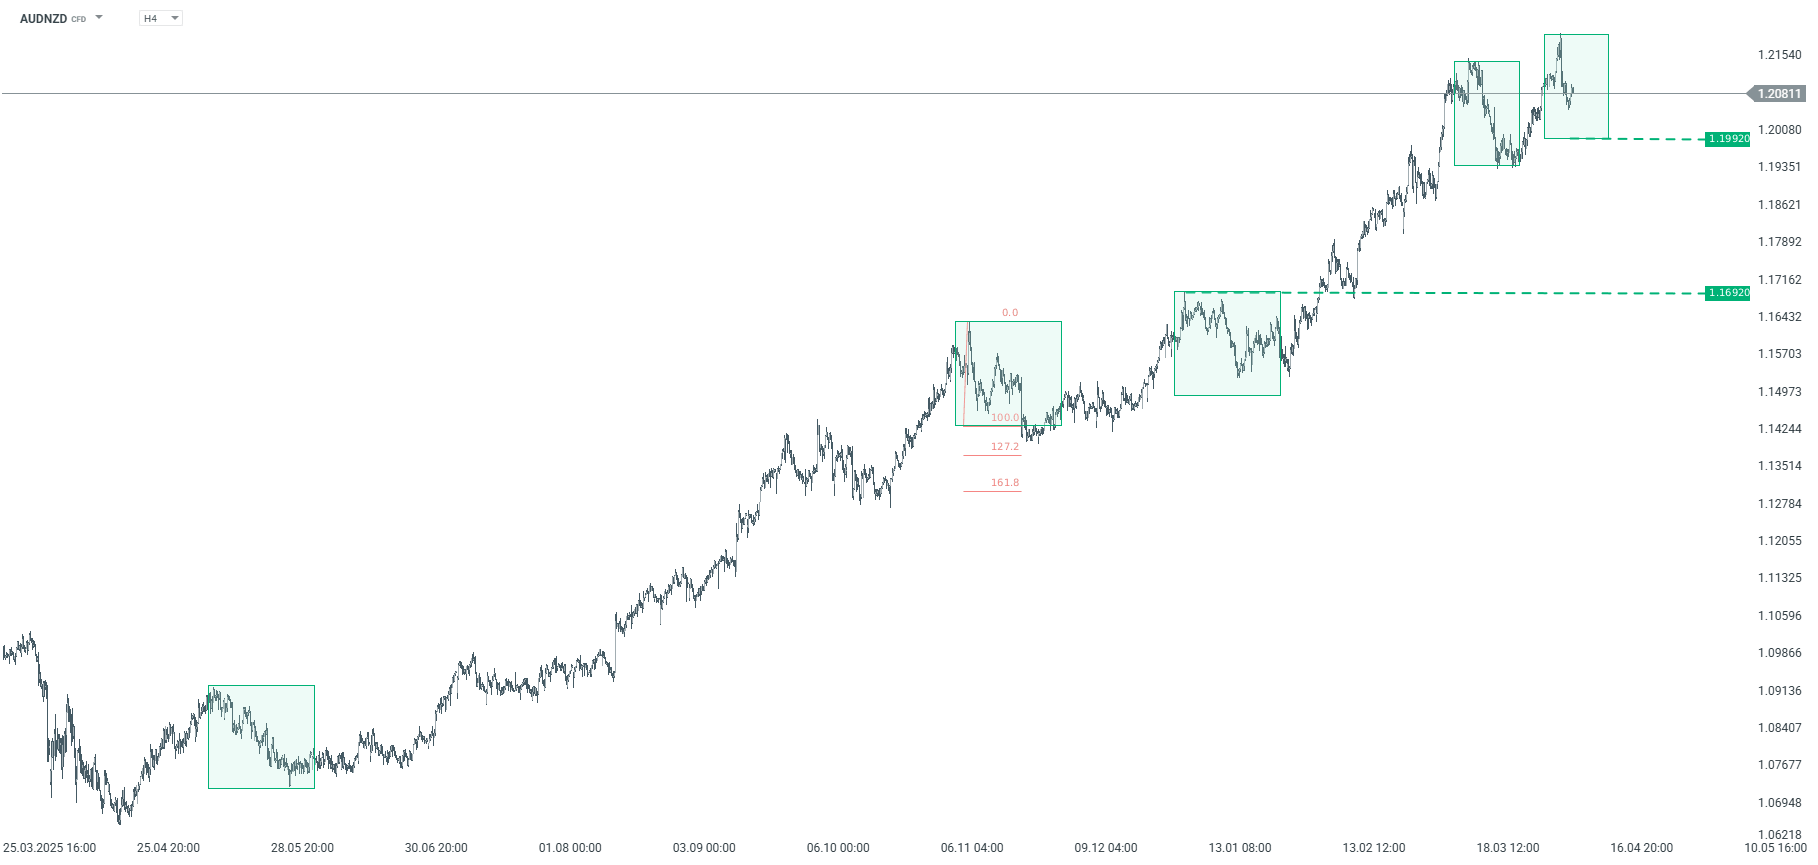
AUDNZD The AUDNZD pair has been in an uptrend for quite some time. The latest correction was exactly the same size as the previous ones, marked by the green rectangle. We are currently observing a local corrective move. If the correction continues, key support based on the Overbalance methodology is at the 0.6992 level, where the lower boundary of the 1:1 pattern is located. As long as the price remains above this level, the uptrend remains in effect.
AUDNZD – H4 timeframe. Source: xStation
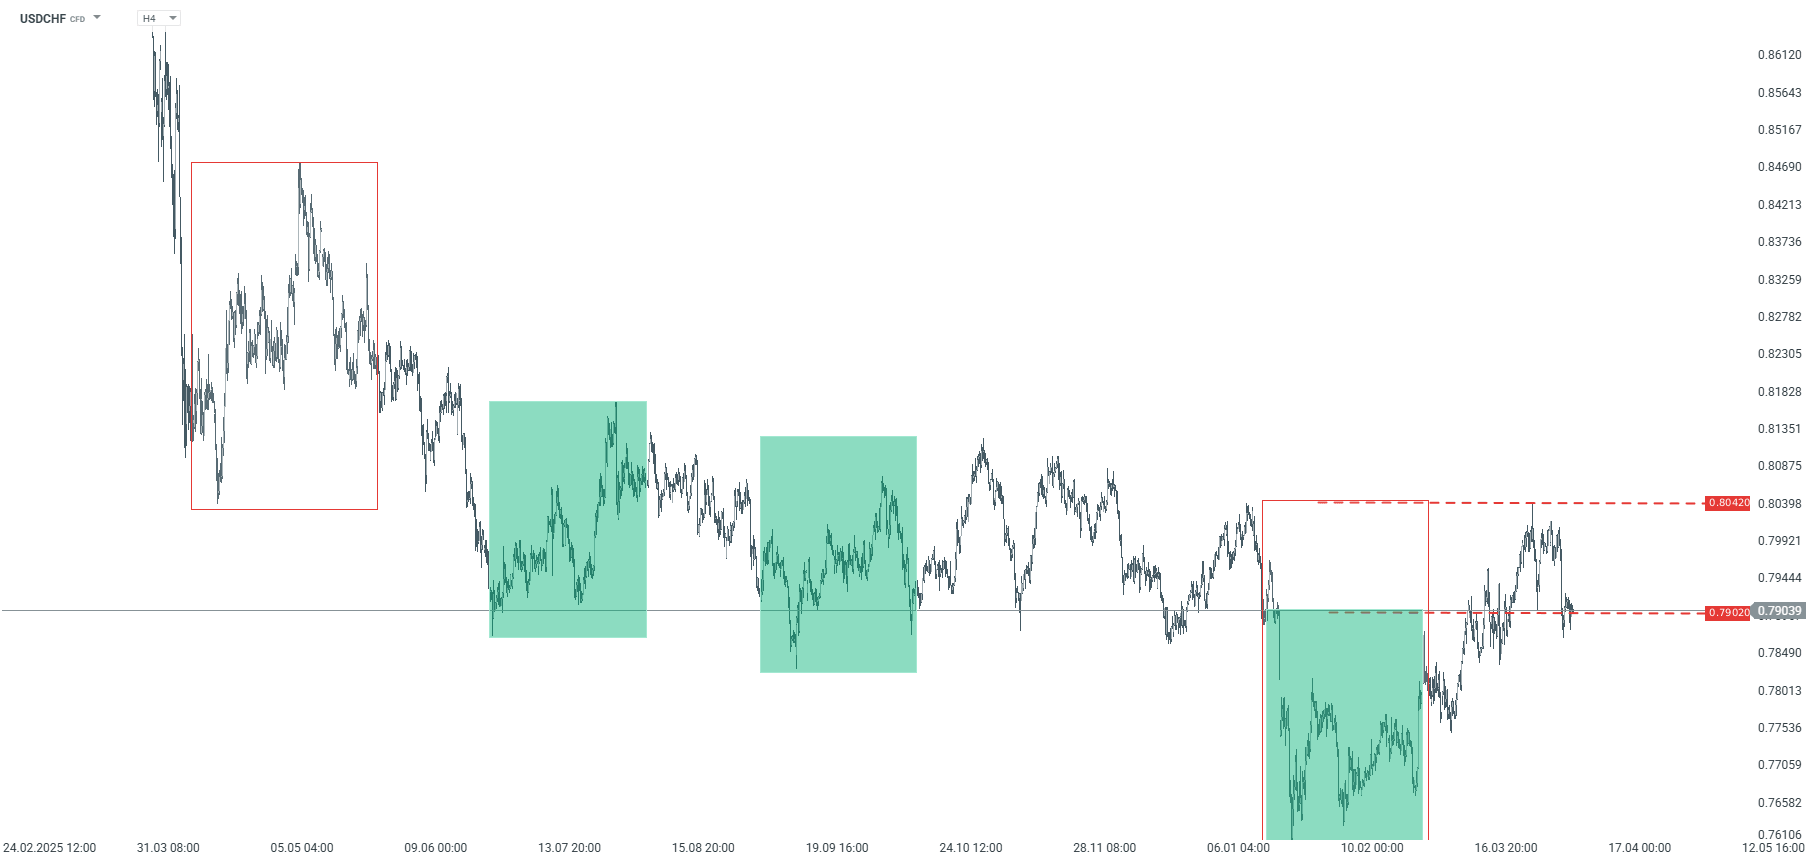
USDCHF USDCHF prices have been trending downward for quite some time, but since late January we have seen a dynamic upward correction. Currently, the price has rebounded from a key resistance level at 0.8042, where the upper boundary of the largest 1:1 pattern is located, which, according to the Overbalance methodology, may signal a return to the downtrend. For this scenario to be confirmed, the price should sustainably fall below the 0.7902 level, where the lower boundary of the smaller pattern is located. In that case, a acceleration of the decline toward recent lows would be possible. Conversely, a break above the 0.8042 level would open the way for further gains.
USDCHF – H4 timeframe. Source: xStation
The material on this page does not constitute financial advice and does not take into account your level of understanding, investment objectives, financial situation or any other specific needs. All information provided, including opinions, market research, mathematical results and technical analyzes published on the Website or transmitted To you by other means, it is provided for information purposes only and should in no way be construed as an offer or solicitation for a transaction in any financial instrument, nor should the information provided be construed as advice of a legal or financial nature on which any investment decisions you make should be based exclusively To your level of understanding, investment objectives, financial situation, or other specific needs, any decision to act on the information published on the Website or sent to you by other means is entirely at your own risk if you In doubt or unsure about your understanding of a particular product, instrument, service or transaction, you should seek professional or legal advice before trading. Investing in CFDs carries a high level of risk, as they are leveraged products and have small movements Often the market can result in much larger movements in the value of your investment, and this can work against you or in your favor. Please ensure you fully understand the risks involved, taking into account investments objectives and level of experience, before trading and, if necessary, seek independent advice.
USD/CAD rises as the commodity-linked Canadian Dollar weakens amid falling oil prices.
WTI drops over 11.5% this week after the US–Iran agreed to a two-week ceasefire, easing supply concerns.
US official confirms Lebanon–Israel talks will be held next week in Washington, DC.
USD/CAD gains ground after four days of losses, trading around 1.3820 during the Asian hours on Friday. The pair appreciates as the commodity-linked Canadian Dollar (CAD) struggles amid lower oil prices, given Canada’s status as the largest crude exporter to the United States (US).
West Texas Intermediate (WTI) oil price holds losses after experiencing volatility, trading around $91.80 per barrel at the time of writing. The WTI price is down by over 11.5% for the week, at the time of writing, after the US and Iran agreed to a two-week ceasefire.
However, crude oil prices may regain ground as Israeli strikes on Lebanon and the ongoing closure of the Strait of Hormuz strain diplomatic efforts. Israeli Prime Minister Benjamin Netanyahu said that there is “no ceasefire in Lebanon” and Israel would continue “to strike Hezbollah with full force” as the country’s military launched fresh strikes.
Reuters reported that a US State Department official confirmed that talks between Lebanon and Israel will take place next week in Washington, DC. “We can confirm that the Department will host a meeting next week to discuss ongoing ceasefire negotiations with Israel and Lebanon,” said a US official.
US Federal Reserve’s (Fed) March Meeting Minutes suggest the central bank remains in a wait-and-see stance, while acknowledging that inflationary risks linked to higher oil prices are becoming more balanced. Traders await the US Consumer Price Inflation (CPI) report due later in the North American session.
EUR/JPY may rise toward the 186.50 level near the ascending channel’s upper boundary.
The Relative Strength Index stands at 65.55, indicating strong upward momentum.
The initial support appears at the nine-day EMA of 184.94.
EUR/JPY extends its gains for the second successive day, trading around 186.10 during the Asian hours on Friday. The technical analysis of the daily chart indicates the currency cross is trending higher within an ascending channel, signaling a persistent bullish bias.
The EUR/JPY cross extends its advance above both the nine-day and 50-day Exponential Moving Averages (EMAs), which reinforce a constructive bullish bias. The rising Relative Strength Index (RSI) at 65.55 sits just below overbought territory, suggesting firm upward momentum.
The EUR/JPY cross may target the immediate resistance at the upper boundary of the ascending channel around 186.50. A break above the channel would reinforce the bullish outlook and open the door toward the all-time high of 186.88, recorded on January 23.
On the downside, the primary support lies at the nine-day EMA of 184.94. A move below this level could weaken the short-term price momentum, exposing the 50-day EMA at 183.76, followed by the channel’s lower boundary around 183.60. A break below this confluence support zone would cause the emergence of the bearish bias and open the doors for the EUR/JPY cross to navigate the region around a four-month low of 180.81, recorded on February 12.
EUR/JPY: Daily Chart
(The technical analysis of this story was written with the help of an AI tool.)
Euro Price Today
The table below shows the percentage change of Euro (EUR) against listed major currencies today. Euro was the strongest against the Australian Dollar.
USD
EUR
GBP
JPY
CAD
AUD
NZD
CHF
USD
0.03%
0.07%
0.10%
0.04%
0.19%
0.17%
0.05%
EUR
-0.03%
0.05%
0.09%
-0.01%
0.17%
0.14%
0.02%
GBP
-0.07%
-0.05%
0.04%
-0.03%
0.11%
0.10%
-0.10%
JPY
-0.10%
-0.09%
-0.04%
-0.07%
0.09%
0.03%
-0.15%
CAD
-0.04%
0.00%
0.03%
0.07%
0.13%
0.12%
-0.07%
AUD
-0.19%
-0.17%
-0.11%
-0.09%
-0.13%
-0.02%
-0.22%
NZD
-0.17%
-0.14%
-0.10%
-0.03%
-0.12%
0.02%
-0.20%
CHF
-0.05%
-0.02%
0.10%
0.15%
0.07%
0.22%
0.20%
The heat map shows percentage changes of major currencies against each other. The base currency is picked from the left column, while the quote currency is picked from the top row. For example, if you pick the Euro from the left column and move along the horizontal line to the US Dollar, the percentage change displayed in the box will represent EUR (base)/USD (quote).
USD/CHF weakens to around 0.7905 in Friday’s early European session.
Further consolidation cannot be ruled out as the pair remains capped below the Bollinger Bands’ 20-day SMA, with neutral RSI.
The immediate resistance level emerges at 0.7930; the initial support level is seen at 0.7895.
The US March CPI inflation report is due later on Friday.
The USD/CHF pair loses ground to near 0.7905 during the early European session on Friday. A fragile two-week ceasefire between the United States (US) and Iran provides some support to a safe-haven currency such as the Swiss Franc (CHF) against the US Dollar (USD).
Ahead of the US and Iran talks in Pakistan, Israel continues to bombard Lebanon after killing more than 300 people and injuring at least 1,150 in a single day of strikes across the country on Wednesday. Earlier Friday, Israeli Prime Minister Benjamin Netanyahu said that there is “no ceasefire in Lebanon” and Israel would continue “to strike Hezbollah with full force” as the country’s military launched fresh strikes.
Traders will closely monitor the US March Consumer Price Index (CPI) inflation report later on Friday. The headline CPI is projected to see a rise of 3.3% YoY in March, compared to 2.4% in February, driven by soaring oil prices due to the Middle East war. Any signs of hotter inflation in the US could boost the Greenback against the CHF in the near term.
Technical Analysis:
In the daily chart, USD/CHF is hovering just above the 100-day exponential moving average (EMA) at 0.7893, which lends nearby support, but it remains capped by the Bollinger Bands’ 20-day simple moving average around 0.7932, keeping the broader tone neutral and range-bound. The Relative Strength Index (RSI) at 49 is essentially flat, hinting that directional conviction is lacking after the recent pullback from higher levels.
On the topside, initial resistance is located at the Bollinger midline/20-day SMA near 0.7930, with a break there exposing the upper Bollinger band at roughly 0.8032 as the next hurdle. On the downside, immediate support is seen at the 100-day EMA at 0.7895; a clear break below this level would open the way toward the lower Bollinger band support around 0.7832, where buyers could look to defend the broader range.
🇦🇺 AUD / 🇨🇦 CAD — Australian Dollar / Canadian Dollar
🇪🇺 EUR / 🇯🇵 JPY — Euro / Japanese Yen
🇬🇧 GBP / 🇯🇵 JPY — British Pound / Japanese Yen
🇦🇺 AUD / 🇳🇿 NZD — Australian Dollar / New Zealand Dollar
🇪🇺 EUR / 🇬🇧 GBP — Euro / British Pound
🇪🇺 EUR / 🇦🇺 AUD — Euro / Australian Dollar
🇬🇧 GBP / 🇨🇦 CAD — British Pound / Canadian Dollar
🇪🇺 EUR / 🇨🇦 CAD — Euro / Canadian Dollar
Manage Consent
To provide the best experiences, we use technologies like cookies to store and/or access device information. Consenting to these technologies will allow us to process data such as browsing behavior or unique IDs on this site. Not consenting or withdrawing consent, may adversely affect certain features and functions.
Functional
Always active
The technical storage or access is strictly necessary for the legitimate purpose of enabling the use of a specific service explicitly requested by the subscriber or user, or for the sole purpose of carrying out the transmission of a communication over an electronic communications network.
Preferences
The technical storage or access is necessary for the legitimate purpose of storing preferences that are not requested by the subscriber or user.
Statistics
The technical storage or access that is used exclusively for statistical purposes.The technical storage or access that is used exclusively for anonymous statistical purposes. Without a subpoena, voluntary compliance on the part of your Internet Service Provider, or additional records from a third party, information stored or retrieved for this purpose alone cannot usually be used to identify you.
Marketing
The technical storage or access is required to create user profiles to send advertising, or to track the user on a website or across several websites for similar marketing purposes.