🇪🇺 EUR / 🇺🇸 USD — Euro / US Dollar
🇺🇸 USD / 🇯🇵 JPY — US Dollar / Japanese Yen
🇬🇧 GBP / 🇺🇸 USD — British Pound / US Dollar
🇦🇺 AUD / 🇺🇸 USD — Australian Dollar / US Dollar
🇺🇸 USD / 🇨🇦 CAD — US Dollar / Canadian Dollar
🇺🇸 USD / 🇨🇭 CHF — US Dollar / Swiss Franc
🇳🇿 NZD / 🇺🇸 USD — New Zealand Dollar / US Dollar
🇦🇺 AUD / 🇨🇦 CAD — Australian Dollar / Canadian Dollar
🇪🇺 EUR / 🇯🇵 JPY — Euro / Japanese Yen
🇳🇿 NZD / 🇨🇦 CAD — New Zealand Dollar / Canadian Dollar
🇬🇧 GBP / 🇯🇵 JPY — British Pound / Japanese Yen
🇦🇺 AUD / 🇳🇿 NZD — Australian Dollar / New Zealand Dollar
🇪🇺 EUR / 🇬🇧 GBP — Euro / British Pound
🇪🇺 EUR / 🇦🇺 AUD — Euro / Australian Dollar
🇬🇧 GBP / 🇨🇦 CAD — British Pound / Canadian Dollar
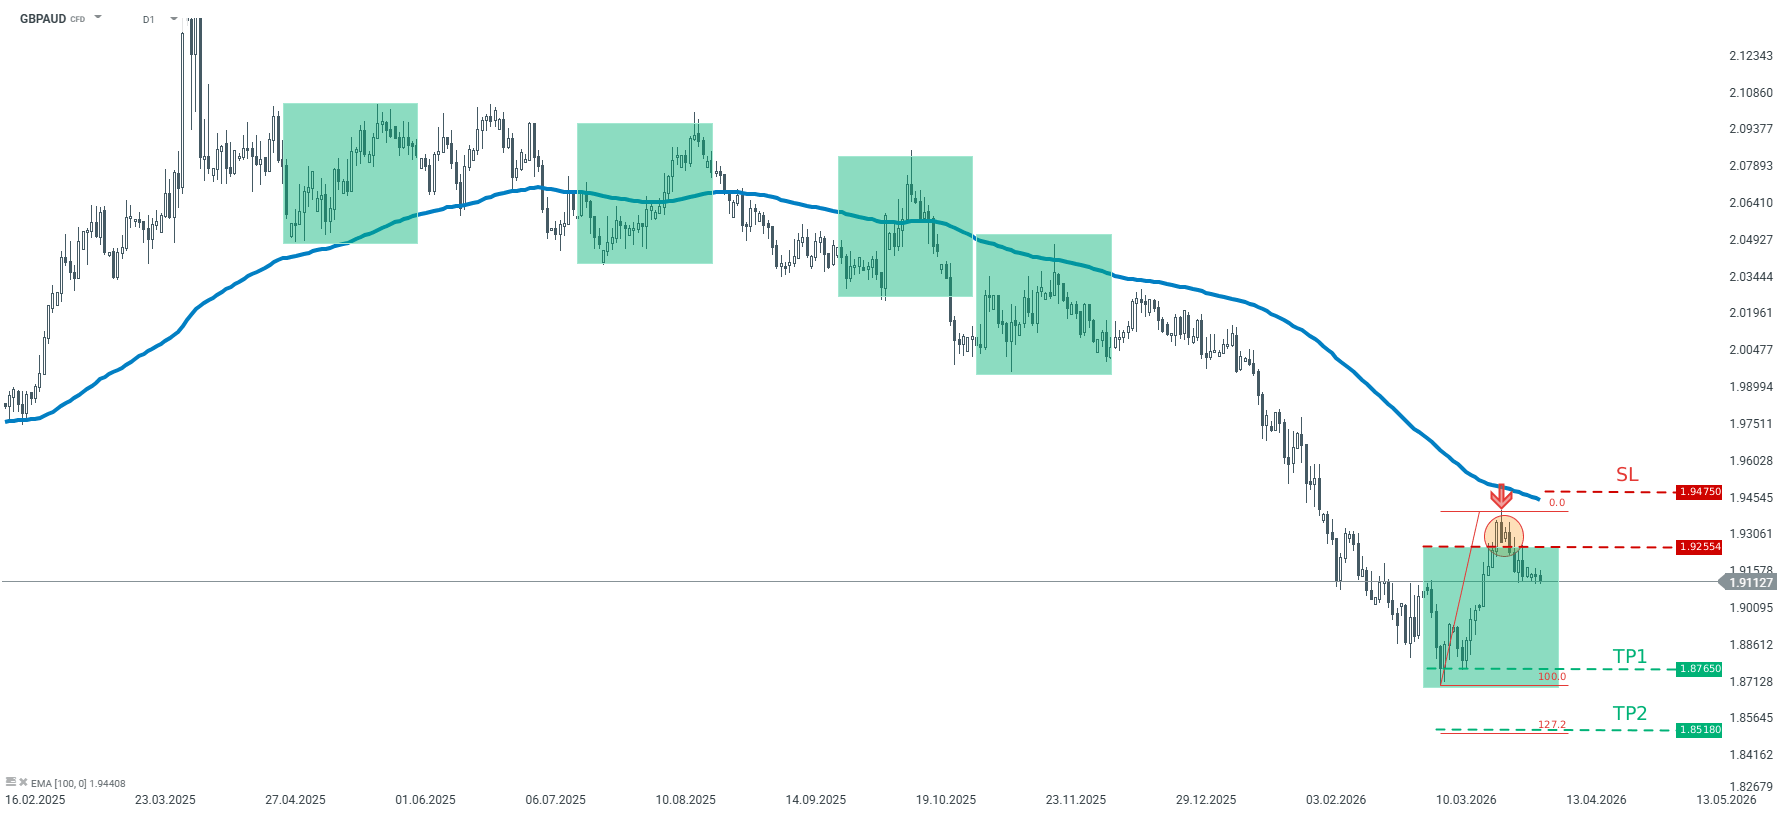
🇬🇧 GBP / 🇦🇺 AUD — British Pound / Australian Dollar
🇪🇺 EUR / 🇨🇦 CAD — Euro / Canadian Dollar
🇦🇺 AUD / 🇯🇵 JPY — Australian Dollar / Japanese Yen
🇪🇺 EUR / 🇨🇭 CHF — Euro / Swiss Franc
🇨🇭 CHF / 🇯🇵 JPY — Swiss Franc / Japanese Yen
🇨🇦 CAD / 🇯🇵 JPY — Canadian Dollar / Japanese Yen
🇦🇺 AUD / 🇨🇭 CHF — Australian Dollar / Swiss Franc
🇬🇧 GBP / 🇳🇿 NZD — British Pound / New Zealand Dollar
🇬🇧 GBP / 🇨🇭 CHF — British Pound / Swiss Franc
🇨🇦 CAD / 🇨🇭 CHF — Canadian Dollar / Swiss Franc
🇪🇺 EUR / 🇳🇿 NZD — Euro / New Zealand Dollar
🇺🇸 USD / 🇲🇽 MXN — US Dollar / Mexican Peso
🇺🇸 USD / 🇨🇳 CNH — US Dollar / Chinese Yuan
🇺🇸 USD / 🇸🇪 SEK — US Dollar / Swedish Krona
🇺🇸 USD / 🇳🇴 NOK — US Dollar / Norwegian Krone
🇬🇧 GBP / 🇸🇪 SEK — British Pound / Swedish Krona
🇺🇸 USD / 🇿🇦 ZAR — US Dollar / South African Rand
🇪🇺 EUR / 🇳🇴 NOK — Euro / Norwegian Krone
🇬🇧 GBP / 🇲🇽 MXN — British Pound / Mexican Peso
🇺🇸 USD / 🇮🇱 ILS — US Dollar / Israeli Shekel
🇪🇺 EUR / 🇷🇺 RUB — Euro / Russian Ruble
🇪🇺 EUR / 🇹🇷 TRY — Euro / Turkish Lira
🇨🇦 CAD / 🇲🇽 MXN — Canadian Dollar / Mexican Peso
🇪🇺 EUR / 🇮🇱 ILS — Euro / Israeli Shekel
🇺🇸 USD / 🇧🇷 BRL — US Dollar / Brazilian Real
🇪🇺 EUR / 🇵🇱 PLN — Euro / Polish Zloty
🇺🇸 USD / 🇹🇷 TRY — US Dollar / Turkish Lira
🇳🇿 NZD / 🇯🇵 JPY — New Zealand Dollar / Japanese Yen


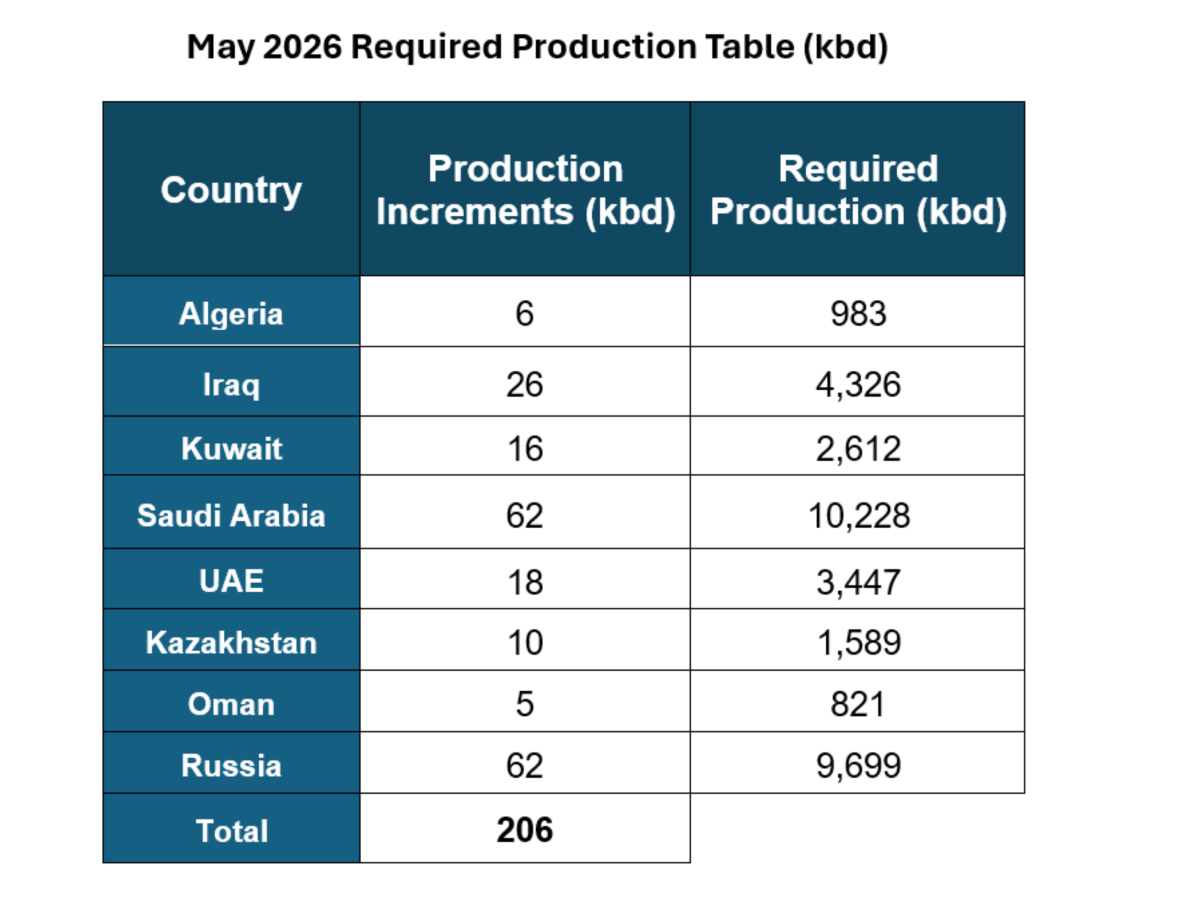 New production quotas for countries in the agreement on voluntary production cuts. It is worth noting that countries like Iraq, Kuwait, Saudi Arabia, the UAE, and also Russia have significantly reduced their production volumes recently. Source: OPEC
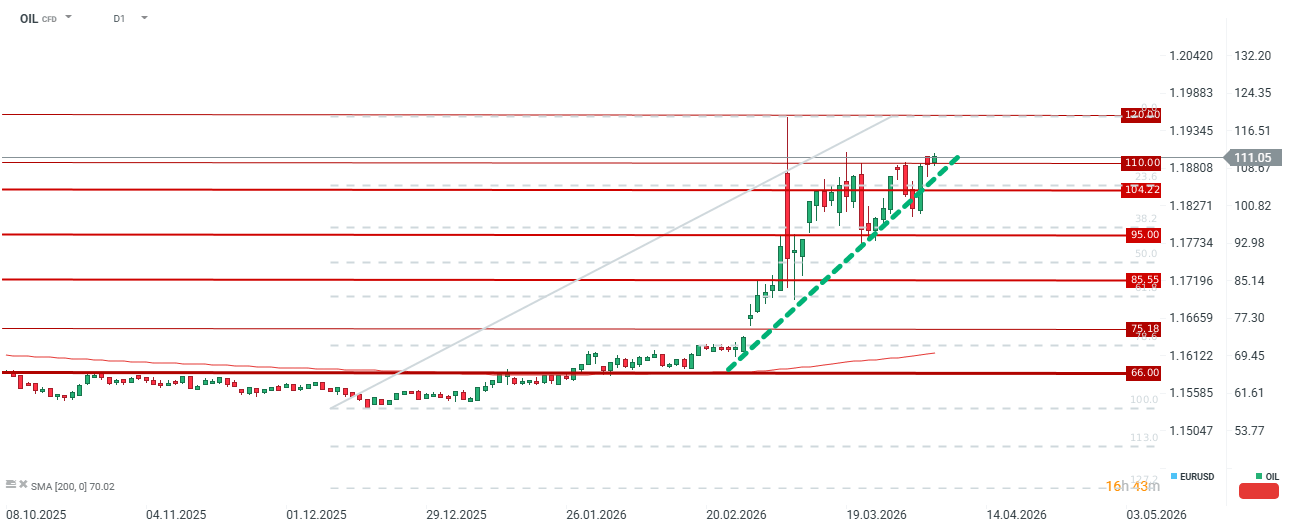 Oil is currently in a zone of strong supply and is no longer reacting as dynamically as it was a few days ago. The Strait of Hormuz remains closed, but some ships are passing through, so prices may be under slight pressure. Nevertheless, a few ships will not lead to a significant improvement in the global supply situation. Source: xStation5
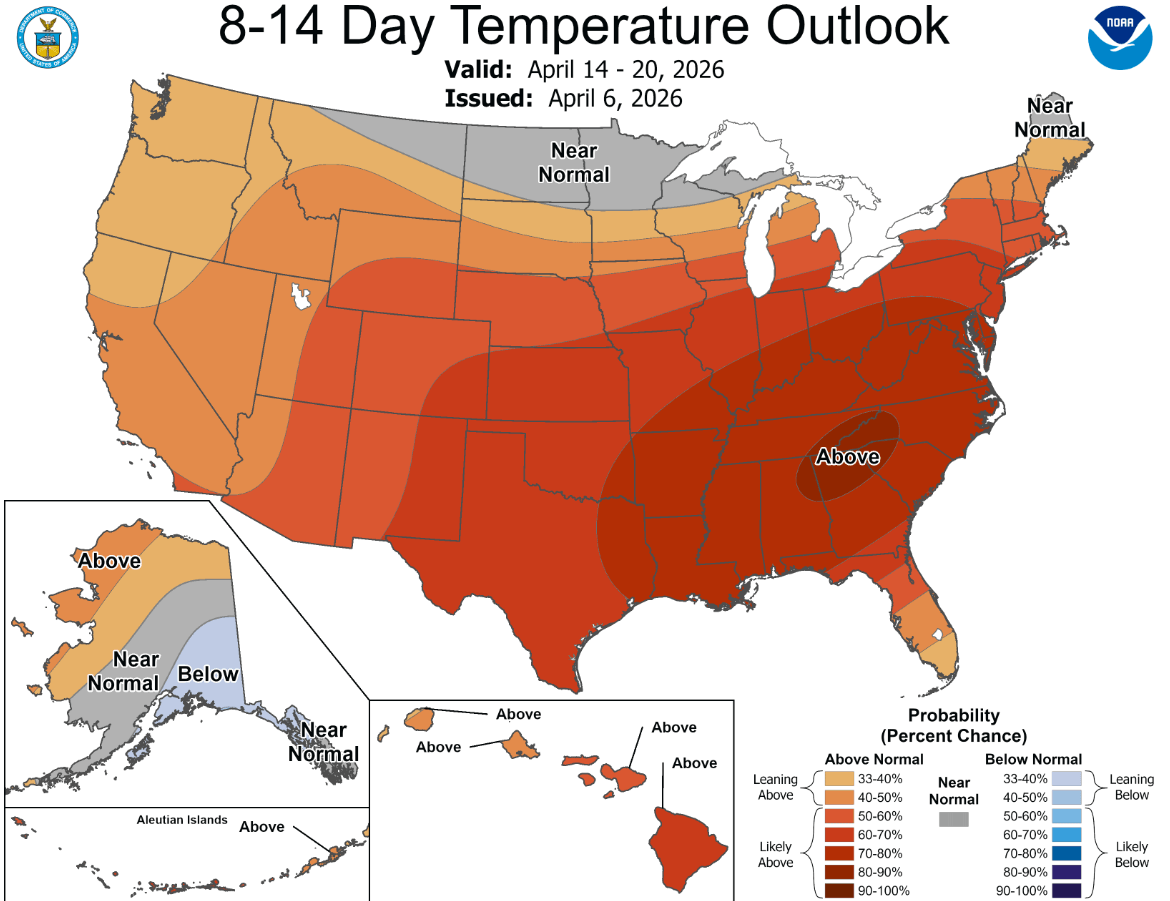 Forecasts for the next 2 weeks indicate that temperatures will be higher than standard. This means that gas consumption for heating purposes should be minimal. Nevertheless, seasonal forecasts suggest that in the summer period, temperatures should also be higher, which means higher consumption in the future. Source: NOAA
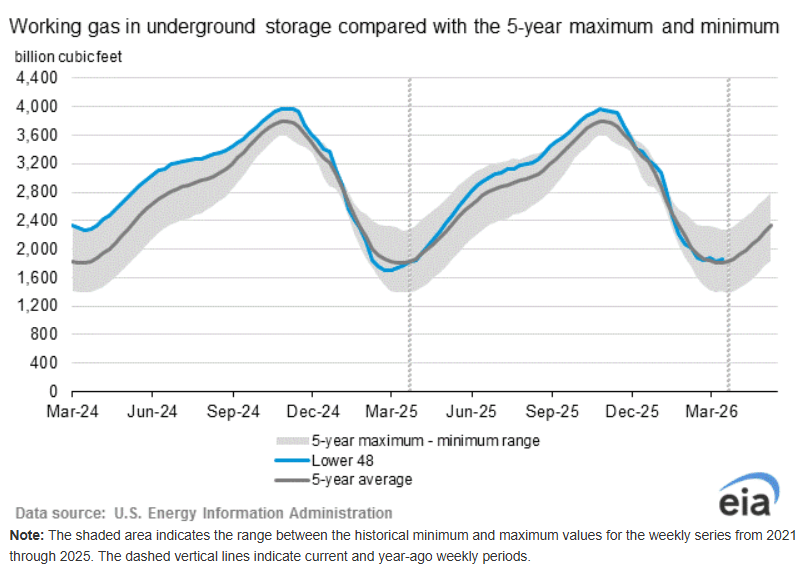 Gas inventories have fallen toward the 5-year average, but are now starting to rebound. In March, we had 2 reports that showed a rebound in inventories, despite the theoretical duration of the heating season. Source: EIA
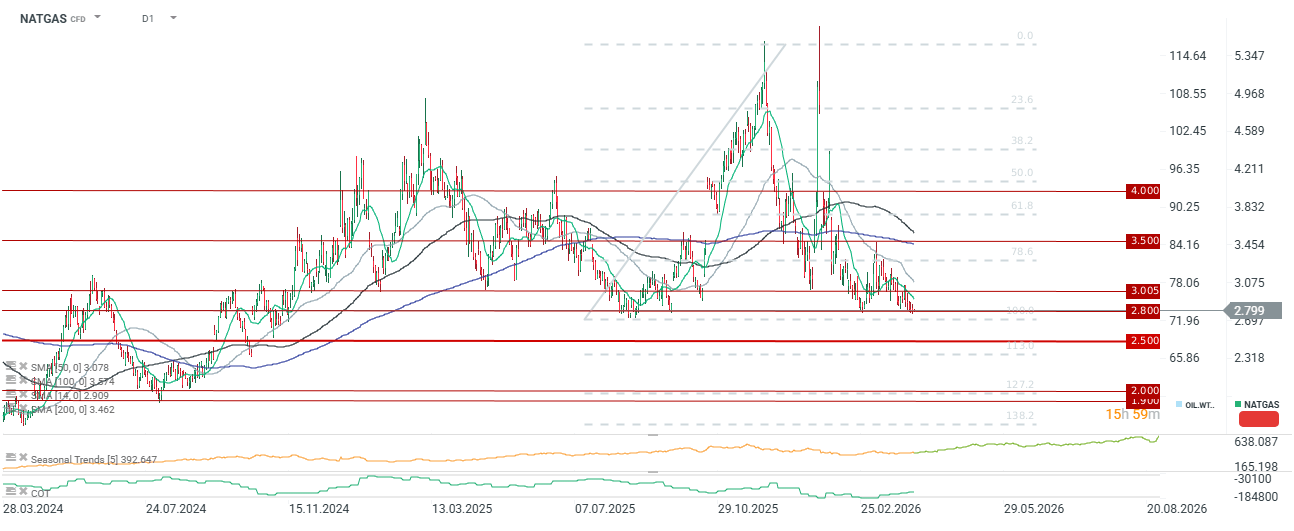 The price is at very important support around $2.8/MMBTU. Source: xStation5
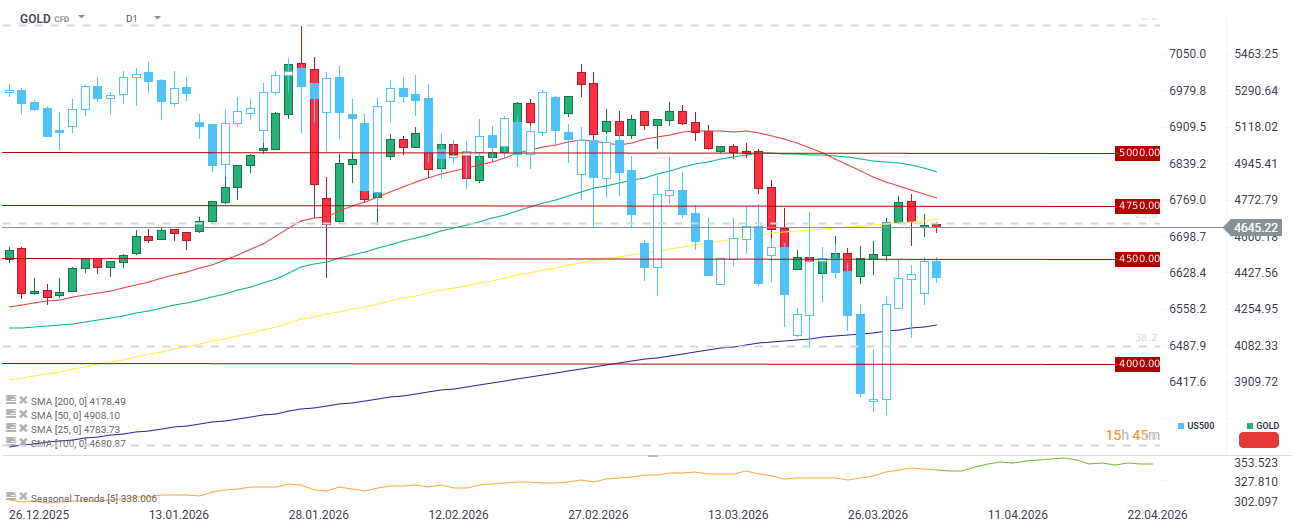 The correlation between the price of gold and the US500 has been quite high since almost the beginning of this year. Nevertheless, the scale of the US500 rebound recently does not coincide so strongly with the rebound in the gold price. Source: xStation5
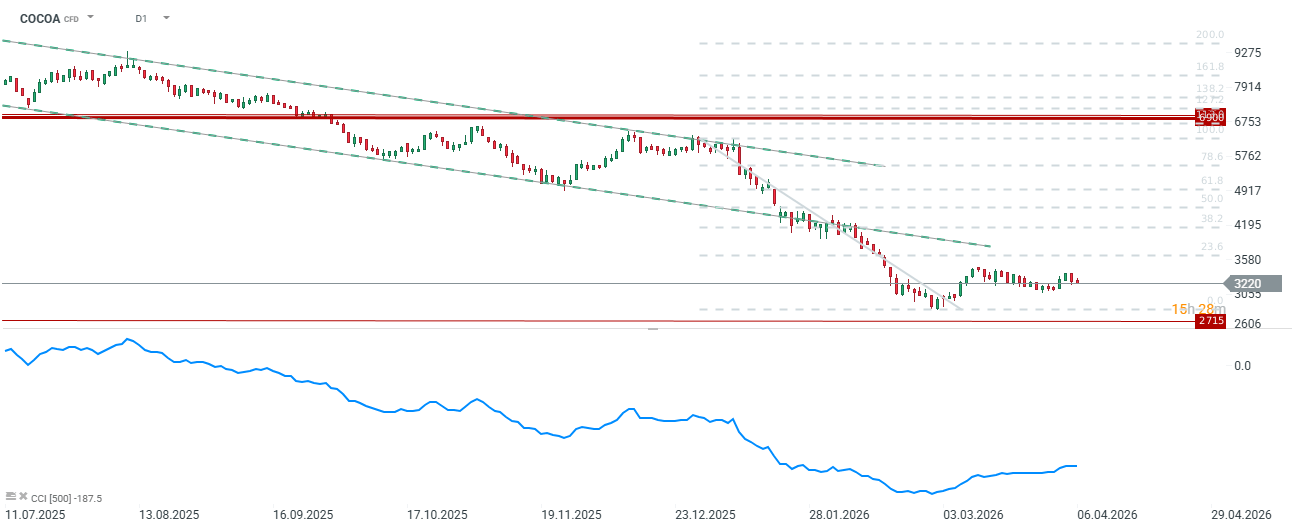 The cocoa price remains at low levels due to the lack of signs of a demand rebound. Theoretically, we should observe an improvement in the second half of this year after the exhaustion of inventories from previous years. Source: xStation5


