USD/JPY gains ground to near 159.35 in Friday’s Asian session.
Trump said the next meeting between the US and Iran might take place over the weekend.
Japan’s Katayama hinted at the JPY intervention after talks with the US counterpart.
The USD/JPY pair gathers strength around 159.35 during the Asian trading hours on Friday. The pair extends the rally for the third consecutive day amid uncertainty in the Middle East. However, heightening intervention warnings from Japanese officials might cap the upside for USD/JPY.
US President Donald Trump said on Thursday that Israel and Lebanon agreed to a 10-day ceasefire. The uncertainty in the Middle East remains high as the Lebanese army stated on Friday that it recorded multiple ceasefire violations by Israel after the truce went into effect at midnight local time on Friday. Rising tensions in the Middle East could boost the US Dollar (USD) against the Japanese Yen (JPY).
Traders will closely monitor a second round of negotiations between the US and Iran that could take place this weekend. Earlier on Thursday, Trump expressed optimism about the possibility that the US and Iran could clinch a permanent ceasefire ahead of its expiration next week.
Intervention fears from Japanese authorities could underpin the JPY and create a tailwind for the pair. Japan’s Finance Minister Satsuki Katayama said on Thursday that she’s held close discussions on foreign exchange issues with US Treasury Secretary Scott Bessent and that authorities are prepared for “bold” action if needed.
Earlier Friday, Bank of Japan (BoJ) Governor Kazuo Ueda said that a decision on how soon to raise interest rates must take into account the fact that the nation’s real interest rate is low. He added that Japan is facing rising inflation from a “negative supply shock,” which is more difficult to rein in with monetary policy than inflation driven by strong demand.
GBP/USD stays pressured as traders trim BoE hike bets amid optimism of easing Middle East tensions.
BoE’s Bailey said that the central bank won’t rush rate decisions amid the energy shock from the Iran conflict.
Lebanon’s army recorded multiple Israeli ceasefire violations after the truce took effect.
GBP/USD loses ground for the third successive day, trading around 1.3520 during the Asian hours on Friday. The Pound Sterling (GBP) remains under pressure as traders pare back expectations for a Bank of England (BoE) rate hike, amid increasing optimism that tensions in the Middle East may be easing.
BoE Governor Andrew Bailey told BBC News on Thursday that the central bank is “not going to rush to judgments” on interest rate increases as global policymakers navigate an energy price shock driven by the Iran conflict. Bailey noted that while higher oil and gas prices will feed into inflation, other factors make rate decisions “very, very difficult.”
BoE policymaker Megan Greene said in a Bloomberg TV interview on Wednesday that markets were justified in scaling back bets on rate hikes following last month’s surge. Greene indicated that the current market pricing, suggesting two or fewer rate increases this year, is “about right.”
The GBP/USD pair also declines as the US Dollar (USD) edges higher, supported by increased safe-haven demand following a CNN report that the Lebanese army recorded multiple ceasefire violations by Israel after the truce came into effect. US President Donald Trump announced on Thursday that Israel and Lebanon agreed to a 10-day ceasefire that started at 5 PM ET.
Lebanon accused Israel of carrying out “a number of acts of aggression,” noting that intermittent shelling has affected several villages in southern Lebanon. The army also urged residents to delay returning to southern towns and villages amid the reported ceasefire breaches.
However, market sentiment could improve as Washington and Tehran are expected to resume discussions over the weekend, with President Trump maintaining an optimistic tone on the chances that both sides could secure a lasting ceasefire before its expiration next week.
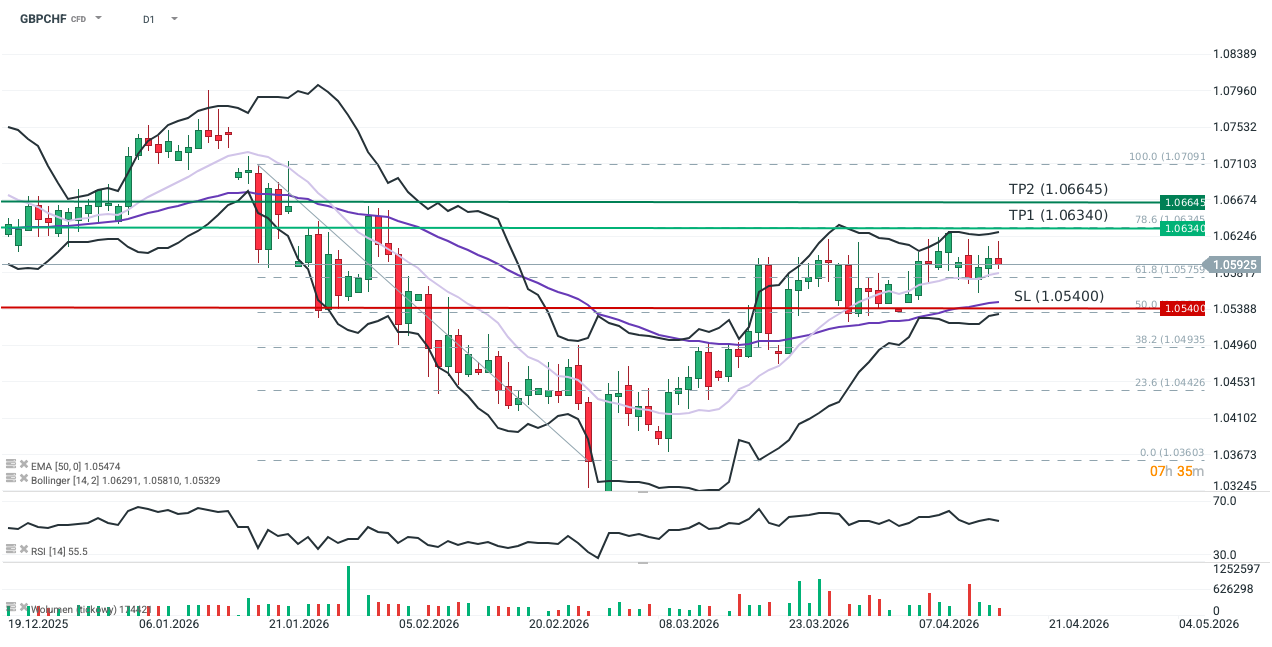
GBPCHF pair moved back above the 14-day exponential moving average (EMA14; light purple) yesterday, despite a brief dip below 1.058 during the early session.
One week Risk Reversal indicator has reached its highest level since July 2024.
The GBPCHF sell-off triggered by the outbreak of conflict in the Middle East capped months of Sterling weakness, driven by growth concerns and expectations of UK rate cuts. Approximately one week after the US and Israeli strikes on Iran, the pair initiated an upward trajectory. This shift is supported by the UK’s significant exposure to surging natural gas prices, which increases the risk of an inflationary rebound and a return to interest rate hikes.
Following a correction earlier this week, the pair is gradually rebounding, confirming the ongoing trend. While the UK still faces a high risk of stagflation, today’s GDP data (+0.5% m/m; exceeding the Reuters consensus of 0.1%) has somewhat cooled recession fears amid energy price inflation. Growing optimism is also reflected in the options market: the 1-week Risk Reversal is at its highest since July 2024, indicating a decrease in hedging demand against Sterling declines (i.e., fewer PUT options).
Sterling should remain supported against the Franc in the short term, regardless of further developments in the Strait of Hormuz. In an escalation scenario, concerns over energy price pressure would exert symmetrical pressure on the Bank of England to resume rate hikes (the market currently prices one 25 bps hike for September). Conversely, de-escalation would reduce fears of economic stagnation and dampen demand for safe-haven assets, including the Franc. It is worth noting that the Franc also lost ground against the Dollar in March, suggesting it was not the primary choice for investors seeking a “safe harbor” for capital.
Methodology
This recommendation was prepared based on a technical analysis of the GBPCHF chart and a fundamental analysis of the respective economies (focusing on UK monetary policy).
Directional Bias: Established using moving averages, price action, and market expectations regarding central bank responses to the Middle East conflict.
Exit Strategy: Target and Stop Loss levels were determined using Fibonacci retracements of the latest downward leg, Bollinger Bands, and Price Action. TP1: Set at the 78.6% Fibonacci level, coinciding with the upper Bollinger Band on the 14-day interval. TP2: Set at the resistance level established between February 2nd and 3rd. Stop Loss: Placed at the 50% Fibonacci level, which coincides with the lower Bollinger Band and the 50-day EMA.
TP1: Set at the 78.6% Fibonacci level, coinciding with the upper Bollinger Band on the 14-day interval.
TP2: Set at the resistance level established between February 2nd and 3rd.
Stop Loss: Placed at the 50% Fibonacci level, which coincides with the lower Bollinger Band and the 50-day EMA.
What is the technical outlook for USDJPY, EURNZD, and NZDUSD?
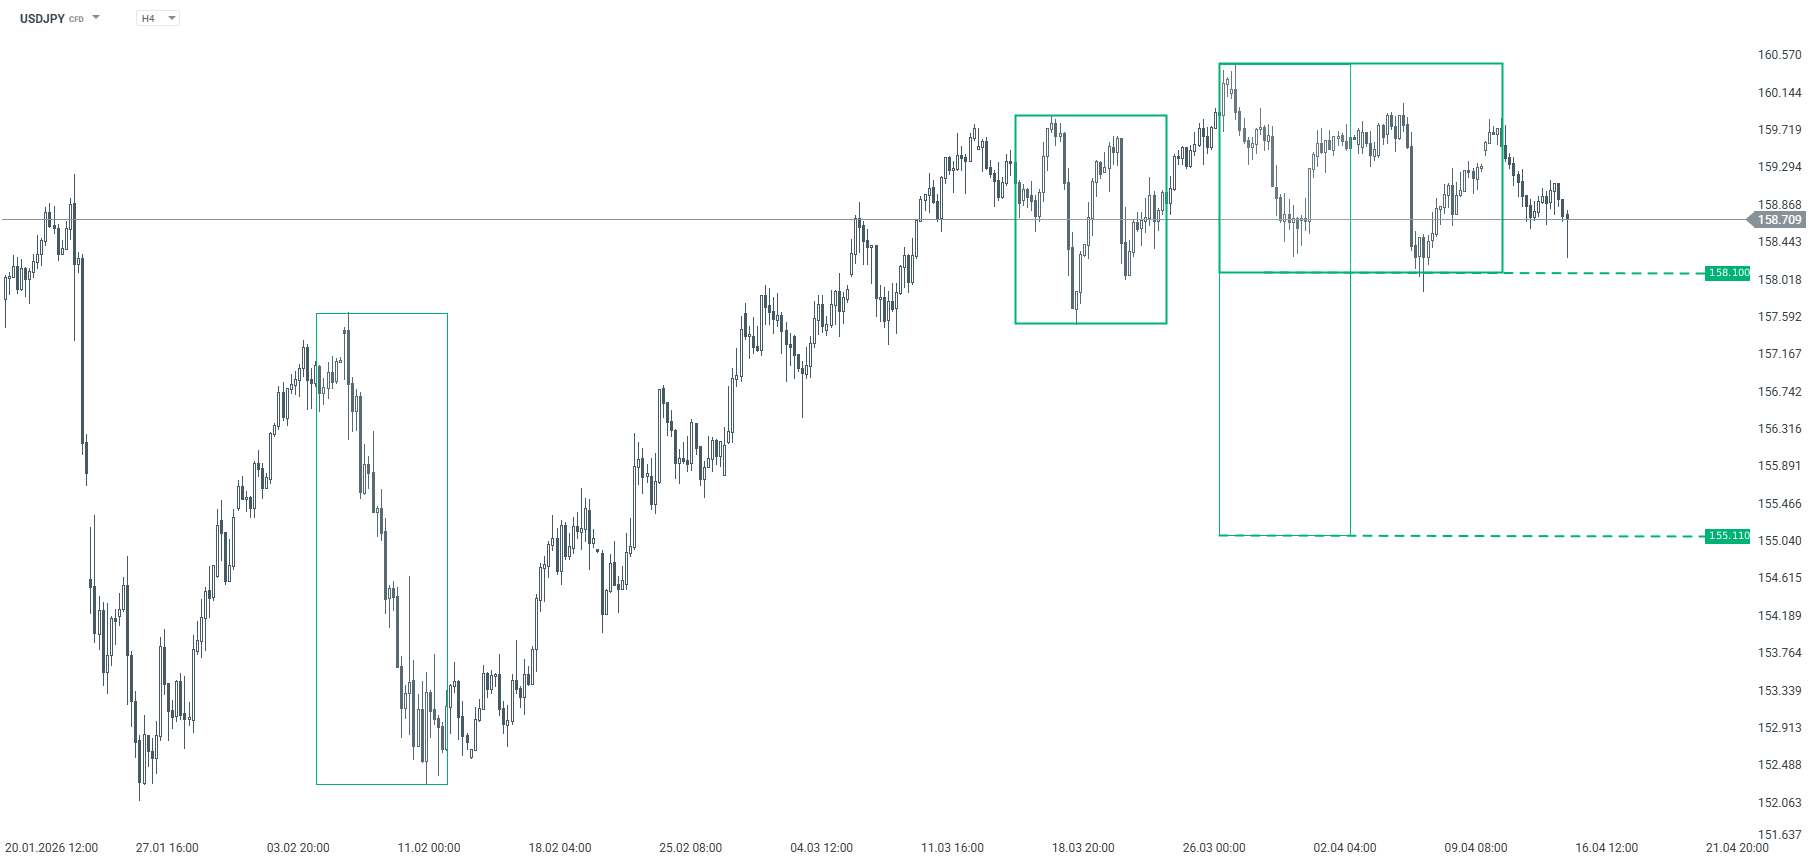
The Overbalance analysis aims to identify three financial instruments, analyzed primarily on the daily/four-hour (D1/H4) timeframe. The analysis uses only the Overbalance methodology, which helps determine where a trend may continue or where it may reverse. Today’s analysis covers three instruments, evaluated solely in terms of 1:1 correction structures. USDJPY USDJPY has been trending upward for quite some time. Looking back to the lows in February, the largest correction was around 230 pips. The current correction is of a similar magnitude, which allows us to identify key support at the 158.10 level, derived from the 1:1 ratio. According to the Overbalance methodology, as long as this level is not broken, the uptrend remains in effect. If it is broken, the correction could deepen, and the next significant support would be at 155.11, where the lower boundary of a larger 1:1 pattern with a range of approximately 530 pips is located.
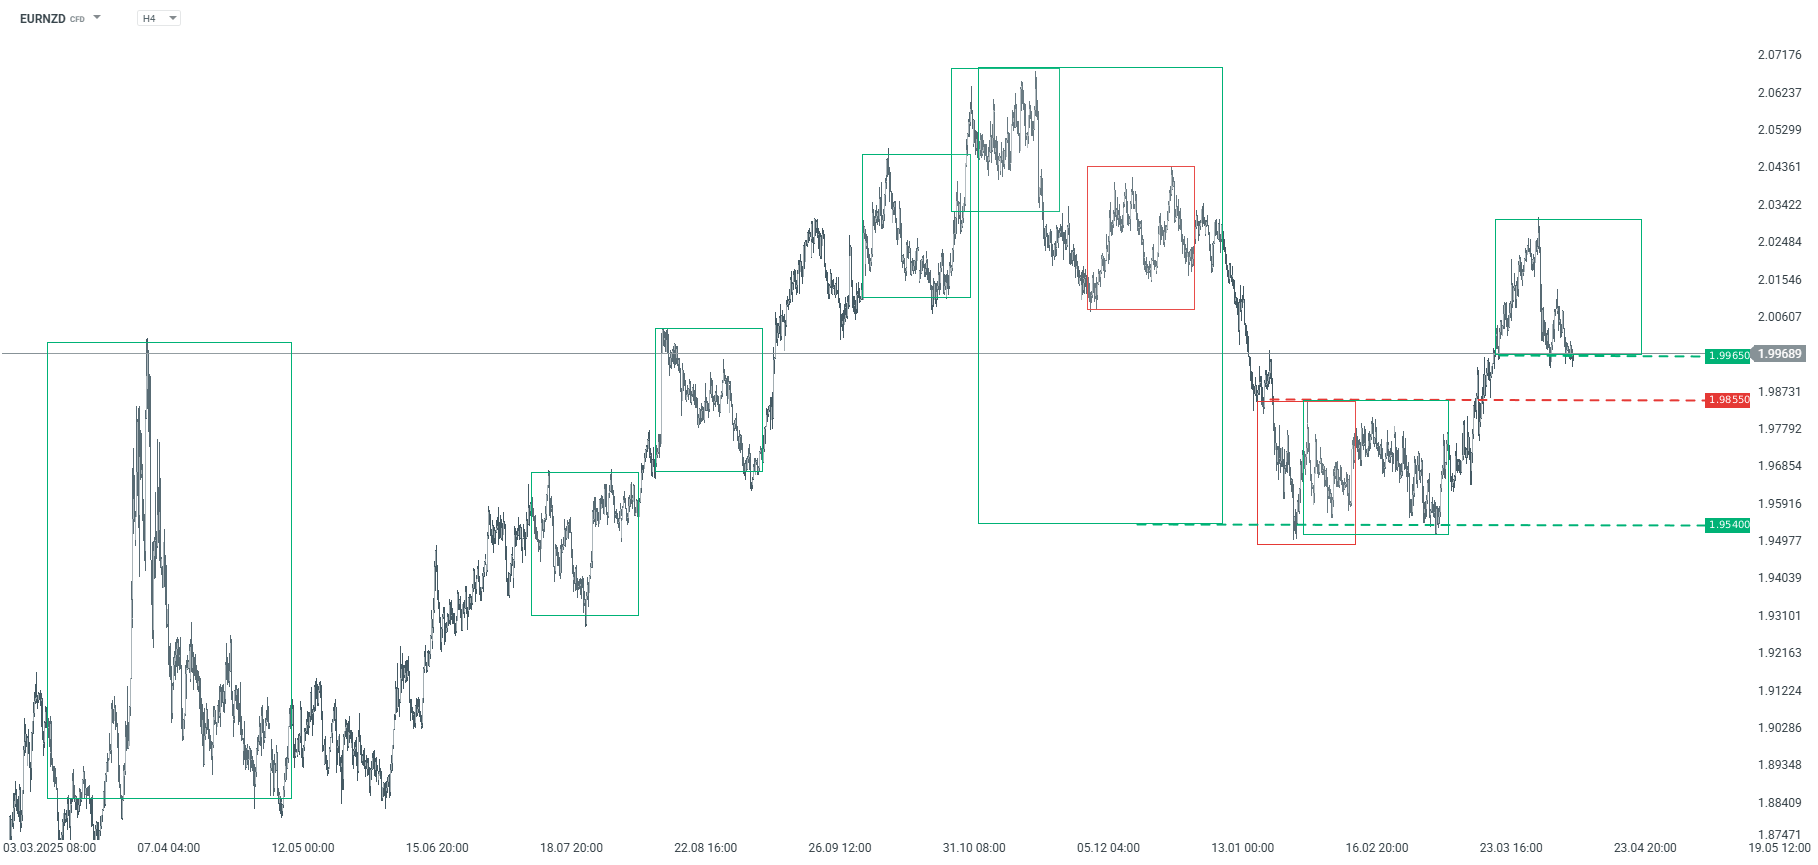
USDJPY – H4 chart. Source: xStation EURNZD Since February, the EURNZD pair has been attempting to return to an uptrend. Currently, the price is hovering near a key support level at 1.9965, which corresponds to the lower boundary of a local 1:1 uptrend pattern formed from the low on February 3. According to the Overbalance methodology, holding this level could lead to the generation of another upward impulse. On the other hand, a break below it would open the way for declines. The bearish scenario would be confirmed if the price falls below 1.9855, where the upper boundary of the previous 1:1 downward pattern is located. In that case, a move toward the lows at 1.9540 would be possible.
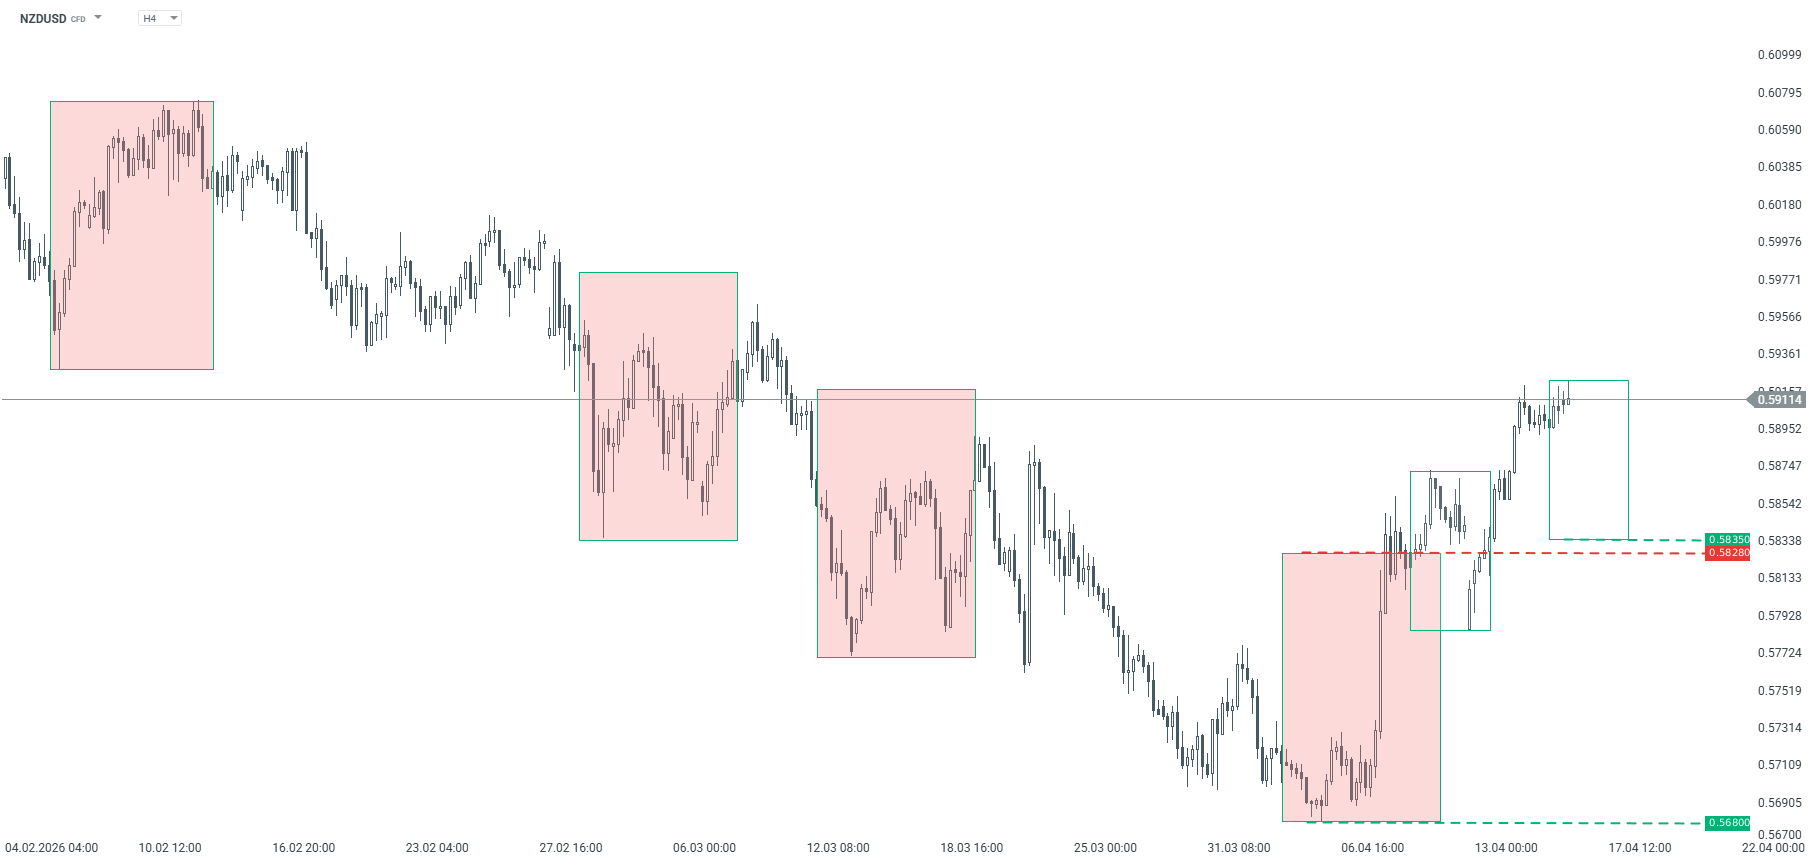
EURNZD – H4 timeframe. Source: xStation NZDUSD NZDUSD prices have recently negated the largest 1:1 corrective downtrend, which may suggest the possibility of a larger corrective uptrend or even a trend reversal. Currently, the key support zone is between 0.5835 and 0.5828. This zone stems both from the lower boundary of the local 1:1 upward pattern and from the polarity of the previously negated downward geometry. As long as the price remains above this zone, the base scenario remains bullish. Conversely, a drop below 0.5828 could signal a return to the downtrend.
NZDUSD – H4 chart. Source: xStation
The material on this page does not constitute financial advice and does not take into account your level of understanding, investment objectives, financial situation or any other specific needs. All information provided, including opinions, market research, mathematical results and technical analyzes published on the Website or transmitted To you by other means, it is provided for information purposes only and should in no way be construed as an offer or solicitation for a transaction in any financial instrument, nor should the information provided be construed as advice of a legal or financial nature on which any investment decisions you make should be based exclusively To your level of understanding, investment objectives, financial situation, or other specific needs, any decision to act on the information published on the Website or sent to you by other means is entirely at your own risk if you In doubt or unsure about your understanding of a particular product, instrument, service or transaction, you should seek professional or legal advice before trading. Investing in CFDs carries a high level of risk, as they are leveraged products and have small movements Often the market can result in much larger movements in the value of your investment, and this can work against you or in your favor. Please ensure you fully understand the risks involved, taking into account investments objectives and level of experience, before trading and, if necessary, seek independent advice.
EUR/USD hovers right above 1.1800, on track for a nine-day rally.
Rising hopes of the resolution of the Middle East conflict are hammering the safe-haven USD.
Trump threatened to fire Fed Chairman Jerome Trump if he does not step aside in May 15.
The (EUR) edges up against the US Dollar (USD) on Thursday, trading right above 1.1800 at the time of writing, on track for a nine-day rally. Hopes of a new round of negotiations between the US and Iran have prompted investors to move away from the safe-haven Dollar, propelling the pair to pre-war levels.
US President Donald Trump confirmed ongoing indirect negotiations with Tehran and affirmed in an interview that peace talks might resume in the coming days. He also affirmed that Israel and Lebanon will start “direct talks” soon, which would contribute to laying the ground for a steady peace agreement with Iran.
Apart from that, the US president has reignited his feud with Federal Reserve (Fed) Chair Jerome Powell, raising concerns about the central bank’s independence and adding pressure on the USD. The Republican threatened to oust him from his separate seat on the Board of Governors if he refused to vacate it at the end of his term as Fed Chair. Powell’s term as the central bank’s chief ends on May 15, but his term on the Board of Governors does not expire until 2028.
Technical Analysis: Resistance at 1.1825 is holding bulls
EUR/USD holds a constructive near-term bias, with technical indicators on the four-hour chart showing mixed signals. The Relative Strength Index hovers in bullish territory near 66 while the Moving Average Convergence Divergence (MACD) has slipped marginally into negative ground.
Bulls are struggling to break the late February lows in the 1.1825 area, which is closing the path towards the February 10 and 11 highs, near 1.1930.
On the downside, initial support is seen at Wednesday’s low, right above 1.1770, followed by the previous tops, between 1.1720 and 1.1740. Further down, a breach of the support area around 1.1650 (April 8, 12 lows) would put the current bullish trend into question.
The Pound Sterling gains buyers’ interest after the release of the stronger-than-expected UK monthly GDP data for February.
UK monthly GDP grew at a robust pace of 0.5% vs. 0.1% estimates.
US-Iran truce hopes have battered the US Dollar badly.
The Pound Sterling (GBP) attracts bids against its major currency peers, trading 0.14% higher to near 1.3580 against the US Dollar (USD) during the European trading session on Thursday after the release of the stronger-than-projected United Kingdom (UK) Gross Domestic Product (GDP) data for February.
The Office for National Statistics (ONS) has reported that economy grew 0.5% Month-on-Month (MoM), while it was expected to grow steadily by 0.1%. January’s figure revised higher from 0% to 0.1%.
UK’s Industrial Production data for February has also come in better-than-expected. The data arrives higher at 0.5% against estimates of 0.2%. In January, Industrial Production declined by 0.1%. However, MoM Manufacturing Production has surprisingly contracted by 0.1%, while it was expected to have grown at a faster pace of 0.3% after rising 0.1% in January.
Meanwhile, the US Dollar has been battered badly by optimism that the United States (US) and Iran could announce a permanent ceasefire soon. During the press time, the US Dollar Index (DXY), which gauges the Greenback’s value against six major currencies, trades almost flat around 98.00. In the Asian trade, the USD Index posted a fresh six-week low at 97.83.
US-Iran truce hopes are boosted by comments from Washington that both nations are close to end the war soon. On early Wednesday, US President Donald Trump told in an interview with Fox Business, “I think it’s close to over, yeah. I view it as very close to being over,” when asked about how long the war with Iran will remain.
The UK Gross Domestic Product (GDP) grew 0.5% MoM in February, following a 0% reported in January, the latest data published by the Office for National Statistics (ONS) showed on Thursday.
The market forecast was for a 0.1% rise in the same period.
Meanwhile, the Index of services (February) rose 0.5% 3M/3M versus January’s 0.2%.
Other data from the UK showed that monthly Industrial Production climbed by 0.5% MoM in February, while Manufacturing Production declined by 0.1% during the same period.
Market reaction to the UK data
The Pound Sterling attracts some buyers following the UK data. At the press time, the GBP/USD pair is gaining 0.13% on the day to trade at 1.3578.
Pound Sterling Price Today
The table below shows the percentage change of British Pound (GBP) against listed major currencies today. British Pound was the strongest against the New Zealand Dollar.
USD
EUR
GBP
JPY
CAD
AUD
NZD
CHF
USD
-0.04%
-0.12%
-0.11%
-0.11%
-0.22%
0.03%
-0.08%
EUR
0.04%
-0.09%
-0.06%
-0.08%
-0.18%
0.03%
-0.04%
GBP
0.12%
0.09%
0.04%
-0.00%
-0.10%
0.12%
0.04%
JPY
0.11%
0.06%
-0.04%
-0.03%
-0.11%
0.07%
0.02%
CAD
0.11%
0.08%
0.00%
0.03%
-0.10%
0.12%
0.04%
AUD
0.22%
0.18%
0.10%
0.11%
0.10%
0.21%
0.16%
NZD
-0.03%
-0.03%
-0.12%
-0.07%
-0.12%
-0.21%
-0.08%
CHF
0.08%
0.04%
-0.04%
-0.02%
-0.04%
-0.16%
0.08%
The heat map shows percentage changes of major currencies against each other. The base currency is picked from the left column, while the quote currency is picked from the top row. For example, if you pick the British Pound from the left column and move along the horizontal line to the US Dollar, the percentage change displayed in the box will represent GBP (base)/USD (quote).
This section was published on Thursday at 04:31 GMT as a preview of UK GDP data.
The UK Economic Data Overview
Thursday’s UK economic docket features the release of the monthly GDP print, alongside the Trade Balance and Industrial Production, all of which will be published by the Office for National Statistics (ONS) at 06:00 GMT.
The UK economy is expected to have expanded by 0.1% in February, up from a flat reading in the previous month. Meanwhile, the Manufacturing Production, which makes up around 80% of total Industrial Production, is anticipated to show a 0.3% MoM rise, up from a modest of 0.1% increase in January. Meanwhile, the total Industrial Production seems to be coming in at 0.0% MoM in February as compared to the previous reading of -0.1%.
On an annualized basis, the Industrial Production is expected to have contracted by 0.9 versus 0.4% growth in the previous month, while the manufacturing output is also anticipated to have fallen by 0.3% in the reported month, versus 1.3% last month. Simultaneously, the UK Goods Trade Balance will be reported and is anticipated to show a deficit of £20.02 billion in February vs a £14.449 billion deficit reported in the previous month.
How could the UK data affect GBP/USD?
A surprisingly stronger UK macro data could benefit the British Pound (GBP). In contrast, any disappointment is more likely to be overshadowed by expectations that the war-driven surge in energy prices will revive inflation and force the Bank of England (BoE) to adopt a more hawkish stance. This, along with the prevailing US Dollar (USD) selling bias, suggests that the path of least resistance for the GBP/USD pair is to the upside.
GBP/USD daily chart
Technical Analysis:
The recent breakout through the 1.3415-1.3425 confluence resistance– comprising the 200-day Simple Moving Average (SMA) and the 38.2% Fibonacci retracement level of the January-March fall – was seen as a key trigger for bullish traders. Moreover, the subsequent strength beyond the 1.3500 psychological mark, which coincided with the 50% retracement level, validates the near-term positive outlook for the GBP/USD pair.
Meanwhile, momentum indicators also back the positive bias. In fact, the Relative Strength Index (RSI) hovers around 63, and the Moving Average Convergence Divergence (MACD) line is positioned above zero with an expanding positive histogram. This hints that buyers still have the upper hand as long as price holds above the resistance breakpoints, though bulls might still await a move beyond the 61.8% Fibo. level.
EUR/JPY softens to around 187.50 in Thursday’s early European session.
The cross keeps the bullish vibe above the key 100-day EMA.
The first upside barrier emerges at 187.95; the initial support level is seen at 186.20.
The EUR/JPY cross trades with mild losses near 187.50 during the early European session on Thursday. The Japanese Yen (JPY) strengthens against the Euro (EUR) amid intervention fears from Japanese authorities. Japan’s Finance Minister Satsuki Katayama said on Thursday that she told the G7 to closely watch forex moves.
The Bank of Japan (BoJ) is expected to raise its benchmark rate to 1.00% by end-June, with nearly two-thirds of economists in a Reuters poll predicting the move, and a hike in April or in June seen as equally likely amid uncertainty over the fallout from the Iran war.
Technical Analysis:
In the daily chart, EUR/JPY maintains a bullish near-term bias as price holds well above the 100-day exponential moving average (EMA). The pair is pressing the upper side of its recent volatility envelope, with the 14-day Relative Strength Index (RSI) hovering just under overbought territory around 69, which suggests strong upward momentum but also hints that upside could become stretched if gains extend without a corrective pause.
On the topside, initial resistance is seen at the upper Bollinger Band of 187.95, en route to 188.50. On the downside, any pullback would likely find first demand near the April 13 low of 186.20. The next contention level is seen at the middle Bollinger Band of 185.00, with a deeper setback exposing the rising 100-day EMA at 182.75.
🇦🇺 AUD / 🇨🇦 CAD — Australian Dollar / Canadian Dollar
🇪🇺 EUR / 🇯🇵 JPY — Euro / Japanese Yen
🇬🇧 GBP / 🇯🇵 JPY — British Pound / Japanese Yen
🇦🇺 AUD / 🇳🇿 NZD — Australian Dollar / New Zealand Dollar
🇪🇺 EUR / 🇬🇧 GBP — Euro / British Pound
🇪🇺 EUR / 🇦🇺 AUD — Euro / Australian Dollar
🇬🇧 GBP / 🇨🇦 CAD — British Pound / Canadian Dollar
🇪🇺 EUR / 🇨🇦 CAD — Euro / Canadian Dollar
Manage Consent
To provide the best experiences, we use technologies like cookies to store and/or access device information. Consenting to these technologies will allow us to process data such as browsing behavior or unique IDs on this site. Not consenting or withdrawing consent, may adversely affect certain features and functions.
Functional
Always active
The technical storage or access is strictly necessary for the legitimate purpose of enabling the use of a specific service explicitly requested by the subscriber or user, or for the sole purpose of carrying out the transmission of a communication over an electronic communications network.
Preferences
The technical storage or access is necessary for the legitimate purpose of storing preferences that are not requested by the subscriber or user.
Statistics
The technical storage or access that is used exclusively for statistical purposes.The technical storage or access that is used exclusively for anonymous statistical purposes. Without a subpoena, voluntary compliance on the part of your Internet Service Provider, or additional records from a third party, information stored or retrieved for this purpose alone cannot usually be used to identify you.
Marketing
The technical storage or access is required to create user profiles to send advertising, or to track the user on a website or across several websites for similar marketing purposes.