

Key takeaways
- What is the technical outlook for USDJPY, EURNZD, and NZDUSD?
The Overbalance analysis aims to identify three financial instruments, analyzed primarily on the daily/four-hour (D1/H4) timeframe. The analysis uses only the Overbalance methodology, which helps determine where a trend may continue or where it may reverse. Today’s analysis covers three instruments, evaluated solely in terms of 1:1 correction structures. USDJPY USDJPY has been trending upward for quite some time. Looking back to the lows in February, the largest correction was around 230 pips. The current correction is of a similar magnitude, which allows us to identify key support at the 158.10 level, derived from the 1:1 ratio. According to the Overbalance methodology, as long as this level is not broken, the uptrend remains in effect. If it is broken, the correction could deepen, and the next significant support would be at 155.11, where the lower boundary of a larger 1:1 pattern with a range of approximately 530 pips is located.
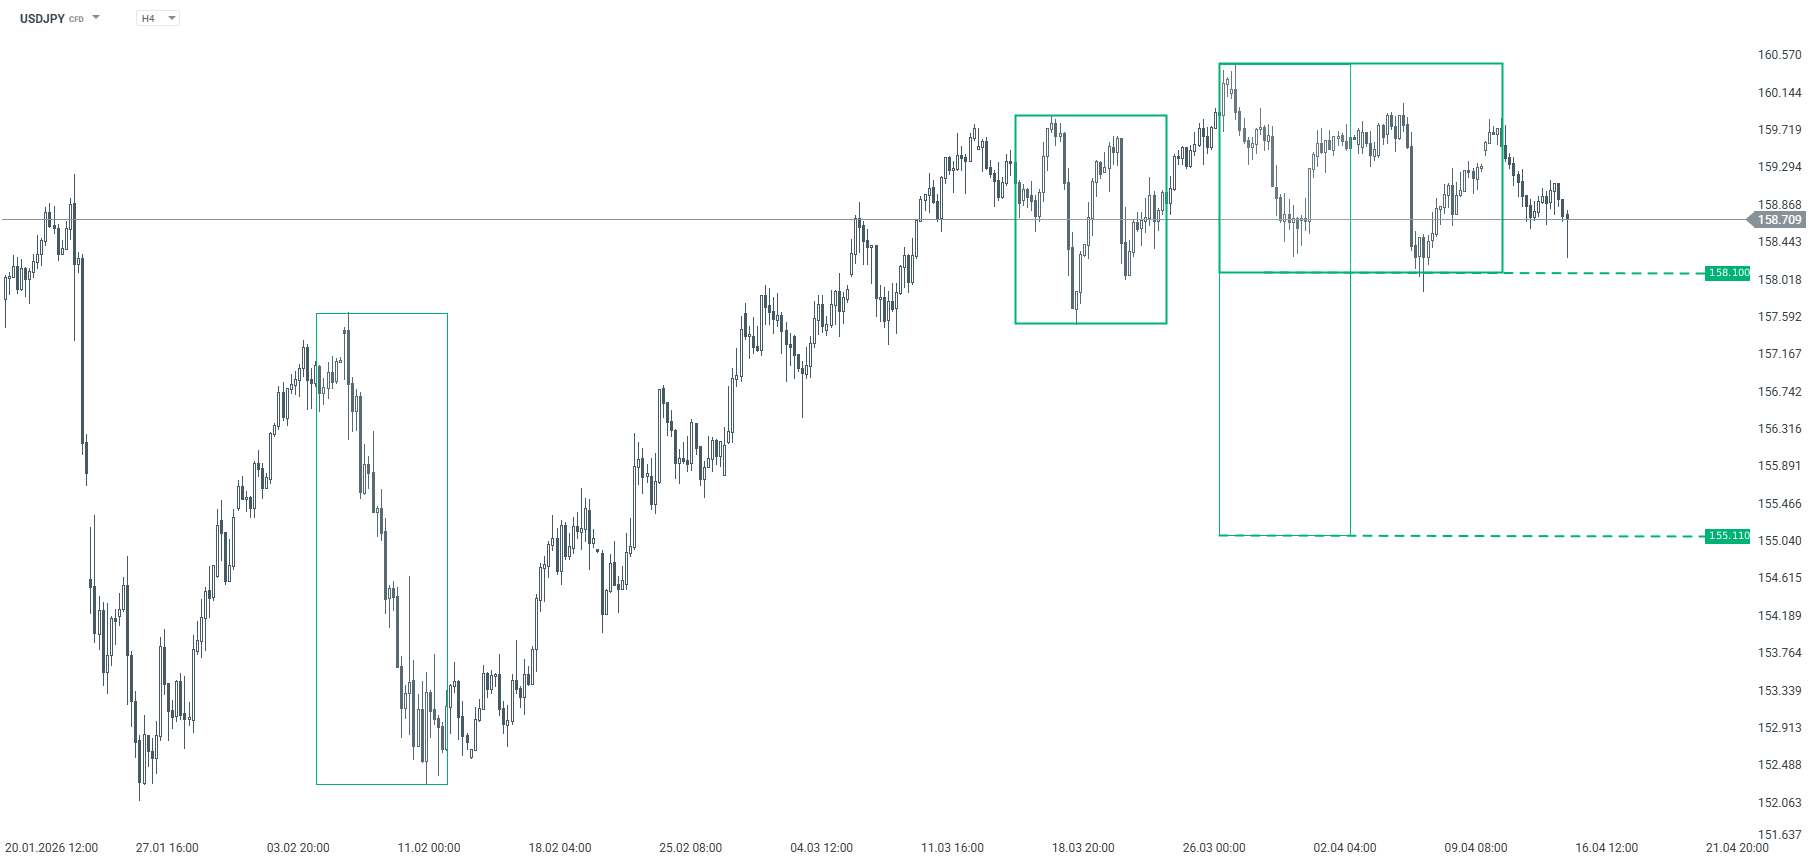
USDJPY – H4 chart. Source: xStation EURNZD Since February, the EURNZD pair has been attempting to return to an uptrend. Currently, the price is hovering near a key support level at 1.9965, which corresponds to the lower boundary of a local 1:1 uptrend pattern formed from the low on February 3. According to the Overbalance methodology, holding this level could lead to the generation of another upward impulse. On the other hand, a break below it would open the way for declines. The bearish scenario would be confirmed if the price falls below 1.9855, where the upper boundary of the previous 1:1 downward pattern is located. In that case, a move toward the lows at 1.9540 would be possible.
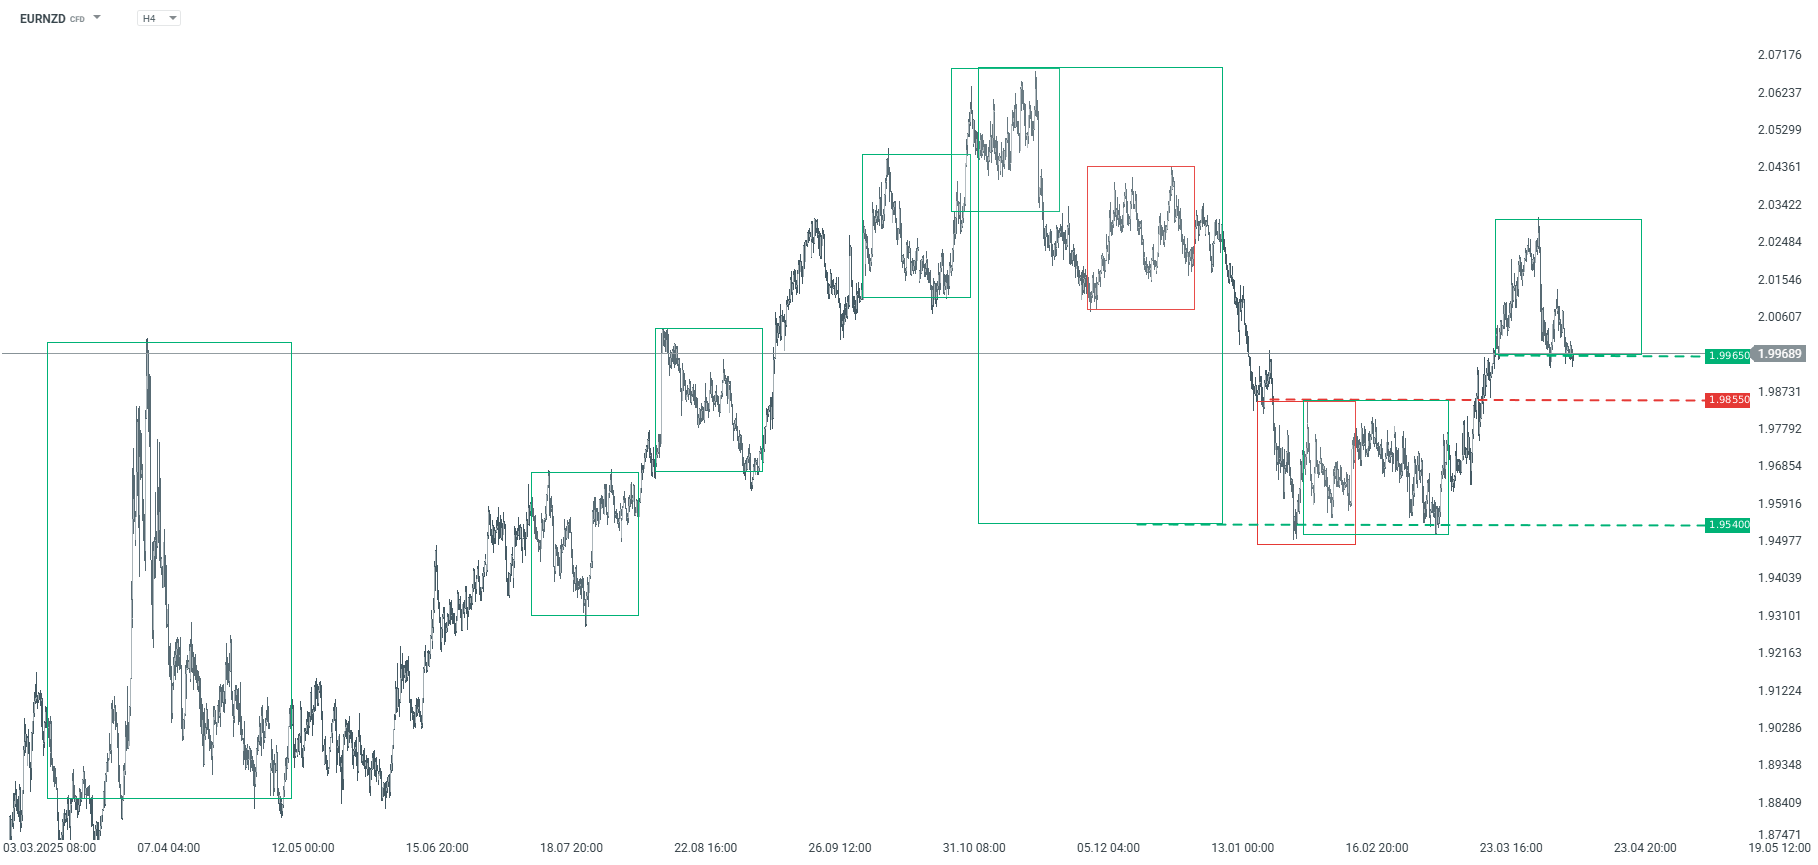
EURNZD – H4 timeframe. Source: xStation NZDUSD NZDUSD prices have recently negated the largest 1:1 corrective downtrend, which may suggest the possibility of a larger corrective uptrend or even a trend reversal. Currently, the key support zone is between 0.5835 and 0.5828. This zone stems both from the lower boundary of the local 1:1 upward pattern and from the polarity of the previously negated downward geometry. As long as the price remains above this zone, the base scenario remains bullish. Conversely, a drop below 0.5828 could signal a return to the downtrend.
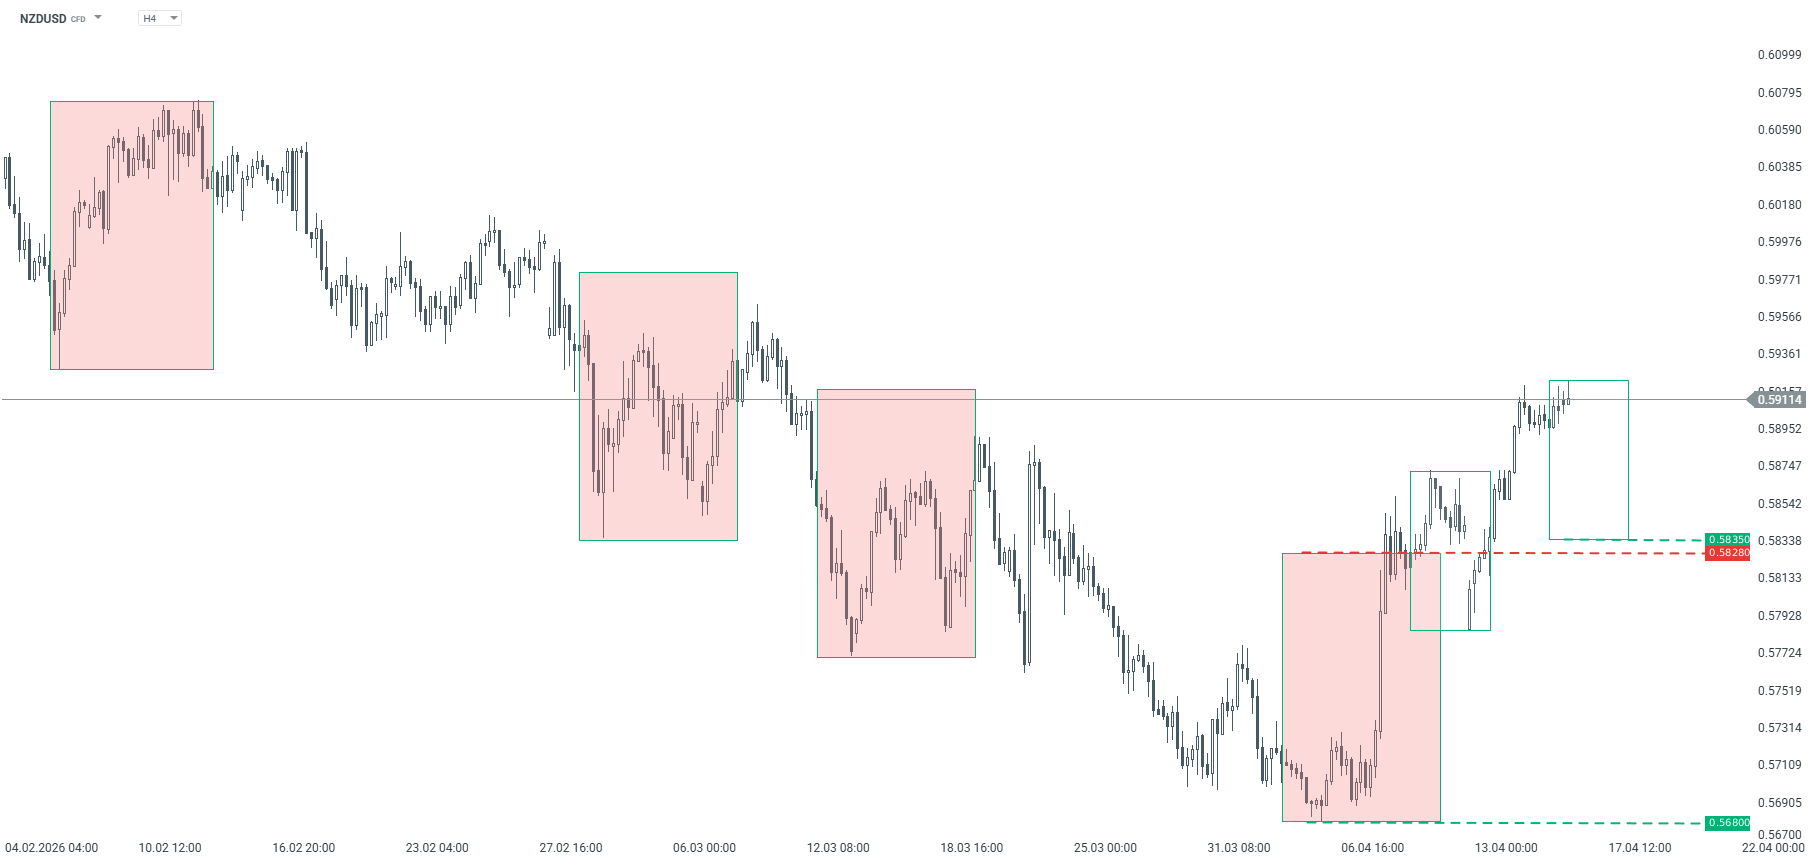
NZDUSD – H4 chart. Source: xStation
The material on this page does not constitute financial advice and does not take into account your level of understanding, investment objectives, financial situation or any other specific needs. All information provided, including opinions, market research, mathematical results and technical analyzes published on the Website or transmitted To you by other means, it is provided for information purposes only and should in no way be construed as an offer or solicitation for a transaction in any financial instrument, nor should the information provided be construed as advice of a legal or financial nature on which any investment decisions you make should be based exclusively To your level of understanding, investment objectives, financial situation, or other specific needs, any decision to act on the information published on the Website or sent to you by other means is entirely at your own risk if you In doubt or unsure about your understanding of a particular product, instrument, service or transaction, you should seek professional or legal advice before trading. Investing in CFDs carries a high level of risk, as they are leveraged products and have small movements Often the market can result in much larger movements in the value of your investment, and this can work against you or in your favor. Please ensure you fully understand the risks involved, taking into account investments objectives and level of experience, before trading and, if necessary, seek independent advice.
