Currency Talk – USDJPY, NZDUSD, USDCHF

April 2, 2026

The Overbalance analysis aims to identify three financial instruments, analyzed primarily on the daily/four-hour (D1/H4) timeframe. The analysis uses only the Overbalance methodology, which helps determine where a trend may continue or where it may reverse. Today’s analysis covers three instruments, evaluated solely in terms of 1:1 correction structures.

USDJPY
Since February 12, the USDJPY has been trading in a strong uptrend. Initially, the movement was controlled by a 1:1 corrective pattern with a range of approximately 140 pips; however, in mid-March, a deeper correction occurred, after which the market established a new high. As a result, the current largest corrective pattern has a range of approximately 240 pips. At this point, the key support level is 158.10, derived from the lower boundary of this pattern. As long as this level holds, the uptrend remains in place. A break below it, however, could open the way for a larger correction or even a trend reversal.

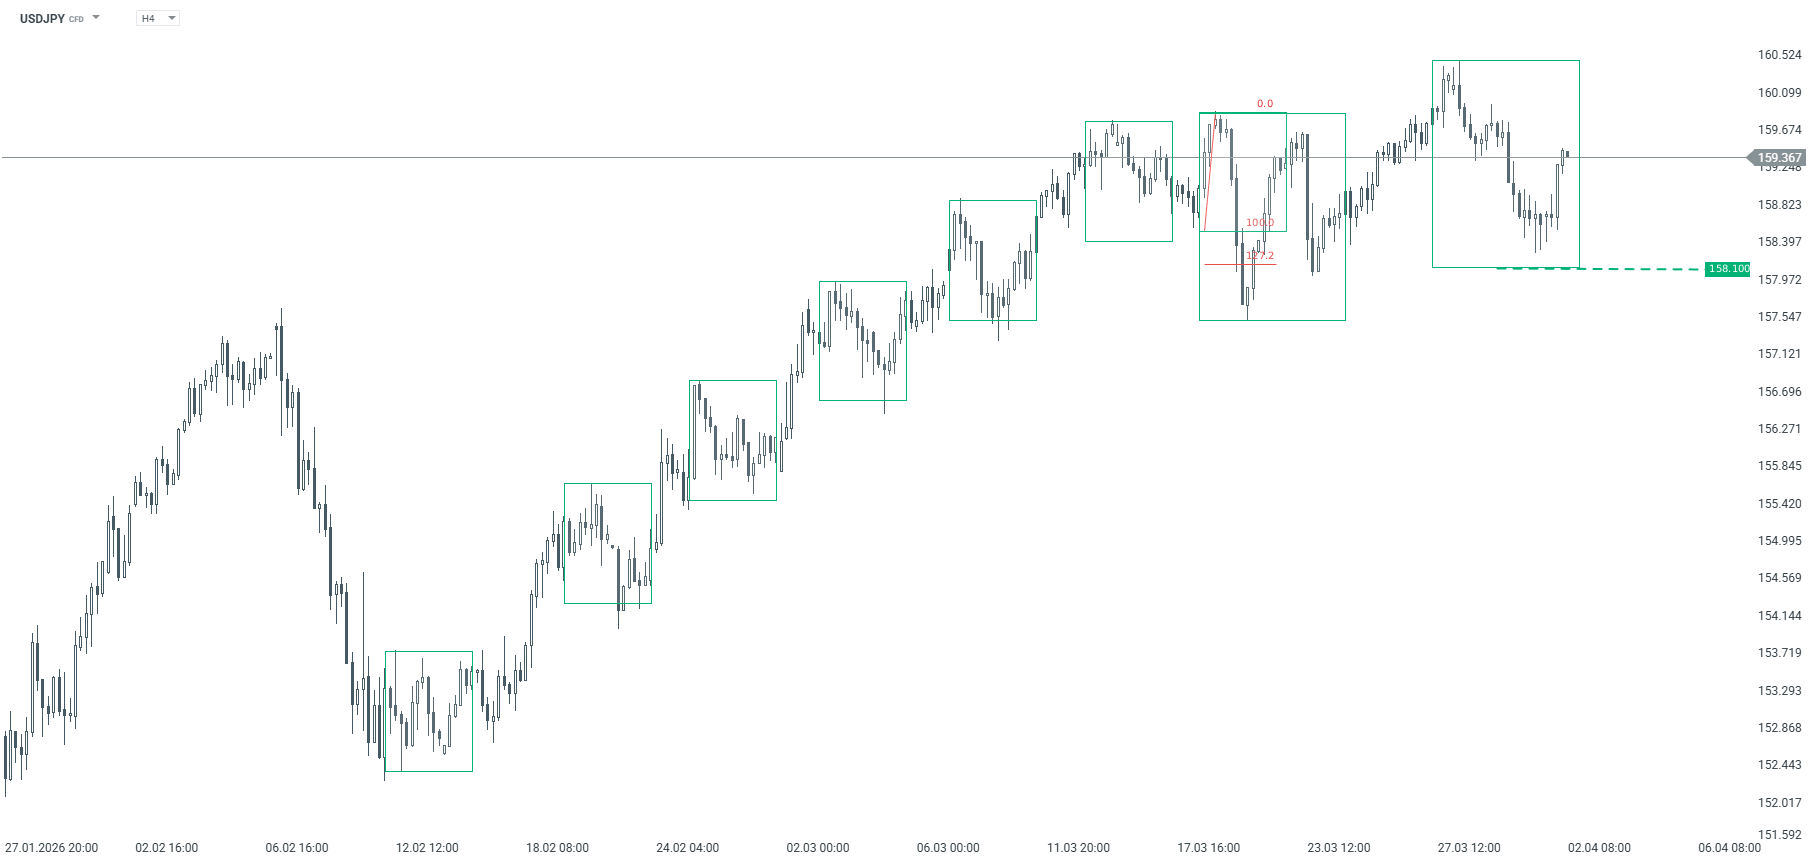
USDJPY – H4 chart. Source: xStation

NZDUSD
The NZDUSD pair has been trending downward since late January. We are currently seeing an upward corrective move. If the correction continues, the key resistance level remains at 0.5845, where the upper boundary of the 1:1 correction pattern is located. According to the Overbalance methodology, the downtrend remains in effect until this level is negated.

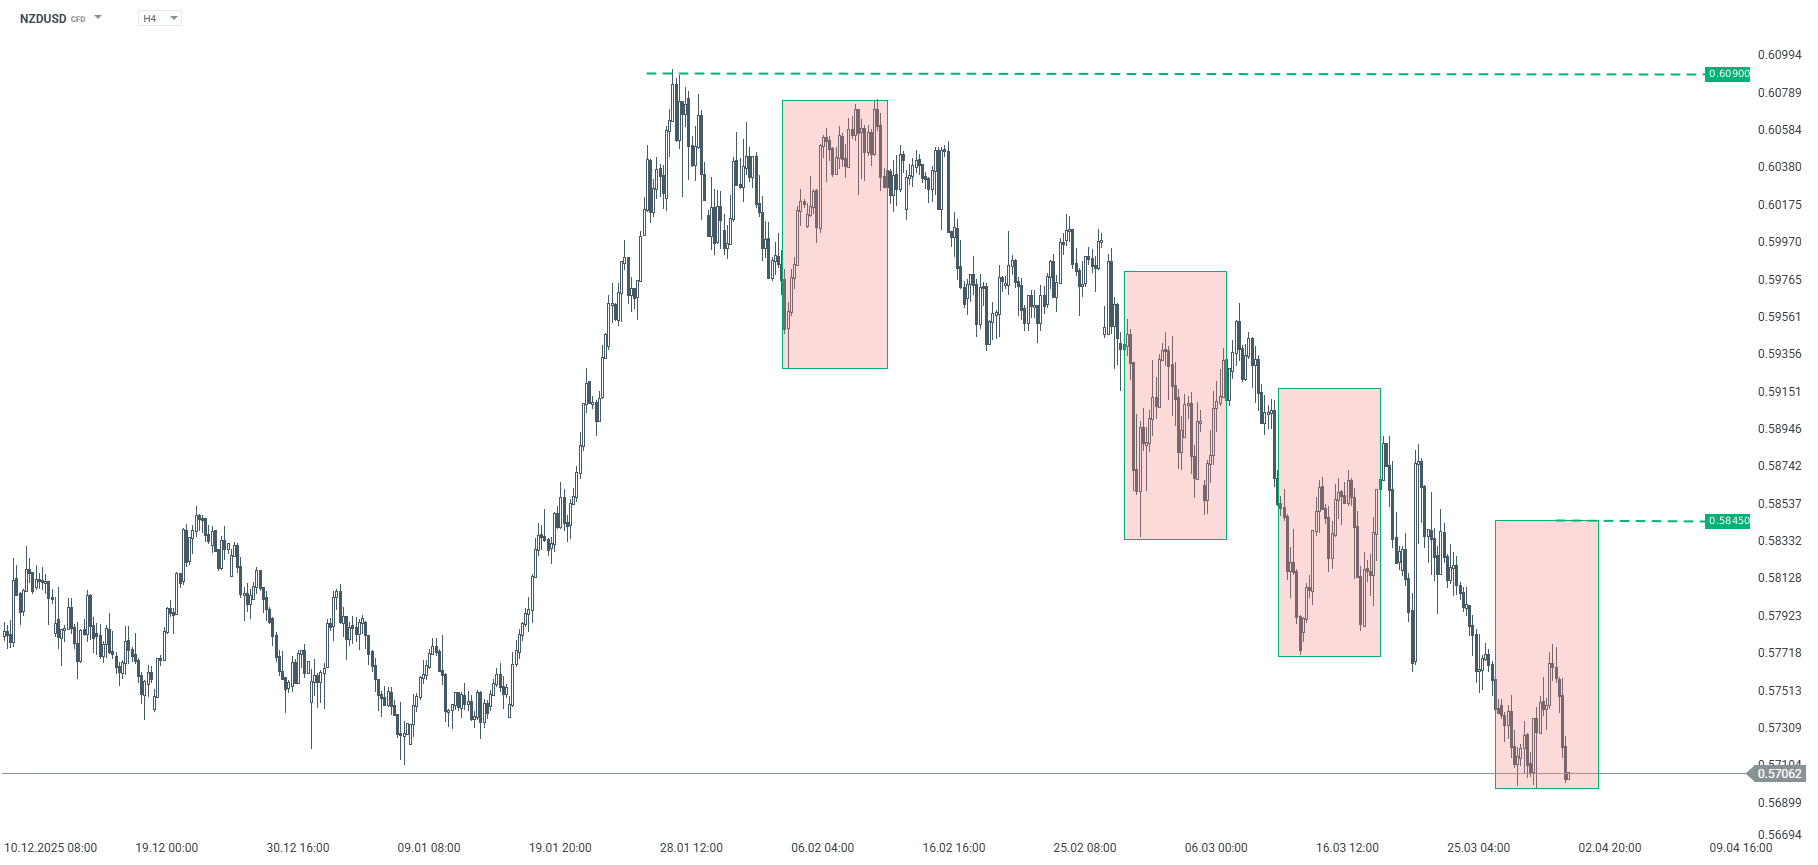
NZDUSD – H4 chart. Source: xStation

USDCHF
Since early January, USDCHF has been in a downtrend. However, an upward correction has been developing since late January, and its range has already exceeded smaller geometric patterns, including the 0.7902 level. Nevertheless, the price has failed to break through the key resistance at 0.8042, where the upper boundary of the largest corrective pattern is located. According to the Overbalance methodology, the downtrend remains in effect until this level is broken. The decline could accelerate after falling below the 0.7902 level, which is the lower boundary of the smaller geometric pattern. Conversely, a break above 0.8042 could lead to a shift to an uptrend.

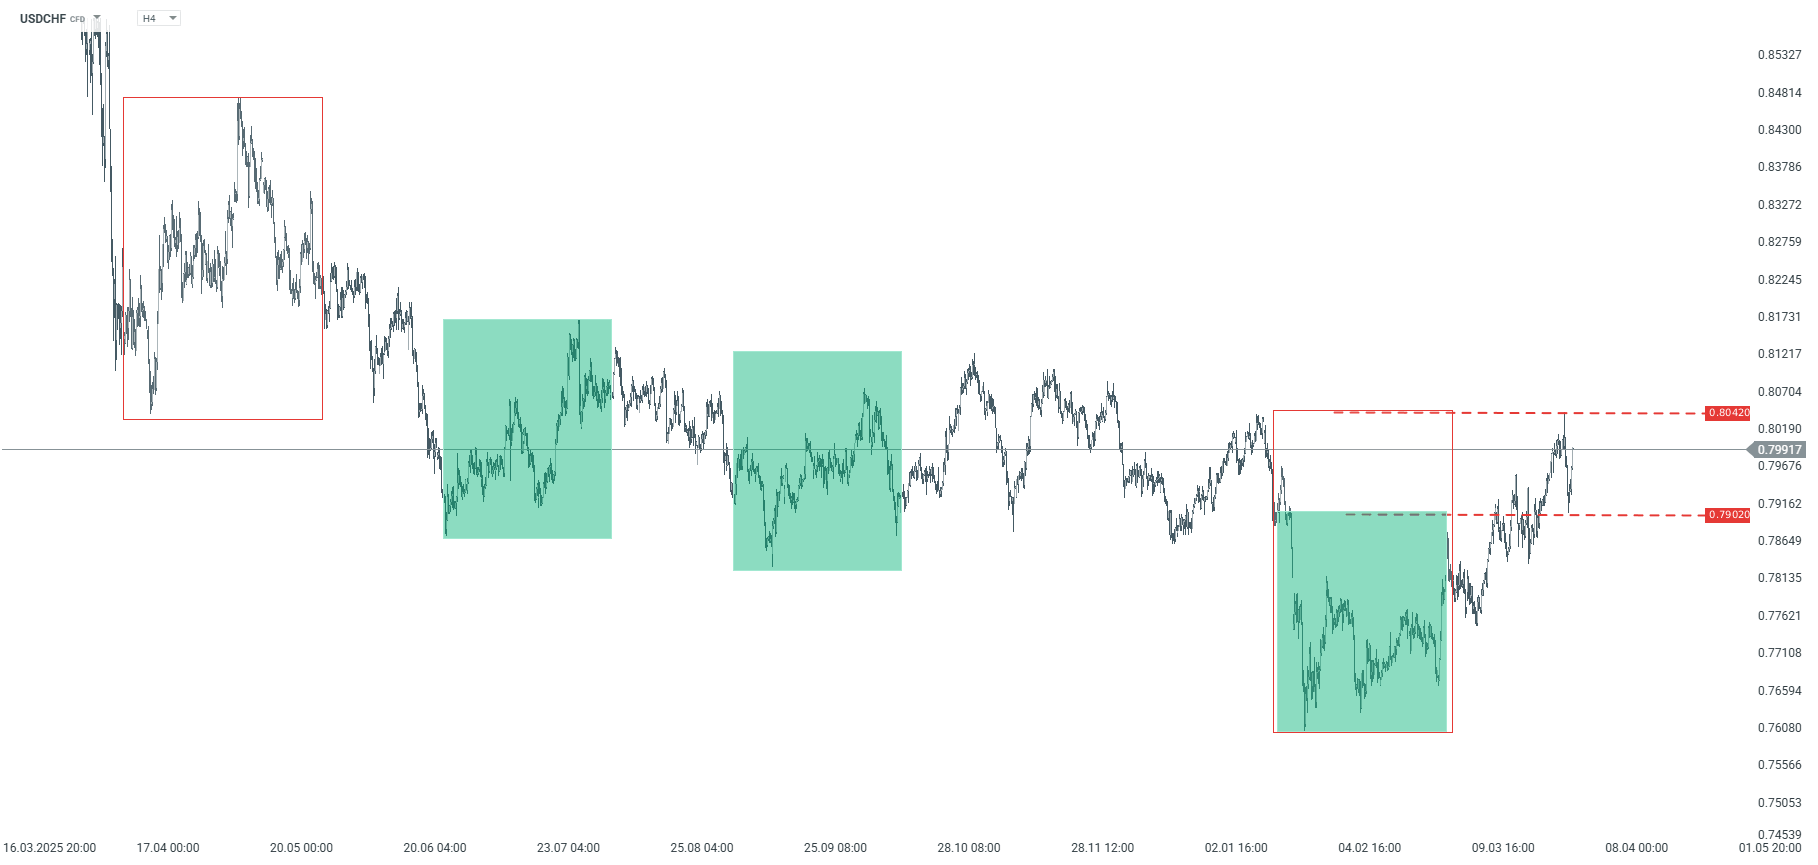
USDCHF – H4 timeframe. Source: xStation

The material on this page does not constitute financial advice and does not take into account your level of understanding, investment objectives, financial situation or any other specific needs. All information provided, including opinions, market research, mathematical results and technical analyzes published on the Website or transmitted To you by other means, it is provided for information purposes only and should in no way be construed as an offer or solicitation for a transaction in any financial instrument, nor should the information provided be construed as advice of a legal or financial nature on which any investment decisions you make should be based exclusively To your level of understanding, investment objectives, financial situation, or other specific needs, any decision to act on the information published on the Website or sent to you by other means is entirely at your own risk if you In doubt or unsure about your understanding of a particular product, instrument, service or transaction, you should seek professional or legal advice before trading. Investing in CFDs carries a high level of risk, as they are leveraged products and have small movements Often the market can result in much larger movements in the value of your investment, and this can work against you or in your favor. Please ensure you fully understand the risks involved, taking into account investments objectives and level of experience, before trading and, if necessary, seek independent advice.

Chart of The Day – Oil Rebounds Sharply

April 2, 2026

Brent crude is surging back above $100 per barrel (OIL: +7.6%), erasing nearly all losses from the last three sessions. Donald Trump’s address failed to outline any concrete “exit strategies” for the conflict, and his hawkish tone undermined market optimism that had previously bet on a rebound following Iran’s declarations of being ready for peace talks.

The OIL contract is dynamically returning above the 10-day Exponential Moving Average (EMA10, yellow), confirming a strong upward trend. However, the price is approaching a repeatedly tested resistance level at $110, and a nearly overbought RSI (near 70) may limit gains above this threshold. Source: xStation5

What is driving the rise in OIL today?

  • In his address, Donald Trump announced that the strategic goals of “Operation Epic Fury” are near completion and that the war in Iran will last approximately another two to three weeks. He vowed the final destruction of Iran’s nuclear and missile programs, threatening strikes on energy infrastructure. While the address largely repeated many of Trump’s known stances, his comments regarding the Strait of Hormuz and the overall bellicose tone eroded the optimism seen in recent sessions.
  • The US President downplayed the importance of the Strait of Hormuz to the United States, claiming the country is energy independent. He called on Asian and European nations to protect the route themselves, suggesting they purchase American oil instead. Experts are challenging his optimism regarding a rapid drop in fuel prices, pointing to permanent infrastructure damage and record energy costs in the US (exceeding $4 per gallon).
  • Iranian military officials responded to Trump’s address by vowing to continue the war until the “humiliation and surrender” of the US and Israel. Tehran dismissed claims that its military has been weakened, threatening “even more powerful and destructive strikes.” The Iranian command emphasized that Washington underestimates their strategic capabilities, and Trump’s vows to “bring them back to the stone age” only escalate the conflict, ruling out a quick truce.

The material on this page does not constitute financial advice and does not take into account your level of understanding, investment objectives, financial situation or any other specific needs. All information provided, including opinions, market research, mathematical results and technical analyzes published on the Website or transmitted To you by other means, it is provided for information purposes only and should in no way be construed as an offer or solicitation for a transaction in any financial instrument, nor should the information provided be construed as advice of a legal or financial nature on which any investment decisions you make should be based exclusively To your level of understanding, investment objectives, financial situation, or other specific needs, any decision to act on the information published on the Website or sent to you by other means is entirely at your own risk if you In doubt or unsure about your understanding of a particular product, instrument, service or transaction, you should seek professional or legal advice before trading. Investing in CFDs carries a high level of risk, as they are leveraged products and have small movements Often the market can result in much larger movements in the value of your investment, and this can work against you or in your favor. Please ensure you fully understand the risks involved, taking into account investments objectives and level of experience, before trading and, if necessary, seek independent advice.

EUR/GBP Analysis – Euro stands tall above 0.8700 in risk-off markets

April 2, 2026
  • EUR/GBP maintains its near-term bullish trend intact, with 0.8700 support capping bears.
  • Upbeat Eurozone manufacturing data provided some support to the Euro on Wednesday.
  • The pair is likely to meet significant resistance at the 0.8740-0.8750 area.

EUR/GBP’s reversal from one-month highs at 0.8740 found buyers right above 0.08700 on Wednesday, and the pair has trimmed losses on Thursday, returning to the 0.8720 area at the time of writing.

The Euro (EUR) seems to be faring better than the British Pound (GBP) amid the risk-averse market mood, and keeps the bullish bias from mid-March lows intact. The positive Eurozone manufacturing data provided some support for the common currency on Wednesday, while UK factory activity failed to convince investors.

Technical Analysis: Resistance at the 0.8740-08750 area

Chart Analysis EUR/GBP


The 4-hour chart shows EUR/GBP trading at 0.8724 amid a mildly bullish near-term bias. The Relative Strength Index stays above 60, indicating sustained upside momentum, although the bearish cross of the Moving Average Convergence Divergence (MACD) line suggests that upside pressure might be fading.

The pair is likely to require some extra impulse to extend its rally beyond the resistance area between 0.8740, where bulls were capped on March 3, 31, and April 1, and the 78.2% Fibonacci retracement of the early March reversal, at 0.8752. A confirmation above these levels would bring the year-to-date high, at the 0.8790 area, back to the focus.

To the downside, bears would need to breach Wednesday’s low, at 0.8704, and the March 31 low, at 0.8676, to negate the bullish view.

Euro Price Today

The table below shows the percentage change of Euro (EUR) against listed major currencies today. Euro was the strongest against the British Pound.

USDEURGBPJPYCADAUDNZDCHF
USD0.51%0.71%0.49%0.25%0.64%0.63%0.63%
EUR-0.51%0.21%-0.04%-0.28%0.15%0.14%0.09%
GBP-0.71%-0.21%-0.23%-0.48%-0.05%-0.05%-0.12%
JPY-0.49%0.04%0.23%-0.24%0.15%0.14%0.10%
CAD-0.25%0.28%0.48%0.24%0.39%0.38%0.34%
AUD-0.64%-0.15%0.05%-0.15%-0.39%-0.01%-0.08%
NZD-0.63%-0.14%0.05%-0.14%-0.38%0.01%-0.05%
CHF-0.63%-0.09%0.12%-0.10%-0.34%0.08%0.05%

The heat map shows percentage changes of major currencies against each other. The base currency is picked from the left column, while the quote currency is picked from the top row. For example, if you pick the Euro from the left column and move along the horizontal line to the US Dollar, the percentage change displayed in the box will represent EUR (base)/USD (quote).

41, with a break higher exposing 0.8800 and then 0.8863. On the downside, initial support comes in at 0.8705, followed by the 61.8% retracement at 0.8721 turning into a pivot area if broken, while the 38.2% retracement at 0.8680 aligns with prior price congestion as the next key floor. A deeper pullback would bring 0.8677 into view, where a failure to hold would signal that the current bullish phase is losing traction.

EUR/JPY Tests nine-day EMA support after easing below 184.00

April 2, 2026
  • EUR/JPY may encounter initial resistance near 184.70 at the upper ascending triangle boundary.
  • The Relative Strength Index near 52 indicates steady momentum.
  • Immediate support is seen at the nine-day EMA near 183.80.

EUR/JPY depreciates after two days of gains, trading around 183.90 during the Asian hours on Thursday. The technical analysis of the daily chart suggests the currency cross is moving sideways within an ascending triangle pattern, indicating consolidation. However, the structure reflects rising support levels meeting a relatively flat resistance zone, signaling building pressure that could lead to a breakout. A sustained move above resistance would confirm bullish continuation.

The near-term bias is mildly bullish as the EUR/JPY cross holds above the 50-day Exponential Moving Average and the nine-day EMA tracks just beneath spot, reinforcing a shallow upward slope. The Relative Strength Index (RSI) near 52 stays above its midline and confirms steady, rather than aggressive, upside momentum, with recent pullbacks finding demand before the medium-term average.

The EUR/JPY cross may find the initial resistance around the upper ascending triangle boundary at 184.70. A successful break above this triangle would reinforce the bullish bias and lead the currency cross to explore the region around the all-time high of 186.88, reached on January 23.

On the downside, the immediate support lies at the nine-day EMA of 183.80, followed by the 50-day EMA at 183.39. Further support lies at the lower boundary of the ascending triangle around 182.80. A break below the channel would expose a nearly four-month low of 180.81, recorded on February 12.

EUR/JPY: Daily Chart

(The technical analysis of this story was written with the help of an AI tool.)

Euro Price Today

The table below shows the percentage change of Euro (EUR) against listed major currencies today. Euro was the weakest against the US Dollar.

USDEURGBPJPYCADAUDNZDCHF
USD0.46%0.55%0.37%0.28%0.72%0.71%0.53%
EUR-0.46%0.09%-0.11%-0.21%0.27%0.26%0.06%
GBP-0.55%-0.09%-0.19%-0.28%0.18%0.19%-0.03%
JPY-0.37%0.11%0.19%-0.10%0.35%0.34%0.15%
CAD-0.28%0.21%0.28%0.10%0.45%0.43%0.25%
AUD-0.72%-0.27%-0.18%-0.35%-0.45%-0.01%-0.23%
NZD-0.71%-0.26%-0.19%-0.34%-0.43%0.00%-0.20%
CHF-0.53%-0.06%0.03%-0.15%-0.25%0.23%0.20%

The heat map shows percentage changes of major currencies against each other. The base currency is picked from the left column, while the quote currency is picked from the top row. For example, if you pick the Euro from the left column and move along the horizontal line to the US Dollar, the percentage change displayed in the box will represent EUR (base)/USD (quote).

EUR/USD Price Declines below 1.1550 as Trump’s Iran war update boosts USD

April 2, 2026
  • EUR/USD meets with heavy supply as USD strengthens after Trump’s Iran war update.
  • Firming Fed rate hike bets further benefit the USD and back the case for deeper losses.
  • The intraday failure near the 200-period EMA on the H4 validates the negative outlook.

The EUR/USD pair struggles to capitalize on its gains registered over the past two days, reaching the weekly top the previous day, and attracts heavy selling during the Asian session on Thursday. Spot prices drop below the 1.1550 level in the last hour amid the emergence of fresh buying around the safe-haven US Dollar (USD) as US President Donald Trump’s update on the Iran war dampens de-escalation hopes.

Addressing the nation, Trump threatened that Iran would be hit extremely hard over the next two to three weeks and would be brought to the Stone Age if no deal is reached. Trump further added that Iranian energy infrastructure remains a possible target, triggering a sharp rally in Crude Oil prices and fueling inflationary concerns. This, in turn, bolsters bets for a rate hike by the US Federal Reserve (Fed) and turns out to be another factor supporting the USD, which is seen exerting pressure on the EUR/USD pair.

From a technical perspective, the failure to find acceptance above the 200-period Exponential Moving Average (EMA) on the 4-hour chart and a pullback from the 1.1620-1.1625 supply zone favors bearish traders. Moreover, the Moving Average Convergence Divergence (MACD) indicator slips back toward the zero line after a brief positive extension, with the histogram contracting and hinting at fading bullish momentum. Adding to this, the Relative Strength Index (RSI) eases to around 50, reinforcing a loss of directional conviction after failing to sustain overbought proximity earlier in the move.

Meanwhile, initial support emerges at 1.1520, guarding the recent reaction low near 1.1485, where a break would expose the 1.1450 zone as the next downside objective. On the topside, immediate resistance stands at 1.1580 ahead of the 1.1610–1.1620 band, where prior swing highs converge with the 200-period exponential moving average to define a key barrier. A sustained move above this upper resistance zone would be needed to revive a clear bullish bias, while failure to hold 1.1520 would shift focus back toward the mid-1.1400s.

(The technical analysis of this story was written with the help of an AI tool.)

EUR/USD 4-hour chart

Chart Analysis EUR/USD

US Dollar Price Today

The table below shows the percentage change of US Dollar (USD) against listed major currencies today. US Dollar was the strongest against the New Zealand Dollar.

USDEURGBPJPYCADAUDNZDCHF
USD0.42%0.53%0.35%0.24%0.67%0.70%0.45%
EUR-0.42%0.11%-0.09%-0.20%0.26%0.29%0.02%
GBP-0.53%-0.11%-0.19%-0.26%0.16%0.20%-0.08%
JPY-0.35%0.09%0.19%-0.10%0.32%0.35%0.10%
CAD-0.24%0.20%0.26%0.10%0.42%0.44%0.20%
AUD-0.67%-0.26%-0.16%-0.32%-0.42%0.03%-0.26%
NZD-0.70%-0.29%-0.20%-0.35%-0.44%-0.03%-0.26%
CHF-0.45%-0.02%0.08%-0.10%-0.20%0.26%0.26%

The heat map shows percentage changes of major currencies against each other. The base currency is picked from the left column, while the quote currency is picked from the top row. For example, if you pick the US Dollar from the left column and move along the horizontal line to the Japanese Yen, the percentage change displayed in the box will represent USD (base)/JPY (quote).

Geopolitics: Markets are pricing in the possibility of an end to the war

April 1, 2026
  • Wednesday’s trading session marks the best day for European markets in over a year—the catalyst being Trump’s Tuesday speech, in which he stated that the U.S. could withdraw from Iran in as little as two to three weeks and that a formal diplomatic agreement isn’t even necessary to end military operations; the markets immediately interpreted this as a signal of a shift to a “mission accomplished” narrative
  • Added to this is a statement by Iranian President Pezeshkian, who declared his willingness to end the conflict—but only in exchange for formal security guarantees. That was enough for Asian stock markets to post their strongest one-day gains in over three years (MSCI Asia Pacific +4.9%, Kospi +8.5%, Nikkei +5%).
  • However, wary investors point out that Israel still isn’t talking about a ceasefire, the Wall Street Journal reports on the UAE’s possible entry into the conflict, and Iran has so far shown no real willingness to negotiate—which is why some strategists, including those at Mizuho, are advising skepticism regarding the scale of the rally
  • The highlight of the evening will be Trump’s speech at 3:00 a.m. (Thursday), in which the U.S. president is expected to address Iran and potentially the NATO alliance, which Trump has recently described as “weak.” Furthermore, The Telegraph reported today that Trump is even considering withdrawing from the alliance. 

The dollar is weakening, while gold and bonds are gaining ground


  • EURUSD is up 0.40% to 1.1599, reaching near three-month highs; GBPUSD is up 0.63% to 1.3304; the zloty is strengthening significantly – USDPLN is down 0.42% to 3.6907, while EURPLN is hovering around 4.2808
  • Gold continues its upward trend (+1.40%, $4,731/oz) – this time not as a barometer of fear, but as a hedge against inflation that could be driven by a potential economic recovery and ongoing uncertainty in supply chains; 10-year Treasuries are recovering, with yields falling by 3.4 basis points to 4.277%

Oil prices are falling – the market is pricing in an end to the war


  • WTI briefly dipped below the symbolic $100-per-barrel mark and is currently trading at $99.87 (-1.59%); Brent is down 0.35% to $102.89
  • However, the market remains somewhat cautious—prices aren’t falling freely because the geopolitical risk premium remains in place until the Strait of Hormuz is formally reopened and troops begin returning home

European stock indices – gains almost across the board


  • The Stoxx 600 jumps more than 2%—its strongest daily gain in a year; the DE40 rises 0.84% to 23,399 points, and the ITA40 gains 1.60% to 44,949
  • The top performers by sector are banks (UCG +6.0%, BNP +4.92%, BBVA +4.4%, HSBC +4.0%) and defense companies (Rolls-Royce +7%, Rheinmetall +6.8%, Safran +3.6%)—paradoxically, the defense sector is rising in price because markets assume that the dispute with the U.S. is a signal for further European investment in defense and the continent’s move toward self-reliance. 
  • Following Tuesday’s session on Wall Street, where the S&P 500 gained 2.9% and the Nasdaq 100 rose as much as 3.4%—one of the strongest daily gains since May 2025. – U.S. index futures are trading moderately higher again today: US500 futures +0.75% (6,616), US100 +0.96% (24,135)

European Manufacturing PMI – a pleasant surprise


  • The March PMI readings for European industry generally delivered positive surprises: the eurozone at 51.6 points (forecast: 51.4), Germany 52.2 points (forecast: 51.7) – this signals that Europe’s largest economy is effectively emerging from months of industrial weakness, driven in part by disruptions in global supply chains
  • Switzerland is the standout performer, with an index of 53.3 points compared to a consensus forecast of just 47.0 points—one of the largest positive deviations from forecasts in the history of this reading; Spain, however, is a disappointment (48.7 vs. a forecast of 50.4), as is Poland (48.7—above forecasts, but still in contraction territory below 50 points)
  • It is worth noting that part of the improvement in the PMI is a statistical effect caused by supply chain disruptions—higher prices and logistical difficulties are artificially inflating the index; Reuters rightly points out that “supply chain disruptions have inflated growth figures,” so the data should be interpreted with a degree of caution

Companies – What to Watch Today


  • The chemical sector is one of the biggest beneficiaries of the conflict and is performing exceptionally well this quarter—the Stoxx 600 Chemicals index has gained ~6% year-to-date (vs. -1.5% for the broader market); BASF raised detergent prices by 30%, Lanxess announced a 40% price hike for sulfur products; Morgan Stanley notes that European chemical companies may be regaining market share lost over the years to Asia
  • Nike sent the sports apparel sector into a tailspin after yesterday’s market close – the company forecast a 2–4% decline in revenue for the current quarter (vs. an expected 2% increase), and its shares plummeted 9.1% in after-hours trading; Citi warns of a negative ripple effect for Adidas, Puma, and JD Sports—JD Sports is particularly vulnerable due to its high exposure to Nike products in Europe
  • LVMH  closed out the worst quarter in its history – shares fell 28% in Q1 2026, worse than during the 2008 financial crisis, the COVID-19 pandemic, and the dot-com bubble; Bernard Arnault’s fortune shrank by $55.4 billion; the company is currently trading at less than 20x forward earnings
  • Citi is upgrading three defense stocks to “Buy” today: Babcock, Leonardo, and TKMS, citing attractive valuations following the recent correction; JPMorgan, meanwhile, is upgrading Unibail-Rodamco-Westfield to “Overweight” and Engie to “Overweight”; Ferrari receives a “Buy” rating from Jefferies with a target price of 350 euros
  • Equinor has been placed on SEB Equities’ “sell” list – analysts point to “significant downside” at current valuations, as they believe the period of superprofits stemming from the current conflict is temporary; this is an interesting contrarian view amid the general enthusiasm
  • Orlen has signed a preliminary agreement to acquire Polyolefins from Grupa Azoty – a significant consolidation move in the Polish petrochemical sector amid global supply chain disruptions
  • OpenAI has been valued at $852 billion following a $122 billion funding round—one of the largest private investment rounds in the history of technology; for European AI companies, this signals that investment appetite for artificial intelligence remains strong despite geopolitical turbulence

The material on this page does not constitute financial advice and does not take into account your level of understanding, investment objectives, financial situation or any other specific needs. All information provided, including opinions, market research, mathematical results and technical analyzes published on the Website or transmitted To you by other means, it is provided for information purposes only and should in no way be construed as an offer or solicitation for a transaction in any financial instrument, nor should the information provided be construed as advice of a legal or financial nature on which any investment decisions you make should be based exclusively To your level of understanding, investment objectives, financial situation, or other specific needs, any decision to act on the information published on the Website or sent to you by other means is entirely at your own risk if you In doubt or unsure about your understanding of a particular product, instrument, service or transaction, you should seek professional or legal advice before trading. Investing in CFDs carries a high level of risk, as they are leveraged products and have small movements Often the market can result in much larger movements in the value of your investment, and this can work against you or in your favor. Please ensure you fully understand the risks involved, taking into account investments objectives and level of experience, before trading and, if necessary, seek independent advice.

USD/INR tumbles at open as Middle East war de-escalates

April 1, 2026
  • The Indian Rupee recovers strongly against the US Dollar as both the US and Iran signal readiness to end the war.
  • Iran wants guarantees of no repetitive aggression from the US in return for peace.
  • FIIs continue to dump their stake in the Indian stock market.

The Indian Rupee (INR) opens higher against the US Dollar (USD) on Wednesday after a holiday due to the Shri Mahavir Jayanti the previous day. The USD/INR pair slumps to near 93.65 from the all-time high of 95.22 posted on Monday, as a significant de-escalation in the Middle East war, following comments from both the United States (US) and Iran signaling their willingness to end the war, has improved the appeal of risk-sensitive assets.

US and Iran show readiness to end Middle East war

On Tuesday, Iran’s President Masoud Pezeshkian told European Union (EU) Council President António Costa that his country is ready to end the war with the US, but it needs certain guarantees especially no repetition of aggression, Iranian state news agency reported.

These comments from Iran came after US President Donald Trump announced that Washington is willing to end the war with Iran despite the Strait of Hormuz remaining closed, a channel to almost 20% of global oil supply. Trump added that forcing the waterway back open would mean extending the military mission beyond his timeline of four to six weeks, Wall Street Journal (WSJ) reported.

Meaningful signs of US-Iran war de-escalation have diminished demand for safe-haven assets, such as the US Dollar. As of writing, the US Dollar Index (DXY), which tracks the Greenback’s value against six major currencies, trades subduedly near Tuesday’s low around 99.85. The USD Index fell almost 0.8% on Tuesday after posting a fresh 10-month high at around 100.65.

FIIs continue to pare stake in Indian stock market

Currencies from economies like India, which are in their developing stage, rely heavily on foreign investments for a strong financial system. The consistent outflow of foreign funds from the Indian stock market has battered the Indian Rupee significantly in the past months.

In March, Foreign Institutional Investors (FIIs) offloaded their stake worth Rs. 1,22,539.89 crore from the Indian stock market due to the war in the Middle East, assuming that higher oil prices in the wake of the war would be a drag on Nifty 50 Q4FY2025-26 earnings.

US data awaited

On Wednesday, investors will focus on the US ADP Employment Change and the ISM Manufacturing PMI data for March, and Retail Sales data for February, which will be published in the North American session. Economists expect US private sector to have created 40K fresh jobs, lower than 63K in February.

The ISM is expected to report that the Manufacturing PMI will tick higher to 52.5 from the previous reading of 52.4. US Retail Sales are estimated to have grown 0.5% after declining 0.2% in January.

Technical Analysis: USD/INR retraces from all-time highs of 95.22

USD/INR corrects sharply from the all-time high of 95.22 to near 93.65 in the opening session on Wednesday. However, the continuation of higher highs and higher lows from the 90s area suggests that the bullish trend is bullish. The ascending 20-day Exponential Moving Average (EMA) near 93.13 confirms a strong bullish tone.

The 14-day Relative Strength Index (RSI) falls below 60.00 after remaining inside the 60.00-80.00 zone for a longer period, indicating the suspension of the bullish momentum with the upside bias remaining intact.

Initial support emerges at 20-day EMA, which is around 93.13, followed by previous peak levels in the 92.00-92.35 range. A downside break below the range would dent the overall bullish structure and open the way towards the March 5 low of 91.35. On the upside, the all-time high of 95.22 will be the major barrier for the spot price. A decisive break above the same would boost the odds of an extension of the advance toward 96.00.

AUD/USD – Middle East peace hopes back further recovery towards 20-day EMA

April 1, 2026
  • AUD/USD rises further to near 0.6910 as de-escalation in the Middle East war has boosted investors’ risk appetite.
  • Both the US and Iran have signaled readiness to end the Middle East war.
  • Investors await the US ADP Employment data for fresh cues on the interest rate outlook.

The AUD/USD pair gives back some of its early gains, but still trades 0.12% higher to near 0.6910 during the late Asian trading session on Wednesday. The Aussie pair extends Tuesday’s recovery move, as hopes of a ceasefire in the Middle East have strengthened after comments from both the United States (US) and Iran signaling willingness to end the war.

The expectation of an end to the month-long Middle East war has improved the demand of riskier assets. As of writing, S&P 500 futures trade 0.33% higher even after surging almost 3% on Tuesday, reflecting a significant improvement in investors; risk appetite.

Meanwhile, the US Dollar (USD) extends its corrective move as its safe-haven demand has diminished amid de-escalating Middle East tensions. During the press time, the US Dollar Index (DXY), which gauges the Greenback’s value against six major currencies, trades 0.1% lower to near 99.75.

Going forward, investors will focus on the US ADP Employment Change and the Manufacturing PMI data for March, which will be published in the North American session. Investors will pay close attention to the private employment data to get fresh cues on the US interest rate outlook.

AUD/USD technical analysis

AUD/USD trades higher at around 0.6910 at the press time. However, the near-term bias is mildly bearish as the pair now holds below the 20-day Exponential Moving Average (EMA), which has started to roll over after capping recent rebounds near the 0.70 area. Price has transitioned from trading above this average to respecting it as dynamic resistance, underscoring a loss of upside momentum from the mid-0.71 region.

The recovery move by the 14-day Relative Strength Index (RSI) above 40.00 after sliding below that level signals the presence of buying interest at lower levels, which diminishes the strength of an overall bearish tone.

Initial resistance emerges at 0.6980, where the 20-day EMA clusters with recent minor swing highs, followed by stronger resistance at 0.7050, whose break would be needed to challenge the 0.7120 peak. On the downside, the March 31 low at 0.6834 is the immediate support is at 0.6885, guarding the late pullback lows, with a break exposing the January 7 high of 0.6766 as the next level.