

The Overbalance analysis aims to identify three financial instruments, analyzed primarily on the daily/four-hour (D1/H4) timeframe. The analysis uses only the Overbalance methodology, which helps determine where a trend may continue or where it may reverse.
Today’s analysis covers three instruments, evaluated solely in terms of 1:1 correction structures.
EURNZD
Last week, the EURNZD broke through key resistance at 1.9855, which corresponded to the upper boundary of the 1:1 geometric pattern. According to the Overbalance methodology, this breakout suggests potential for a move toward last November’s highs, around 2.0680. An additional argument in favor of the bullish scenario is the earlier double bounce off support at 1.9540. In the event of a correction, the 1.9855 level should act as short-term support.
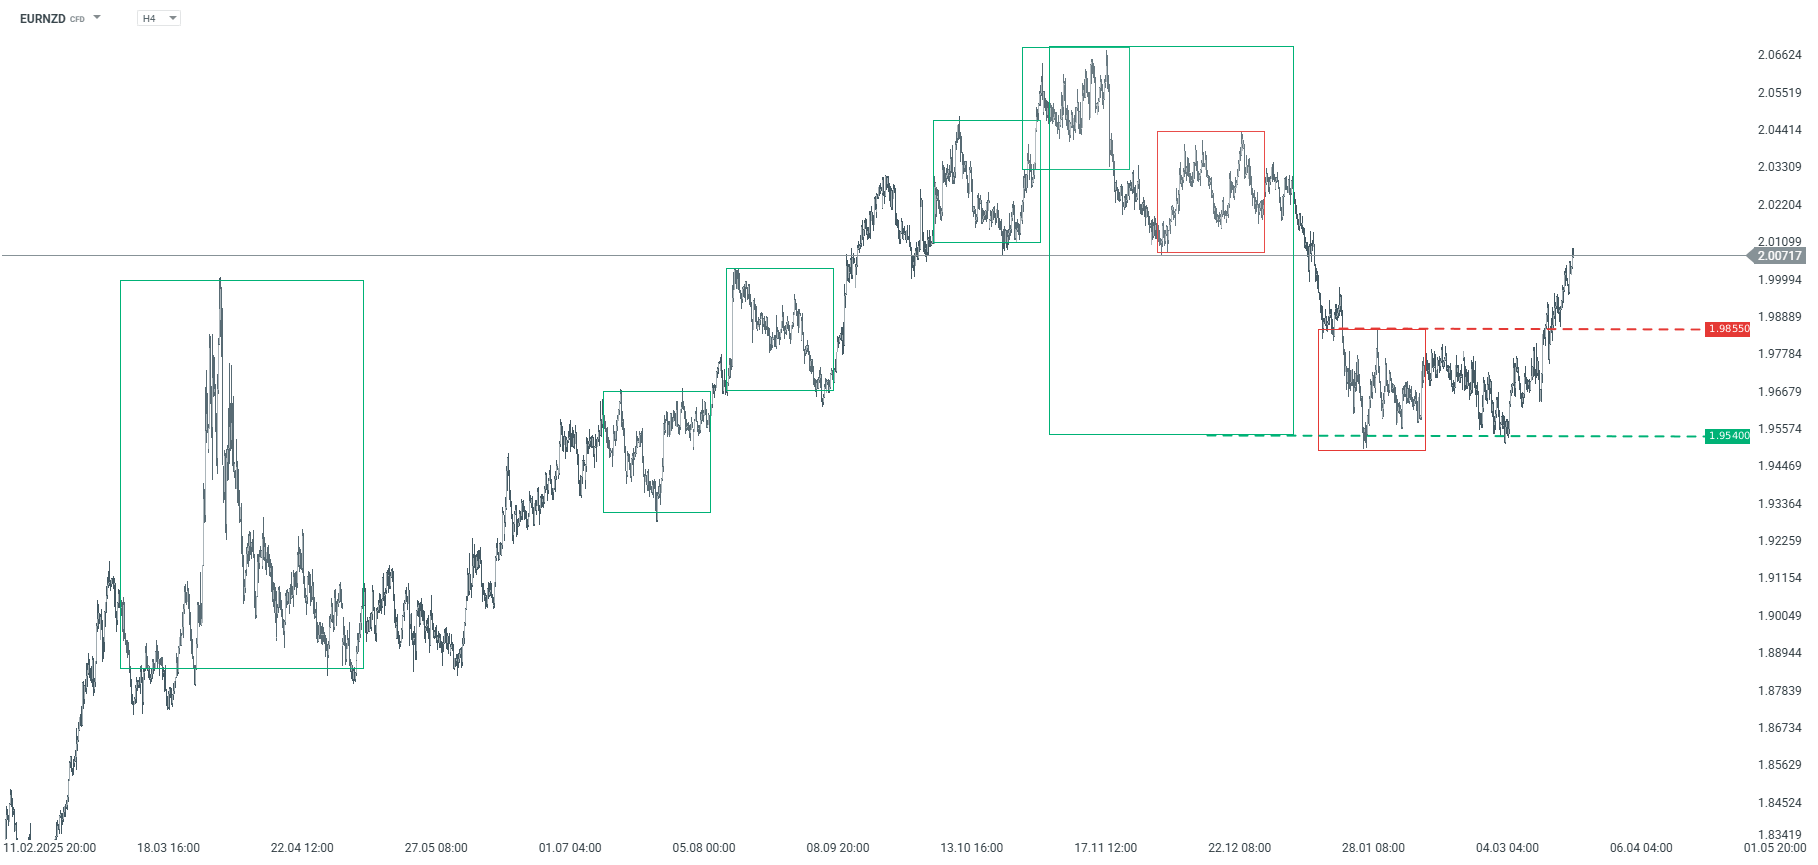
EURNZD – H4 timeframe. Source: xStation
EURCAD
The EURCAD pair is attempting to resume its upward trend. The price has broken above the upper boundary of the 1:1 bearish pattern at the 1.5945 level and has also broken above the polarity of the previous bullish pattern, which falls exactly at the same point. According to the Overbalance methodology, as long as the price remains above the 1.5945 level, the bullish scenario remains in effect.
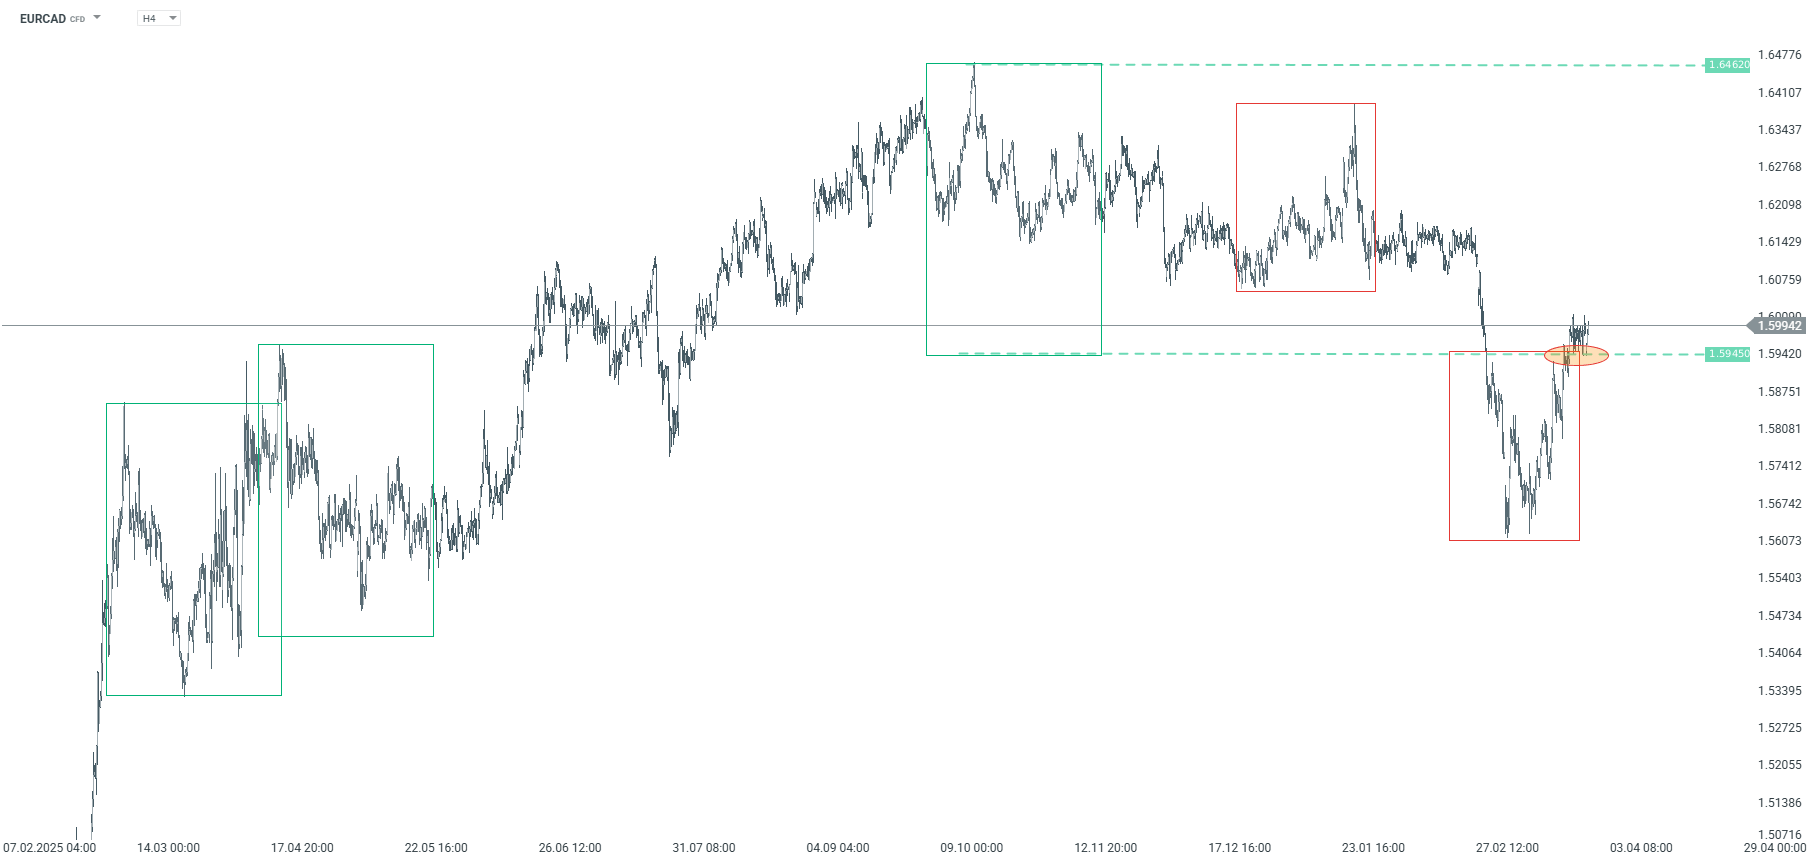
EURCAD – H4 timeframe. Source: xStation
AUDUSD
The AUDUSD price has broken below the key support level at 0.6905, which corresponded to the lower boundary of a broad 1:1 pattern. A break below this level could support a scenario involving a deeper correction or even a trend reversal. Currently, the 0.6905 level acts as key resistance. To signal a return to an uptrend, the price would need to additionally break above the 0.6984 level, where the upper boundary of the local 1:1 downtrend pattern is located.
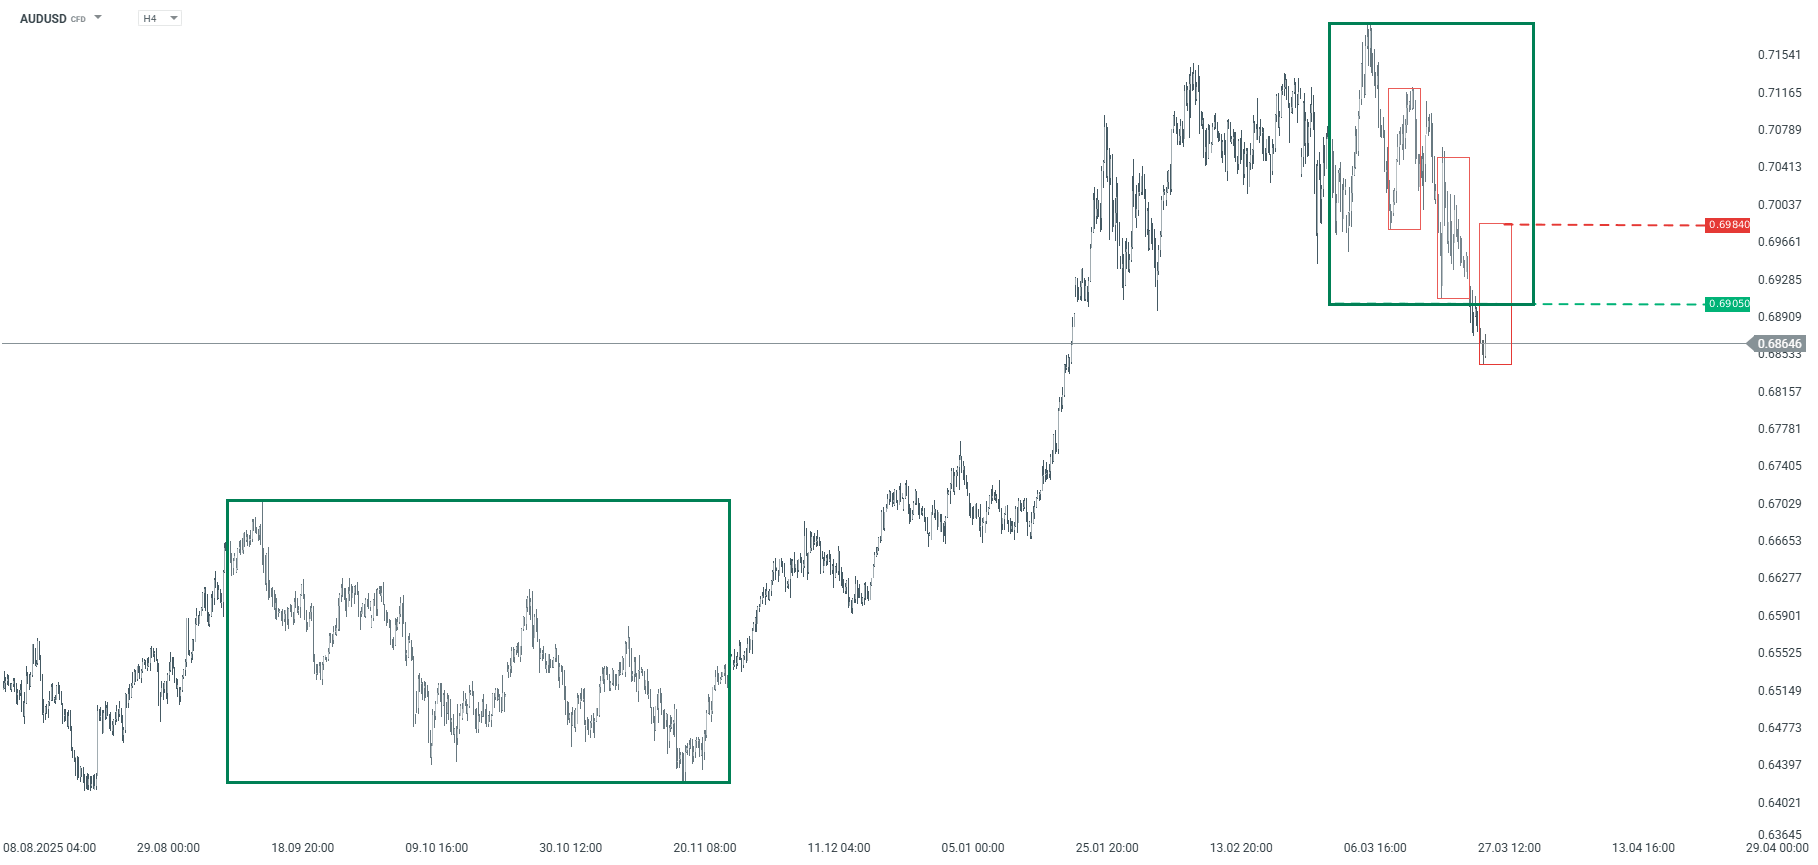
AUDUSD – H4 chart. Source: xStation
The material on this page does not constitute financial advice and does not take into account your level of understanding, investment objectives, financial situation or any other specific needs. All information provided, including opinions, market research, mathematical results and technical analyzes published on the Website or transmitted To you by other means, it is provided for information purposes only and should in no way be construed as an offer or solicitation for a transaction in any financial instrument, nor should the information provided be construed as advice of a legal or financial nature on which any investment decisions you make should be based exclusively To your level of understanding, investment objectives, financial situation, or other specific needs, any decision to act on the information published on the Website or sent to you by other means is entirely at your own risk if you In doubt or unsure about your understanding of a particular product, instrument, service or transaction, you should seek professional or legal advice before trading. Investing in CFDs carries a high level of risk, as they are leveraged products and have small movements Often the market can result in much larger movements in the value of your investment, and this can work against you or in your favor. Please ensure you fully understand the risks involved, taking into account investments objectives and level of experience, before trading and, if necessary, seek independent advice.
