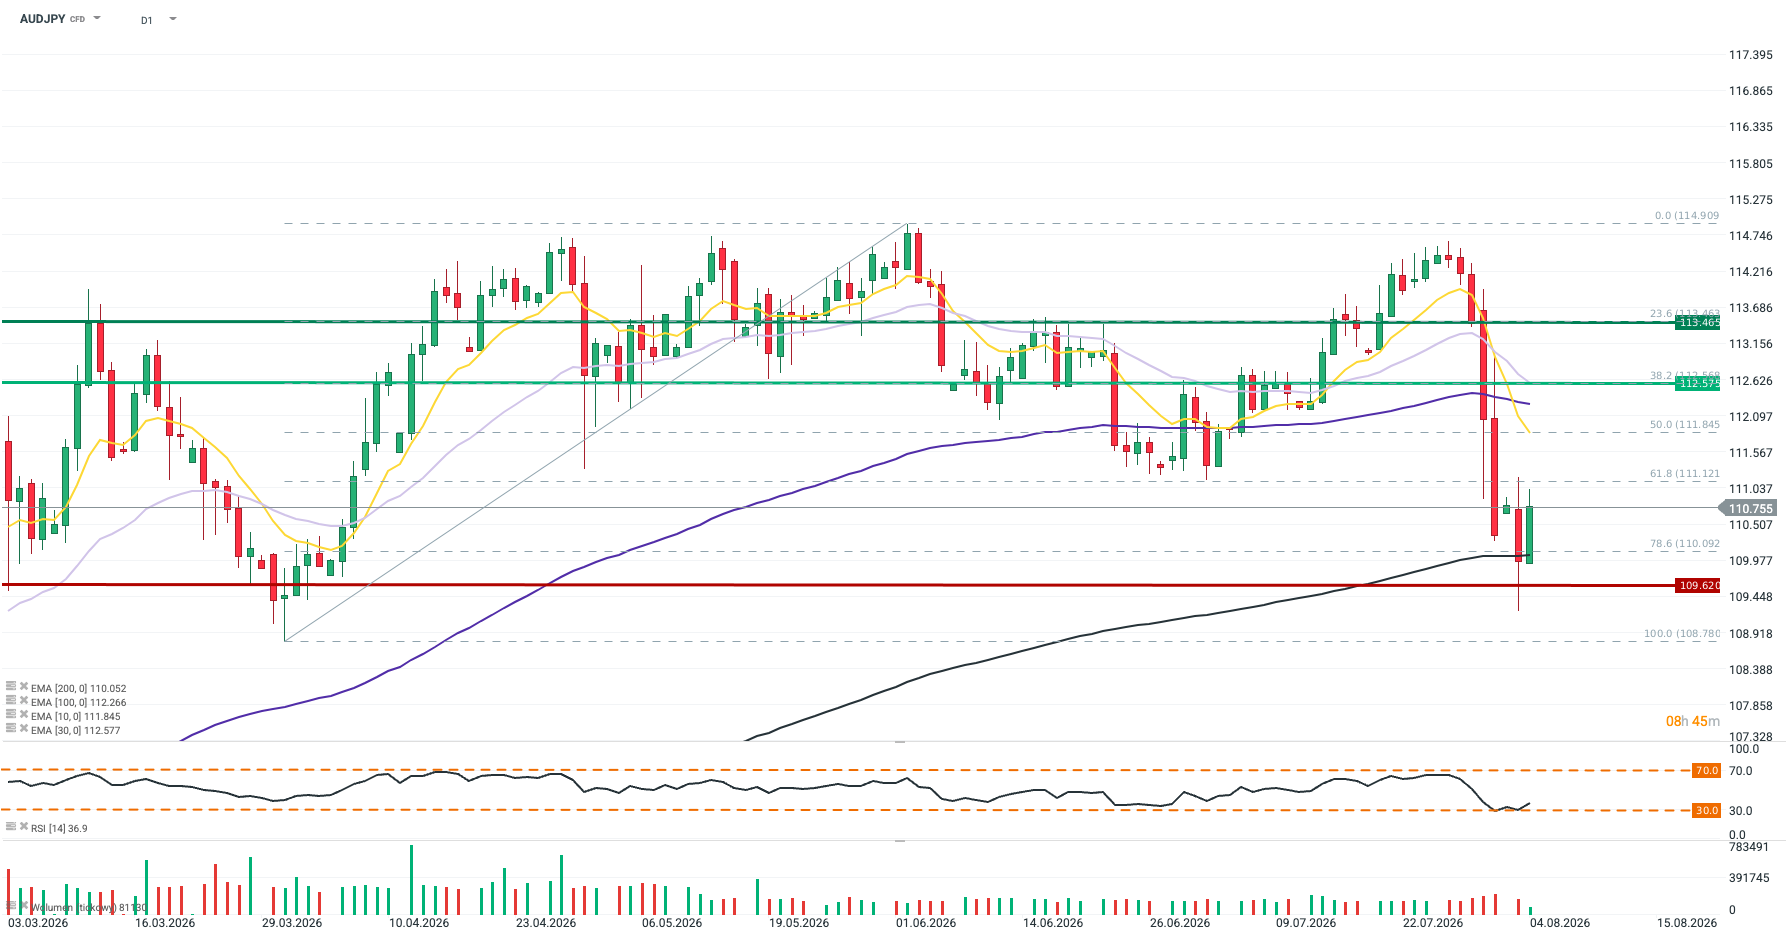
Recent currency interventions on the yen and a unified narrative from Japanese and US authorities standing behind the Japanese currency (US Treasury Secretary Bessent today: “The United States will do everything in its power to support the yen”) led to a sharp sell-off in JPY-led pairs (AUDJPY: -3.5%, USDJPY: -3.9%, EURJPY: -2.6% change over the past week). The determination communicated by Tokyo and Washington should limit speculative selling of the yen; however, a sustained recovery in the Japanese currency will likely only be possible following stabilization in the bond market and a clear hawkish turn by the Bank of Japan. With current interest rates (Australia: 4.35%, Japan: 1.00%), the recent AUDJPY sell-off enhances the appeal of the carry trade, even in light of recent, fairly dovish remarks from the RBA. A rebound off the 200-day EMA (black), combined with a global increase in risk appetite (gains in risk assets, falling oil prices, de-escalation in the Middle East), should therefore motivate at least a local upward correction in AUDJPY. This is further supported by the fact that AUDUSD itself remains in an uptrend (trading above the EMA30 and EMA100 on the daily interval), bolstered by the recent decline in US rate hike expectations.
Methodology
This recommendation was prepared based on a technical analysis of the AUDJPY chart and a fundamental analysis of the respective economies (monetary policy in Japan, Australia, and the US). The directional bias was determined using moving averages and market expectations regarding central bank policies. Take Profit and Stop Loss levels were established using Fibonacci retracements and price action:
TP1 is set at the 38.2% Fibonacci level.
TP2 is set at the 23.6% Fibonacci level.
SL is placed between the 100% and 78.6% Fibonacci levels, slightly below the EMA200.
The past week brought a sharp bout of volatility to global markets, particularly within the commodities sector.
An initial rebound in crude prices, fueled by escalating tensions in the Middle East, reverberated with redoubled force across weather-sensitive agricultural commodities. Markets enter the new week with attention firmly fixed on the United States. The macroeconomic calendar is packed with pivotal events poised to shape investor sentiment over the coming days.
The main highlights include the release of US consumer price index (CPI) data for June, congressional testimony by the newly appointed Fed Chair Kevin Warsh, and the official kickoff of the Wall Street earnings season. Given this confluence of catalysts, three markets warrant close scrutiny in the near term: GOLD , US500 and COCOA .
GOLD
This week, investor focus in the gold market will shift entirely toward the US dollar and the interest rate outlook, both of which face two powerful catalysts. On Tuesday, the US June CPI reading will be released, with consensus expectations pointing to a moderate deceleration in price growth. Following the release of the FOMC minutes, the market will pivot to the next Warsh-related event: the Fed Chair’s semi-annual testimony before Congress. Warsh will appear before the House Financial Services Committee on Tuesday, followed by questioning from the Senate Banking Committee on Wednesday.
Historically, during leadership transitions at the Federal Reserve, markets closely parse every word for clues regarding the future path of monetary policy. Hints of a more dovish tilt would provide potent fuel for a rally in gold, whereas unyielding hawkish rhetoric could unleash heavy selling pressure. However, it is worth noting that Warsh himself has signaled he does not intend to offer forward guidance to the markets. Consequently, the market’s own interpretation of his remarks will be critical.
US500 (S&P 500 Futures)
For the US equity market and its benchmark S&P 500 index, this week marks the commencement of another crucial corporate earnings season. Traditionally, the cycle kicks off with Wall Street’s banking giants; JPMorgan Chase, Citigroup, Wells Fargo, Goldman Sachs, and Bank of America are all scheduled to report on Tuesday.
Beyond financials, investors will closely dissect earnings from tech heavyweights ASML and TSMC (Wednesday and Thursday) as well as Netflix (Thursday). Juxtaposing these corporate results with Wednesday’s release of the Federal Reserve’s Beige Book and Thursday’s US retail sales data will provide a more comprehensive economic mosaic. This will allow market participants to gauge whether the US economy and its consumers remain resilient enough to sustain corporate earnings capable of justifying today’s stretched equity valuations.
COCOA
Cocoa has enjoyed a spectacular first half of the year. Following a sharp sell-off early on, the soft commodity is currently staging a massive rebound. While current prices remain below the historic highs printed in 2024, they have surged by roughly 60% since the El Niño weather phenomenon was officially declared last month. Measured from its recent troughs, the pace of the rebound reaches as high as 120%. Violent volatility in recent days has been driven by supply anxieties out of West Africa, where cocoa crop development was initially hit by torrential rains, and plantations are now threatened by the hot, dry conditions associated with El Niño.
Furthermore, the ICE exchange raised margin requirements in response to market instability, a move that only exacerbated swings and forced the capitulation of some speculative capital. This week will prove pivotal for investors in this market as attention shifts from weather patterns to hard demand data. Crucial quarterly European cocoa grindings data is due on Thursday.
A recent report from industry giant Barry Callebaut did register the first increase in sales volumes in over two years—partly driven by an earlier price correction—but the company simultaneously warned that global confectionery consumption remains under pressure. Following such a monumental rally from its lows, the upcoming grindings data will serve as an absolute litmus test of whether high prices have triggered genuine demand destruction, or if the market still has room to run.
The upcoming week will bring a major test for the US Dollar (USD), with investors focusing on the United States Consumer Price Index (CPI), Federal Reserve (Fed) Chair Kevin Warsh’s congressional testimony and a broad set of activity indicators. China’s second-quarter Gross Domestic Product (GDP) and the Bank of Canada’s (BoC) interest-rate decision will also attract significant attention.
The US Dollar Index (DXY) trades near 101.00, recovering from a one-week low hit earlier on Friday as investors balance softer recent labor market data against renewed geopolitical uncertainty and persistent inflation concerns. Tuesday’s US CPI report will be the central event for the Greenback.
Headline CPI is expected to decline 0.1% MoM in June, following a 0.5% increase in May, while annual inflation previously stood at 4.2%. Core CPI is forecast to rise 0.3% MoM, up from 0.2%, while the annual core rate is expected to remain unchanged at 2.9%.
On another note, Fed Chair Warsh will testify on Tuesday and Wednesday, giving markets an opportunity to assess how policymakers balance elevated inflation against signs of weaker hiring. Comments from several Fed officials and the release of the Beige Book will provide additional guidance.
US Dollar Price Today
The table below shows the percentage change of US Dollar (USD) against listed major currencies today. US Dollar was the strongest against the Swiss Franc.
USD
EUR
GBP
JPY
CAD
AUD
NZD
CHF
USD
0.12%
0.07%
-0.42%
-0.08%
-0.17%
-0.14%
0.21%
EUR
-0.12%
-0.05%
-0.54%
-0.19%
-0.30%
-0.27%
0.09%
GBP
-0.07%
0.05%
-0.50%
-0.13%
-0.25%
-0.23%
0.13%
JPY
0.42%
0.54%
0.50%
0.34%
0.25%
0.25%
0.60%
CAD
0.08%
0.19%
0.13%
-0.34%
-0.10%
-0.08%
0.27%
AUD
0.17%
0.30%
0.25%
-0.25%
0.10%
0.02%
0.35%
NZD
0.14%
0.27%
0.23%
-0.25%
0.08%
-0.02%
0.34%
CHF
-0.21%
-0.09%
-0.13%
-0.60%
-0.27%
-0.35%
-0.34%
The heat map shows percentage changes of major currencies against each other. The base currency is picked from the left column, while the quote currency is picked from the top row. For example, if you pick the US Dollar from the left column and move along the horizontal line to the Japanese Yen, the percentage change displayed in the box will represent USD (base)/JPY (quote).
EUR/USD trades lower near 1.1420, retreating as the US Dollar recovers from its weekly low, and is set to finish the week with a 0.19% loss. The pair will remain highly sensitive to US CPI and Warsh’s testimony, while the European calendar includes industrial production and final inflation figures.
GBP/USD trades near 1.3400, with a weekly gain of around 0.34% after reaching a three-week high. The Pound Sterling (GBP) faces an important domestic calendar, with United Kingdom (UK) GDP, industrial production, and manufacturing output due on Thursday. UK GDP is expected to grow 0.1% MoM in May, following a 0.1% contraction. Industrial production is forecast to rise 0.1%, while manufacturing production is expected to decline 0.1% after increasing 0.4% previously.
USD/JPY trades lower near 161.70 on Friday but is set to close the week with a 0.24% gain. The pair will remain driven by US Treasury yields, Fed expectations, and concerns over possible intervention by Japanese authorities. A hotter-than-expected US CPI report could lift yields and revive upward pressure on USD/JPY. Softer inflation could extend the pair’s decline and offer further support to the Japanese Yen.
AUD/USD trades slightly higher near 0.6950, supported by a softer broader US Dollar backdrop and recent strength in the Chinese Yuan. However, the Aussie’s direction next week will depend heavily on Chinese economic data and US inflation. Wednesday’s Chinese GDP report is expected to show the economy expanding 4.4% YoY in the second quarter, slowing from 5%. Quarterly growth is forecast at 0.9%. Industrial production is expected to rise 4.7%, while retail sales are projected to decline 0.1% YoY.
USD/CAD trades lower near 1.4150 ahead of Wednesday’s Bank of Canada policy decision. The BoC is expected to leave its benchmark rate unchanged at 2.25%. The accompanying Monetary Policy Report, policy statement and press conference will be closely examined for guidance on inflation, domestic demand and future rate moves. A hawkish message could extend USD/CAD’s decline, while a cautious stance may limit the Canadian Dollar’s strength.
West Texas Intermediate (WTI) Oil trades muted near $71.60 per barrel as investors assess the risk of renewed supply disruptions linked to tensions between the United States and Iran. Oil prices could become more volatile if diplomatic efforts deteriorate further or concerns surrounding Middle Eastern supply routes intensify. However, signs of weaker global demand, particularly from China, may limit gains.
Gold trades lower near $4,102, losing ground as the US Dollar recovers and investors prepare for the US inflation report. The precious metal remains supported by geopolitical uncertainty, although higher Treasury yields could create additional pressure.
Anticipating economic perspectives: Voices on the horizon
Monday, July 13:
Fed’s Bowman
Fed’s Waller
ECB’s Schnabel
BoE’s Pill
Tuesday, July 14:
Fed’s Warsh
Fed’s Barr
Fed’s Goolsbee
Fed’s Cook
Fed’s Bowman
BoE’s Bailey
Wednesday, July 15:
Fed’s Williams
Fed’s Chair Warsh
ECB’s Nagel
Fed’s Cook
Fed’s Musalem
Thursday, July 16:
Fed’s Logan
Fed’s Schmid
Fed’s Jefferson
Friday, July 17:
ECB’s Cipollone
Central banks’ meetings and upcoming data releases to shape
The main monetary-policy event will be the Bank of Canada interest-rate decision on Wednesday, July 15. The central bank is expected to leave its policy rate unchanged at 2.25%.
The BoC will also publish its Monetary Policy Report and policy statement, followed by a press conference. No interest-rate decisions are scheduled from the Fed, ECB, BoE, BoJ, RBA or RBNZ.
he yen strengthened on Friday following an announcement by Japanese Finance Minister Satsuki Katayama that the government intends to encourage pension funds, including the GPIF, to increase their investments in domestic financial assets — a move that many analysts regard as potentially more effective in supporting the currency than direct intervention. The market reacted with a sharp, though so far short-lived, rebound in USD/JPY from above 162 to 161.29, representing a move of almost 0.7 per cent.
Can pension funds sustain this reversal in the trend?
The key question traders are asking is: will the government actually bring about a structural change in the GPIF’s asset allocation, or is this merely verbal intervention without any real action? Today’s reaction can be described as a ‘knee-jerk reaction’, highlighting that the sustainability of further yen purchases requires concrete commitment, not just declarations. Since 2020, the GPIF has maintained a symmetrical 50/50 allocation between domestic and foreign assets, and as recently as March 2025, the fund confirmed that it has no plans to change this structure until 2030, which is indicative of significant institutional inertia.
Investors need to see concrete action, not just words, for the trend of a weakening yen to be reversed — including more aggressive interest rate rises by the BOJ, a reduction in the fiscal deficit, and a genuine change in the GPIF’s asset allocation. This does not alter the fact that even a slight ‘structural shift’ in the allocation would have a huge impact given the scale of the fund, whilst supporting the currency, bonds and shares. History shows, however, that the GPIF has already made radical shifts in its allocation (for example, in 2014 it reduced the share of domestic bonds from 60% to 35%, whilst increasing its equity holdings), so the scenario of a change is not unrealistic, but it requires a formal decision by the fund’s board, not merely a comment from the minister.
Kumiharu Shigehara, the former chief economist at the BOJ, offers a different perspective in the debate, warning that a weak yen is not a strength, but a warning sign — real wages in Japan have been falling for four years running, and the benefits of depreciation mainly go to exporters and asset holders, whilst households pay a higher price for imported energy and food. In his view, a sustained strengthening of the yen requires fiscal credibility, normalisation of monetary policy and productivity growth — not mere rhetoric or intervention.
Technical analysis of the USD/JPY chart
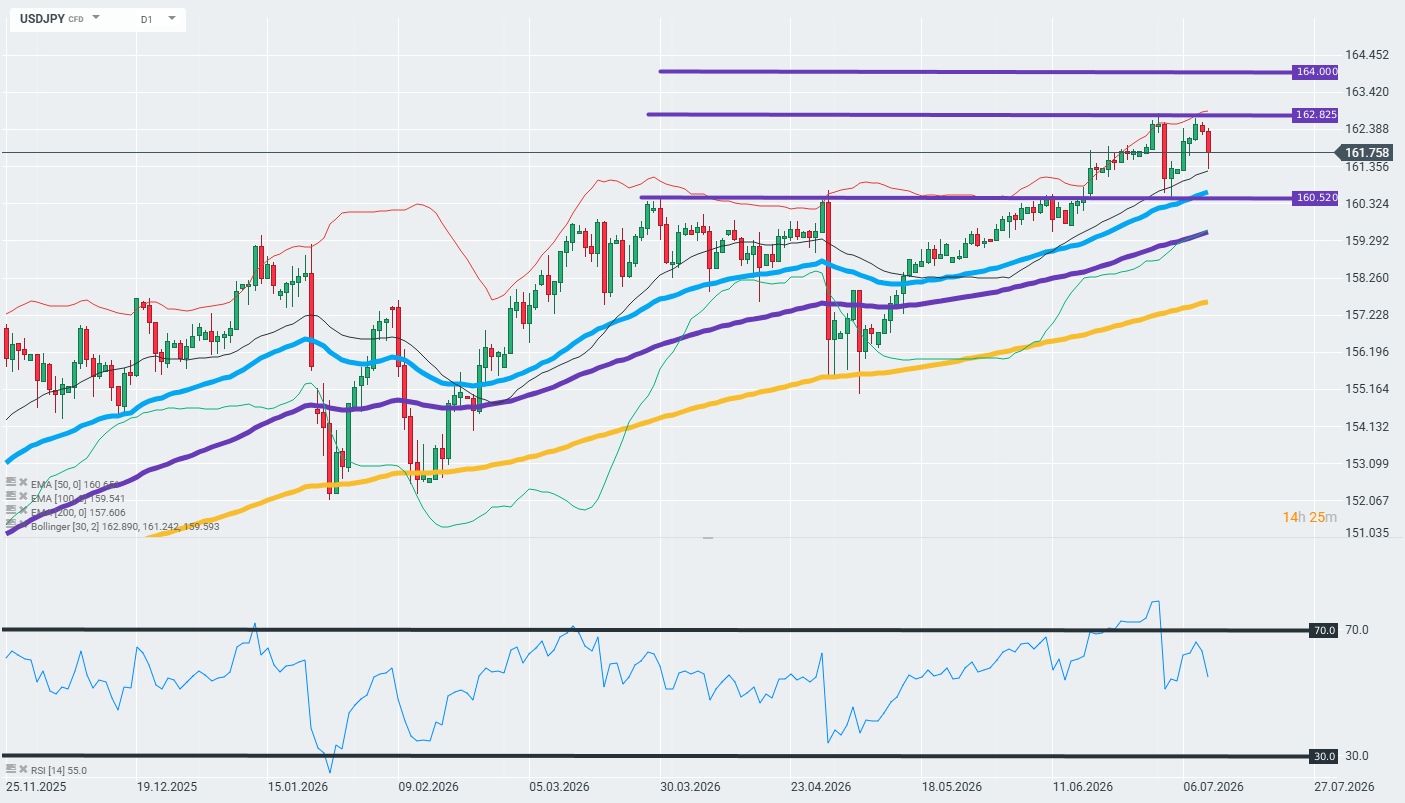
The USD/JPY daily chart shows a clear, long-term uptrend that has been in place since November 2025, with the price consistently holding above all three EMAs (50, 100, 200), which confirms the strength of the trend.
Short-term resistance: 162.825 — the high from recent sessions, from which the price has just rebounded lower following the news about the GPIF
Long-term resistance: 164,000 — the next target level should the trend continue
Key support: 160.520 — former resistance from March–April 2026, now acting as structural support, coinciding with the 50-period EMA (160.65)
The market reaction to Katayama’s comments shows a typical ‘sell the rumour’ pattern following a strong rally — the price is testing the resistance level at 162.825 and is being rejected back towards the support level at the EMA50/160.520, but this has not yet broken the main uptrend (higher lows since November).
Is the movement sustainable?
The answer is: probably not in the short term, unless the GPIF takes a formal decision to change its strategic allocation. Fundamental differences in interest rates between the US and Japan, geopolitical tensions surrounding Iran and Japan’s growing fiscal deficit are structural factors that continue to weigh on the yen, regardless of government statements. Until we see concrete steps — a genuine revision of the GPIF’s allocation, a more hawkish BOJ or progress in fiscal consolidation — Friday’s strengthening can be viewed as a technical correction within the USD/JPY uptrend, rather than a reversal of that trend. However, should a genuine change occur, the directional move could unfold very rapidly, given that investors have long been accustomed to the JPY’s tactical weakness against the USD.
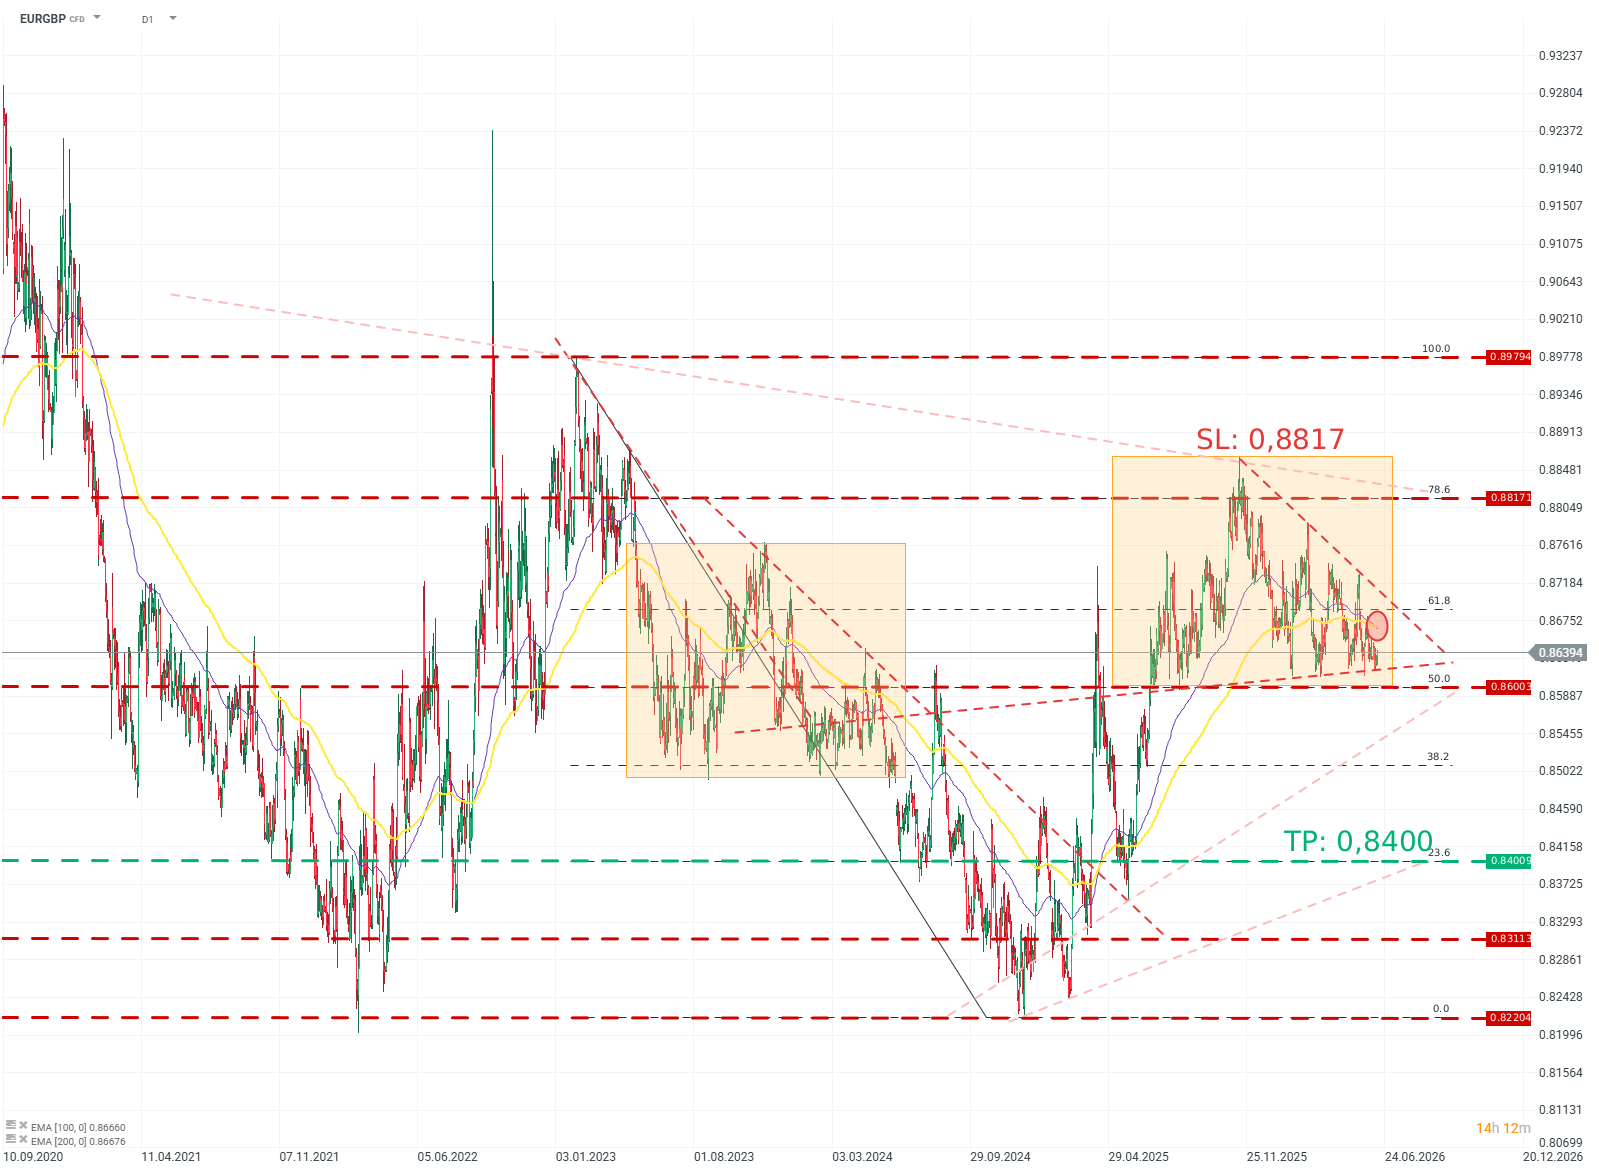
The price is near the lower boundary of a consolidation range between 0.886 and 0.861.
Upward corrections within the consolidation are breaking to increasingly lower levels, while at the same time testing resistance around 0.863.
The EMA100 has crossed the EMA200 from above.
Recommendation:
Short position (Sell) on EURGBP at the market price.
Target price (Take Profit; TP): 0.8400
Stop Loss (SL): 0.8817
EURGBP (D1)
Source: xStation5
OPINION :
The EURGBP rate is once again testing the lower boundary of the consolidation, which can also be treated as a developing 1:1 pattern, potentially ending with a downside breakout. The repeated defense of the ~0.86 level indicates the strength of this zone; however, increasingly weaker upward corrections within the consolidation reveal buyer weakness and point to the likely direction of further price movement.
Methodology and assumptions:
The recommendation is based on technical analysis of the chart, in particular EMA moving averages and Fibonacci levels.
The target level was determined based on Fibonacci levels.
The protective stop-loss order was set based on a favorable risk-to-reward ratio and with reference to a Fibonacci level.
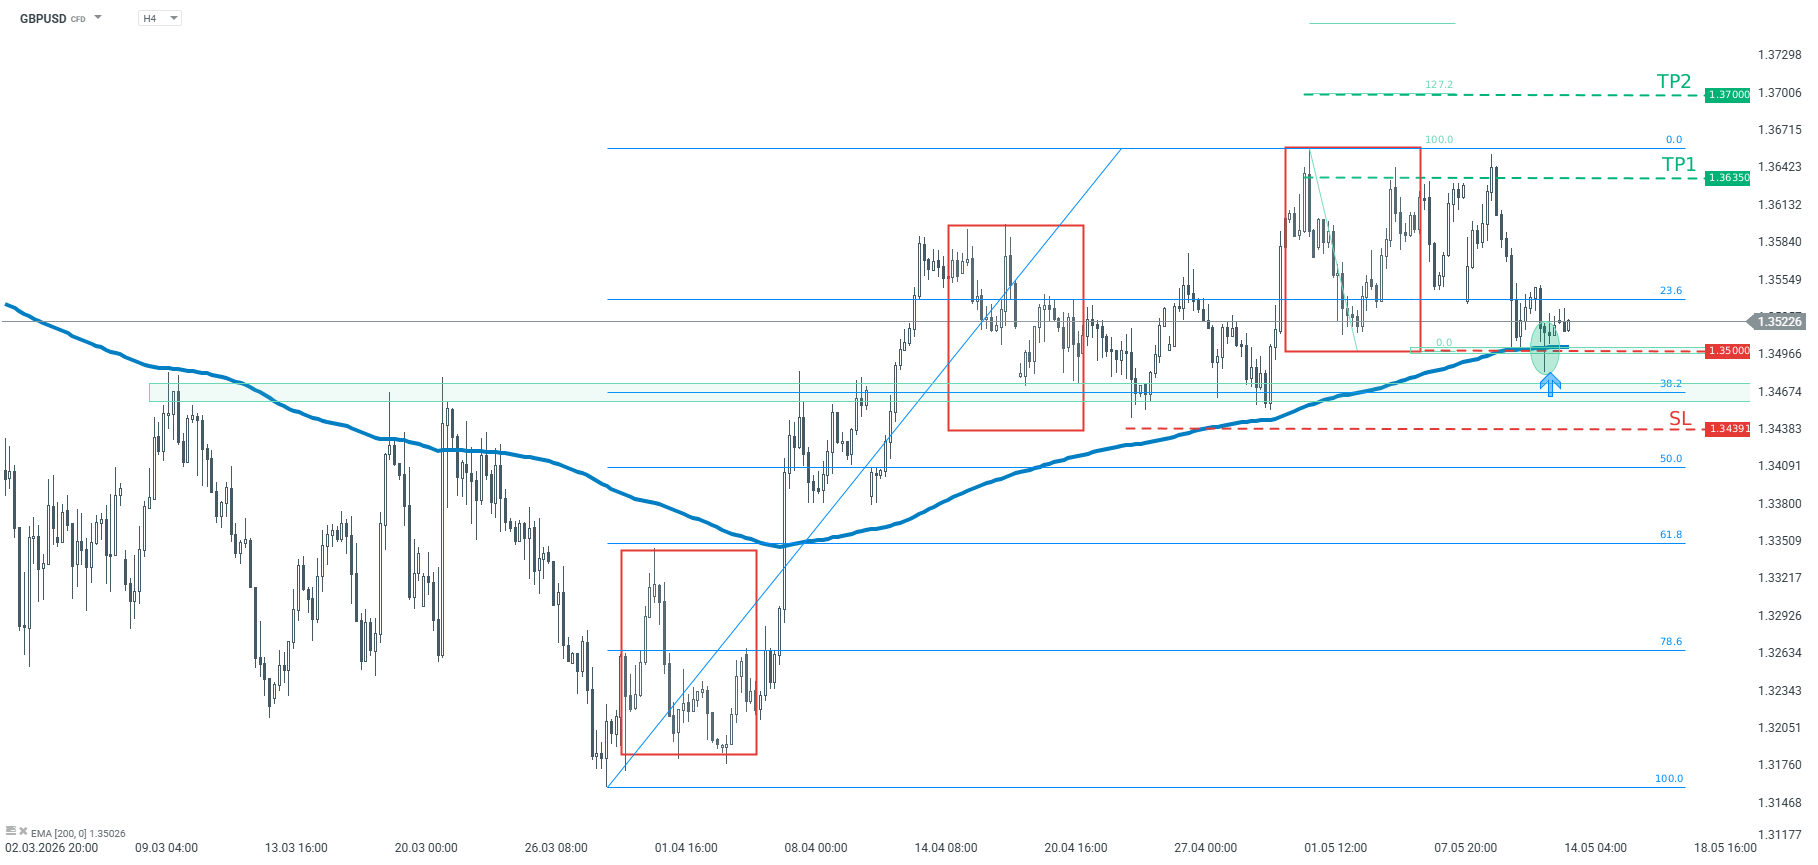
The pair bounced off the lower limit of 1:1 structure at 1.3500
Main trend on the pair remains upward from the beginning of April
Recommendation: Trade: Long GBPUSD at market price Target: 1.3635, 1.3700 Stop: 1.3439
Opinion: Looking at GBPUSD chart, one can observe that the price bounced off the key technical support marked with the lower limit of 1:1 structure (red rectangles), as well as the 200-period moving average from H4 interval. In addition, the price formed a pin bar pattern on the chart. Should buyers manage to hold the price above the support area near 1.3500, another upward impulse may be about to start. We recommend taking a long position on GBPUSD at market price with two targets: 1.3635, and 1.3700. We recommend placing a stop loss order at 1.3439.
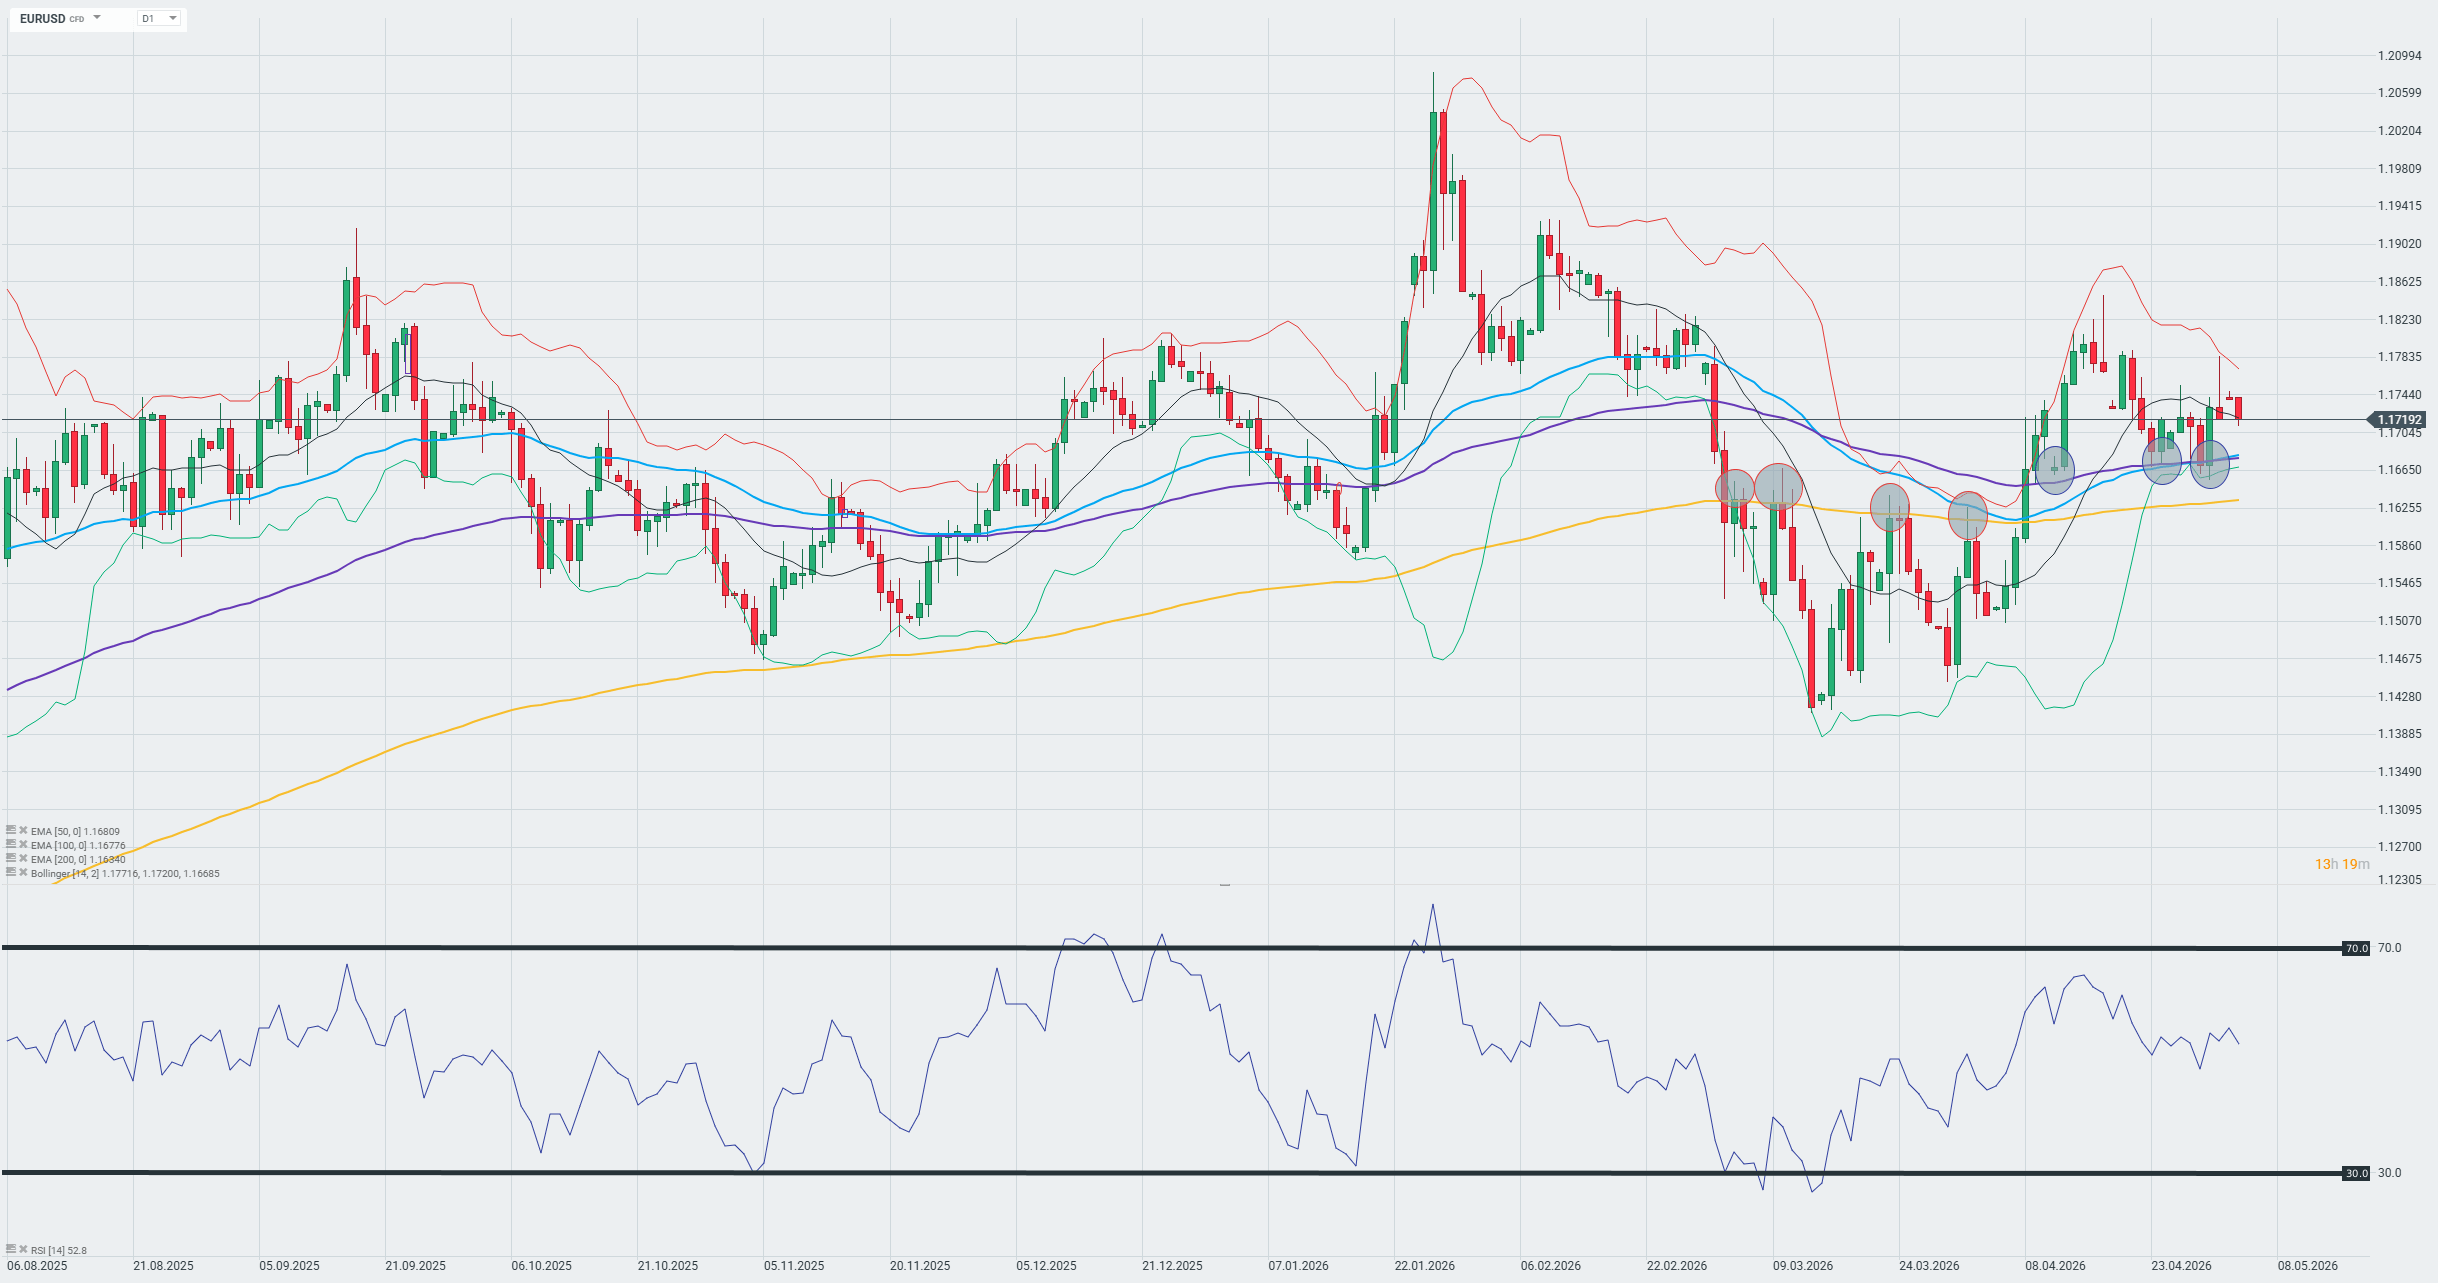
The EUR/USD exchange rate is trading around 1.1719 on Monday, and despite seemingly positive industrial data, the eurozone is sending out worrying signals. The final reading of the PMI index for the manufacturing sector stood at 52.2 points in April, up from 51.6 a month earlier, which at first glance looks like a solid improvement. In reality, however, the rise in manufacturing activity is not driven by real demand, but by increased stockpiling by firms seeking to secure goods against further shortages and price rises resulting from the escalation of tensions in the Middle East. This is a seemingly positive result, which in fact says more about the fear of supply chain disruptions than about the actual strength of the European economy. The devil is in the details, and it is these details that are shaping the outlook for both growth and inflation in the eurozone.
Delivery delays have reached their worst level since July 2022, input cost inflation has risen to a 46-month high, and price pressures are increasingly being passed on to selling prices, marking the largest monthly jump since records began in 1997. As a result, the ECB faces a real dilemma: the data suggest a recovery, but leading indicators of producer sentiment and expectations merely confirm the growing risk of stagflation. For EUR/USD, this implies an environment of heightened uncertainty, in which the exchange rate may be prone to sharp movements depending on further signals from the Fed and the ECB, and any stronger US inflation data could push the pair back towards the support level at 1.1650.
On the EUR/USD daily chart, following a sharp rally to around 1.2060 at the start of the year, the exchange rate underwent a significant correction that brought prices down to lows around 1.1380, from where a rebound occurred.
Currently, the pair is trading at 1.1719, oscillating near the 50-day EMA (1.1681) and the 100-day EMA (1.1678), which together form a dynamic support zone, while the 200-day EMA at 1.1634 serves as another line of defense for the bulls. Bollinger Bands indicate narrowing volatility, with the upper band at 1.1771 and the lower band at 1.1669, signaling a potential breakout in the coming sessions. The RSI is hovering around the neutral level of 52, which does not provide a clear directional signal and suggests that the market is still looking for momentum for a decisive move above the resistance at 1.1800 or a deeper correction toward the aforementioned 200-day EMA support.
To provide the best experiences, we use technologies like cookies to store and/or access device information. Consenting to these technologies will allow us to process data such as browsing behavior or unique IDs on this site. Not consenting or withdrawing consent, may adversely affect certain features and functions.
Functional
Always active
The technical storage or access is strictly necessary for the legitimate purpose of enabling the use of a specific service explicitly requested by the subscriber or user, or for the sole purpose of carrying out the transmission of a communication over an electronic communications network.
Preferences
The technical storage or access is necessary for the legitimate purpose of storing preferences that are not requested by the subscriber or user.
Statistics
The technical storage or access that is used exclusively for statistical purposes.The technical storage or access that is used exclusively for anonymous statistical purposes. Without a subpoena, voluntary compliance on the part of your Internet Service Provider, or additional records from a third party, information stored or retrieved for this purpose alone cannot usually be used to identify you.
Marketing
The technical storage or access is required to create user profiles to send advertising, or to track the user on a website or across several websites for similar marketing purposes.