Governor Breman’s Ultimatum: “Sooner and by More” In the most explicit tightening signal of the current monetary cycle, RBNZ Governor Anna Breman blindsided markets by announcing that the Official Cash Rate (OCR) is highly likely to rise sooner and by a larger magnitude than the central bank had previously forecasted This is not a gentle directional hint – it is unambiguous, hard forward guidance that signals an operational regime shift. The RBNZ has effectively declared that it will prioritize its price stability mandate at any cost, effectively telling the market it is prepared to hike interest rates directly through economic weakness. Today’s hawkish statement triggered the undisputed dominance of the New Zealand Dollar across global forex markets. However, explicit forward guidance is a hallmark of Breman’s RBNZ. Since the market is quickly pricing in this aggressive new policy path, the bulk of the fundamental tailwind may already be absorbed, potentially limiting further structural upside for the NZD from here.
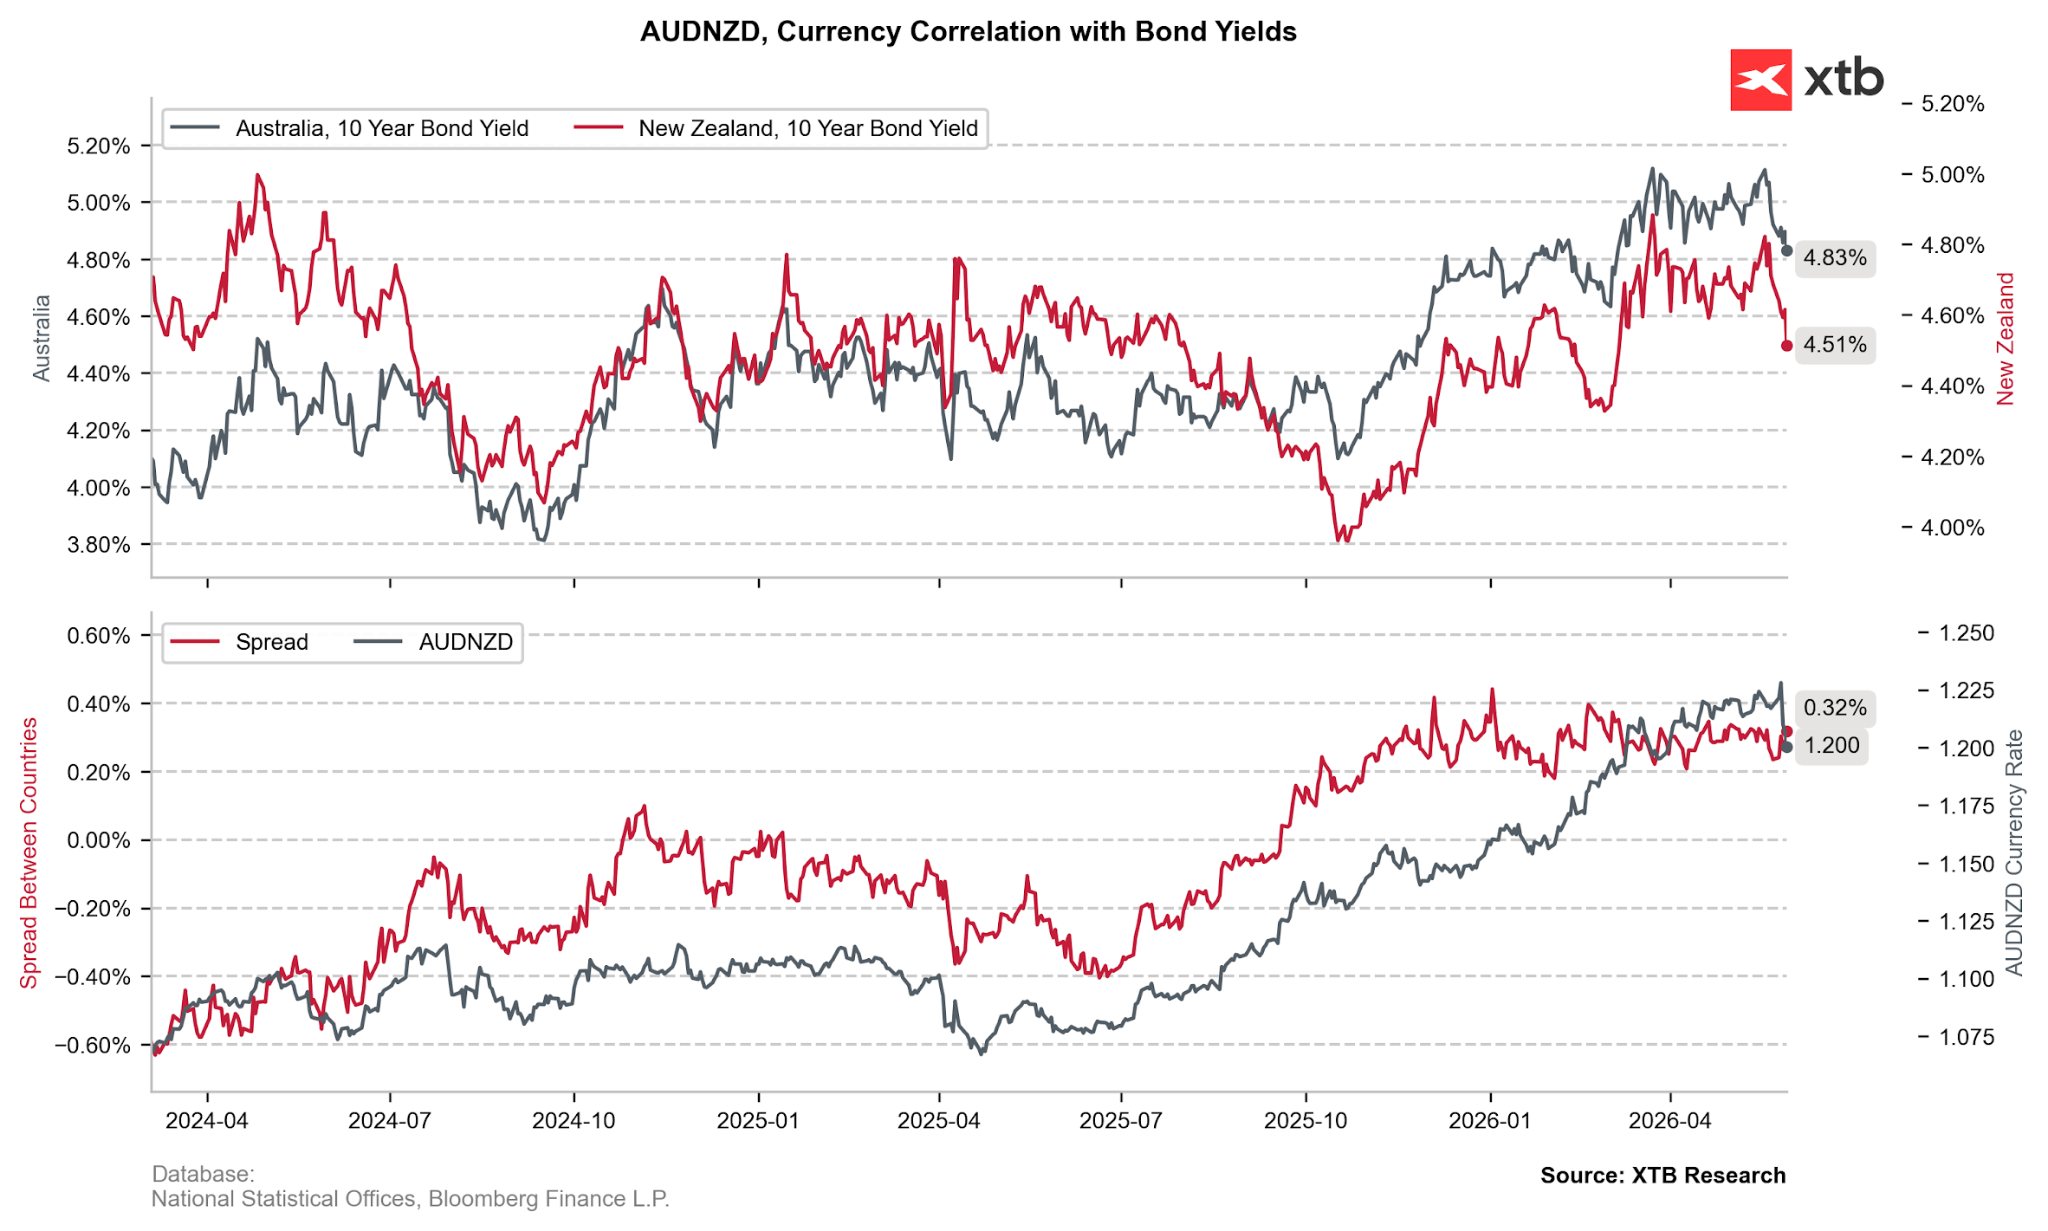
The abrupt sell-off of AUDNZD is the cleanest market demonstration of the RBNZ’s pivot. The pair lost 2.15% in just three sessions, reinforcing the correlation with the recently flat 10Y bond yield spread. Source: XTB Research The Stagflationary Catalyst: Middle East Conflict & Global Costs The justification for this aggressive posture stems from a deeply uncertain global macroeconomic environment. The RBNZ notes that New Zealand will not be insulated from international supply chain shocks:
- The Conflict Pulse: The ongoing Middle East conflict is simultaneously driving an inflation spike while choking economic growth across New Zealand and its primary trading partners.
- Supply Chain Degradation: Persistent supply chain disruptions and escalating input costs are bearing down heavily on the near-term economic outlook.
- Sacrificing Growth for Stability: For global macro investors, the message is transparent: the RBNZ has officially chosen its battle. It views a bloated, inflation-entrenched economy as a far greater threat than a technical recession. Expect aggressive tightening regardless of cooling activity data.
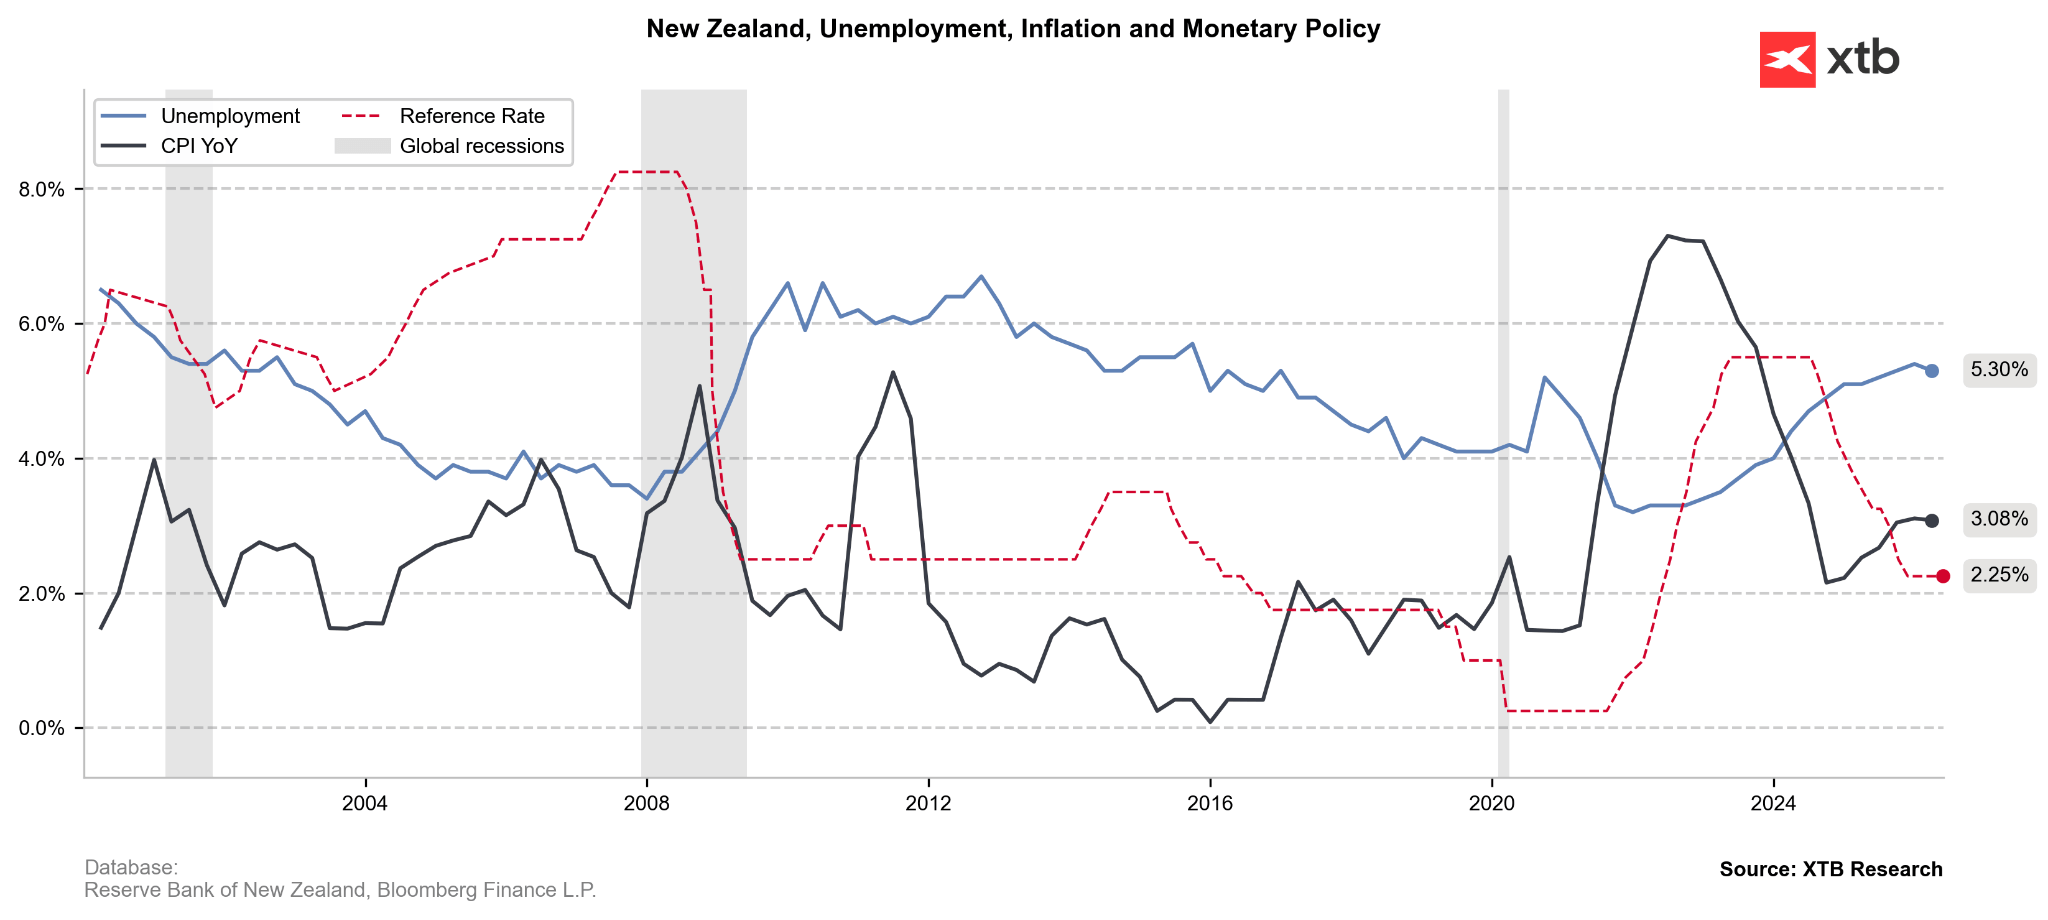
The elevated unemployment (5.3%) rate has been somewhat shielding the NZ’s economy from the risk of wage-induced inflationary spiral. Explicit inflation-focused policy guidance mitigates this dovish argument, justifying the newly discovered strength in NZD. Source: XTB Research The Psychology of Inflation: Unanchored Expectations Perhaps the most alarming component of Breman’s address was the explicit focus on the psychological dynamics of inflation: Expectations of higher costs could themselves become a driver of sustained inflation, creating a self-reinforcing dynamic that monetary policy must move to arrest before it becomes entrenched. — Anna Breman, RBNZ Governor This focus on psychology gives the RBNZ explicit air cover to hike rates even as domestic growth data softens. The hard data supports this anxiety: the latest ANZ-Roy Morgan consumer confidence survey revealed that two-year inflation expectations are sitting at a historically elevated 5.3% in May (down from a record 6.6% in April, but still far too high for central bank comfort)
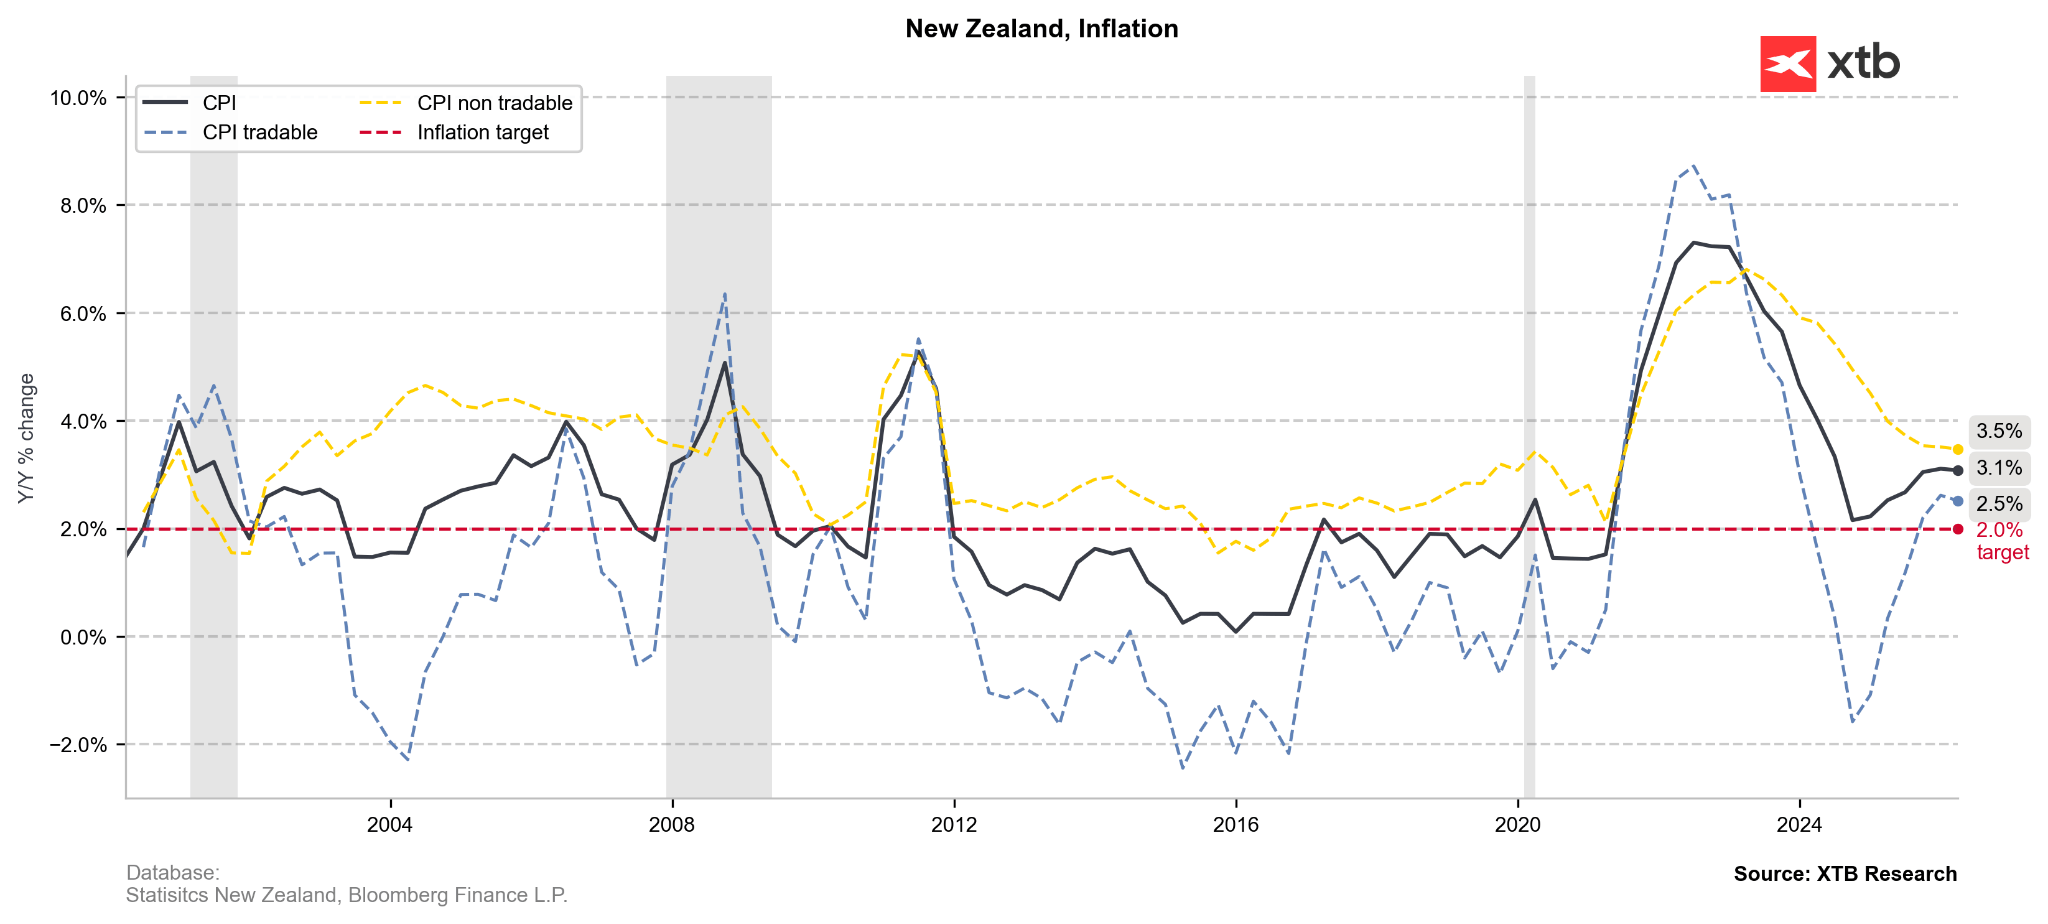
The jump in tradable goods inflation (blue) has mitigated the easing in the non-tradable goods sector, bucking the overall disinflationary process in NZ. With post-war stagflationary pressures, higher commodity prices and NZD-adverse risk sentiment, the hawkish pivot seems like a timely reaction aimed at anchoring inflationary expectations. Source: XTB Research. Laying the Groundwork: The Silk-ANZ Consensus Governor Breman’s Friday remarks represent the final brick in a hawkish wall that RBNZ officials built throughout the week:
- Assistant Governor Karen Silk (Thursday): Confirmed that the central bank’s core bias is firmly tilted toward rate increases at upcoming meetings, explicitly stating that July is a live decision. Crucially, Silk noted that the Fed-adjacent bank does not need to wait for quarterly CPI prints before pulling the trigger, and a swift end to geopolitical tensions will not undo the inflationary damage already baked into the system.
- Institutional Projections: Wall Street and local desks were already positioning for this shift. ANZ Research had previously flagged a sequence of RBNZ rate hikes beginning as early as July, targeting an aggressive return toward a neutral OCR setting of approximately 3%.
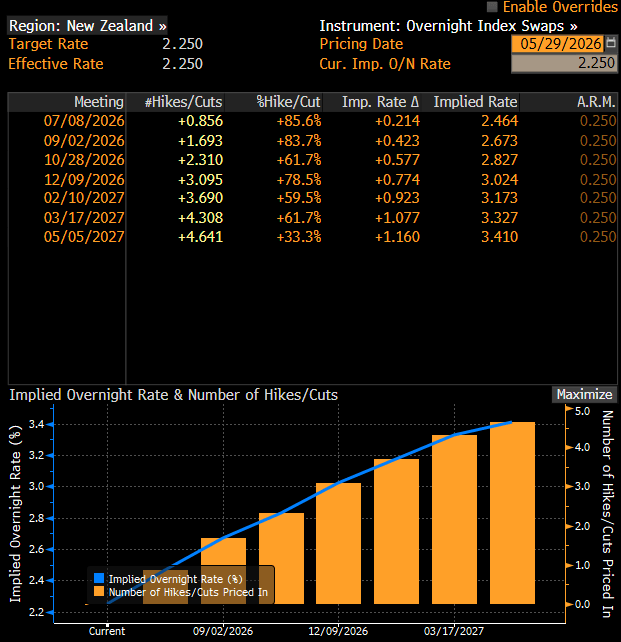
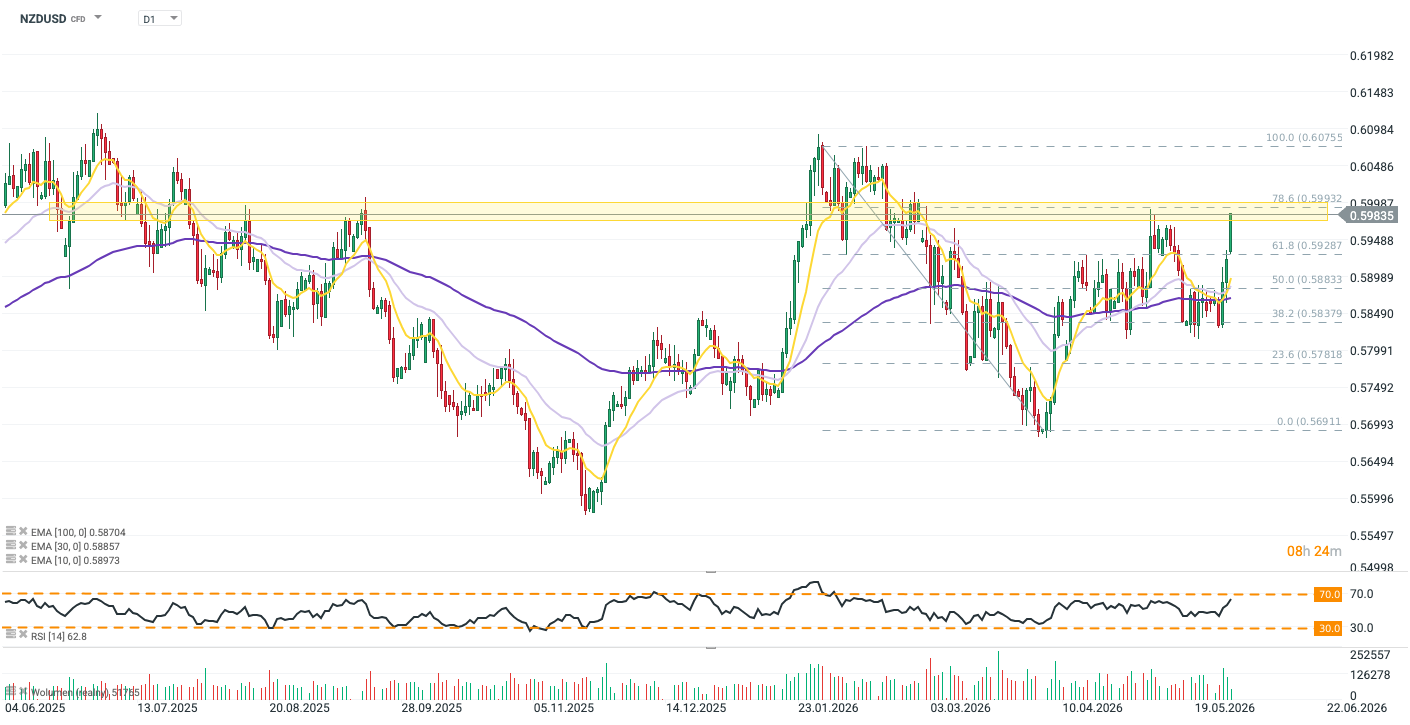
Swap markets are already pricing in three full interest rate hikes in NZ by the end of 2026, which would bring the OCR back to 3%. Source: Bloomberg Finance LP NZDUSD (D1) NZDUSD is testing a crucial historical resistance zone (yellow box) near 0.5980–0.6000, reinforced by the 78.6% Fibonacci retracement level. The dynamic rally triggered by the hawkish RBNZ has pushed price action above the 10, 30, and 100 EMAs, confirming strong bullish momentum. While the RSI at 62.7 reflects dominant buying pressure, it leaves room for further upside. A sustained break above 0.6000 targets prior highs; failure risks a correction back toward the 30 EMA at 0.5885.