

- EUR/USD edges down to near 1.1645 as the US Dollar trades slightly higher.
- This week, major triggers will be the flash Eurozone HICP and the US NFP data for May.
- The removal of Iran’s uranium enrichment remains the key demand by the US for a permanent peace deal.
The EUR/USD pair trades slightly lower to near 1.1645 during the Asian trading session on Monday. The major currency pair faces marginal selling pressure as the US Dollar (USD) ticks up, with investors awaiting key United States (US) economic releases this week, especially the Nonfarm Payrolls (NFP) data for May.
As of writing, the US Dollar Index (DXY), which tracks the Greenback’s value against six major currencies, trades 0.1% higher to near 99.03.
Investors will pay close attention to the US NFP data to get fresh cues on the Federal Reserve’s (Fed) monetary policy outlook. Later in the day, market participants will focus on the US ISM Manufacturing PMI data for May, which will be published at 14:00 GMT.
In the Eurozone, investors await the preliminary Harmonized Index of Consumer Prices (HICP) data for May, which will be released on Tuesday. The inflation data will influence market expectations for the European Central Bank’s (ECB) monetary policy outlook.
On the geopolitical front, negotiations between the US and Iran regarding a permanent peace deal remain ongoing, with Washington hardening its stance on Tehran destroying its uranium dust and giving up its nuclear ambitions.
EUR/USD technical analysis
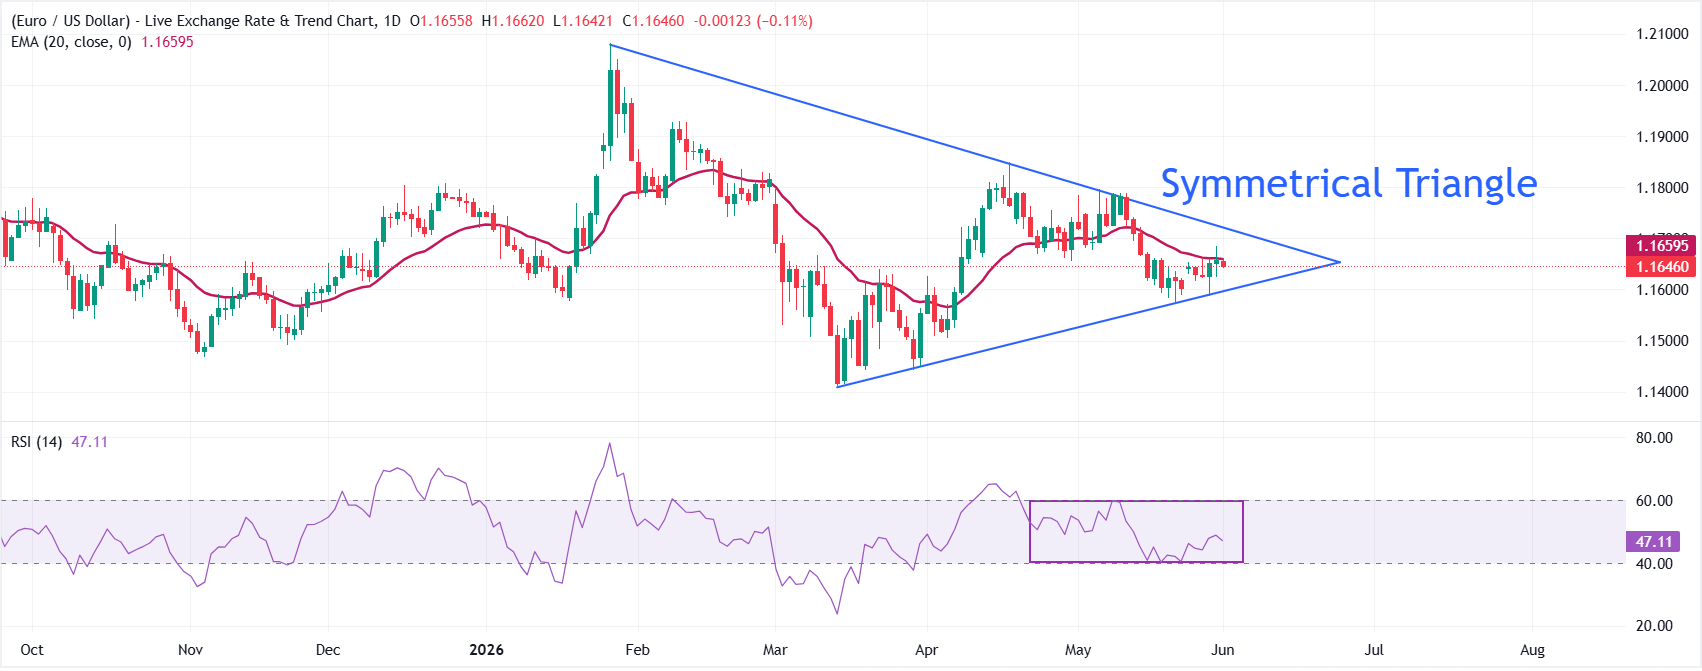
EUR/USD ticks lower at around 1.1645 in the Asian trade. The 20-day Exponential Moving Average (EMA) near 1.1646 acts as a key barrier for the Euro bulls. The pair holds just above the upward-sloping border of the Symmetrical Triangle formation near 1.1599.
The Relative Strength Index (14) has slipped to around 47, suggesting fading bullish momentum and reinforcing the idea of consolidation with a bearish lean rather than a decisive recovery.
On the topside, the 20-day EMA is the immediate resistance, followed by the downward-sloping border of the Triangle formation around 1.1719. On the downside, the first line of defense sits at the former ascending trend-line break at 1.1599; a sustained move below that support would expose a deeper pullback towards 1.1500.
