Japanese Yen falls back against the US Dollar, with the USD/JPY pair rebounding to near 156.55.
Japan’s FM Katayama warned of possible intervention on Thursday.
The Fed is largely expected to keep interest rates at their current levels by the year-end.
The Japanese Yen (JPY) gives up gains recorded in the early European trade against the US Dollar (USD) during the early North American trading session on Friday. The USD/JPY pair rebounds to near 156.55 after sliding to around 155.50, but is still marginally down.
In the early European session, a sudden spike was observed in the Japanese Yen, which was expected to be due to possible Japanese intervention in forex markets. However, there had been no official announcement regarding the same.
A stealth intervention by Japan was highly anticipated as Finance Minister (FM) Satsuki Katayama said on Thursday that they are moving closer to taking decisive action in the foreign exchange markets.
Meanwhile, the upside in the USD/JPY pair is expected to be limited as the US Dollar (USD) is broadly underperforming despite expectations that the Federal Reserve (Fed) will not cut interest rates for the entire year.
US Dollar Price Today
The table below shows the percentage change of US Dollar (USD) against listed major currencies today. US Dollar was the weakest against the Euro.
USD
EUR
GBP
JPY
CAD
AUD
NZD
CHF
USD
-0.16%
-0.08%
-0.05%
-0.11%
0.07%
0.27%
-0.13%
EUR
0.16%
0.08%
0.11%
0.03%
0.25%
0.42%
0.03%
GBP
0.08%
-0.08%
0.02%
-0.03%
0.15%
0.32%
-0.02%
JPY
0.05%
-0.11%
-0.02%
-0.06%
0.12%
0.27%
-0.07%
CAD
0.11%
-0.03%
0.03%
0.06%
0.17%
0.36%
0.00%
AUD
-0.07%
-0.25%
-0.15%
-0.12%
-0.17%
0.18%
-0.16%
NZD
-0.27%
-0.42%
-0.32%
-0.27%
-0.36%
-0.18%
-0.36%
CHF
0.13%
-0.03%
0.02%
0.07%
-0.00%
0.16%
0.36%
The heat map shows percentage changes of major currencies against each other. The base currency is picked from the left column, while the quote currency is picked from the top row. For example, if you pick the US Dollar from the left column and move along the horizontal line to the Japanese Yen, the percentage change displayed in the box will represent USD (base)/JPY (quote).
According to the CME FedWatch tool, the odds of the Fed keeping interest rates unchanged in the current range of 3.50%-3.75% by the year end is 83.6%.
In Friday’s session, investors will focus on the US ISM Manufacturing Purchasing Managers’ Index (PMI) data for April, which will be published at 14:00 GMT. The US ISM Manufacturing PMI is expected to come in higher at 53.0 from 52.7 in March.
MUFG’s Derek Halpenny argues that recent Japanese authorities’ action around the 160 level in USD/JPY likely reflects renewed intervention, with the move seen as buying time for the BoJ and government as they face Middle East uncertainty and domestic cost-of-living concerns. He warns that with yen shorts less extended and global yields rising, USD/JPY could rebound quickly if energy prices or geopolitical risks escalate.
BoJ action seen as time-buying move
“The five-big figure drop in USD/JPY is far too big a move on just rhetoric and the report from the Nikkei that intervention took place points strongly to intervention.”
“What this intervention does is provide some time for the BoJ to assess the uncertainties related to the conflict in the Middle East. There was an understandable reluctance to hike this week due to the lack of clarity and that reluctance coupled with the Fed being more hawkish opened up scope for a de-stabilising yen sell-off, possibly next week when Japan will be on vacation for Golden Week – Monday through Wednesday next week is a Japan holiday.”
“But with yen shorts not as extensive as in past intervention episodes there is a danger that this action does not have a lasting impact. An escalation in the conflict and/or a further rise in energy prices could see USD/JPY rebound quickly.”
“MoF yen-buying intervention in Oct 2022 and July 2024 were successful for a period as the action coincided with or was soon followed by a decline in US yields. At the time of the intervention in Apr/May 2024 US yields did not decline and intervention was required again by July.”
Intervention at 160: Breaking the psychological USDJPY barrier forced Tokyo to act, pushing the rate down to 155 amid low liquidity during Golden Week.
Buying Time: Market interventions provide only temporary relief; a long-term trend reversal requires BoJ rate hikes and a shift in U.S. dollar strength.
Path to 1.0%: Despite the slow pace, high inflation and a weak yen are fueling a hawkish shift within the BoJ, with eyes on a 1.0% rate later in 2026.
Japan has once again found itself at the center of attention in global financial markets. Massive problems related to the energy crisis, high bond yields, prospects of resurgent inflation, and economic slowdown have led to another wave of yen sell-offs. Ultimately, when USDJPY once again broke through the 160 level, a currency intervention most likely took place. Although there has been no direct confirmation yet and we must wait for official, significantly delayed data from the Ministry of Finance, officials are confirming the situation between the lines and announcing a possible further fight against speculators.
A Repeat of the Past: What Happened on April 30th?
The final session of April brought dramatic scenarios. The USDJPY pair once again breached the psychological 160 barrier , triggering an avalanche of orders and forcing Tokyo to act. We quickly observed a strengthening of the yen, and the USDJPY pair dropped to the 155 level. Such a sharp move occurred during a period of low liquidity—the Golden Week in Japan. It is also worth noting that this move coincided with record highs on the June Brent crude oil contract, which also dropped significantly at the moment of the Japanese intervention.
Golden Week is a 7-day period at the turn of April and May, featuring four national holidays. Authorities in Tokyo, led by Atsushi Mimura, sent a clear signal: “Golden Week” will not be a safe haven for speculation.History of Interventions: Is This a Good Time for the Yen? (2022–2024) Japan has a rich, albeit bittersweet history of fighting market trends. Recent history shows that interventions are an effective “emergency brake,” but they rarely change the direction of travel in the long term. It is also worth remembering that there were years when the Ministry of Finance sold the yen due to excessive strength to boost export power.
History of recent interventions:
September/October 2022: The first large-scale market operations in decades conducted at a record-weak yen. The result was approximately a 15% strengthening of the yen against the dollar, a move that lasted about 3 months. USDJPY returned to the October 2022 peaks after about 10 months.
April/May 2024: Action aimed at defending the previous 2022 peaks and the approach to the psychological level of 160 USDJPY. It brought immediate success, and the situation on the currency pair only stabilized longer-term following dovish signals from the U.S. Federal Reserve (Fed).
July 2024: Another strike against speculators, this time supported by hawkish rhetoric from the Bank of Japan. The effect was much more lasting than in previous cases because the intervention was accompanied by an actual interest rate hike by the BoJ. On the other hand, the downward move lasted 2 months and amounted to approximately 13.5% on the USDJPY pair.
What is the conclusion? Intervention alone is only “buying time.” Real change depends on the divergence (or lack thereof) between the policies of the Bank of Japan and the U.S. Federal Reserve.
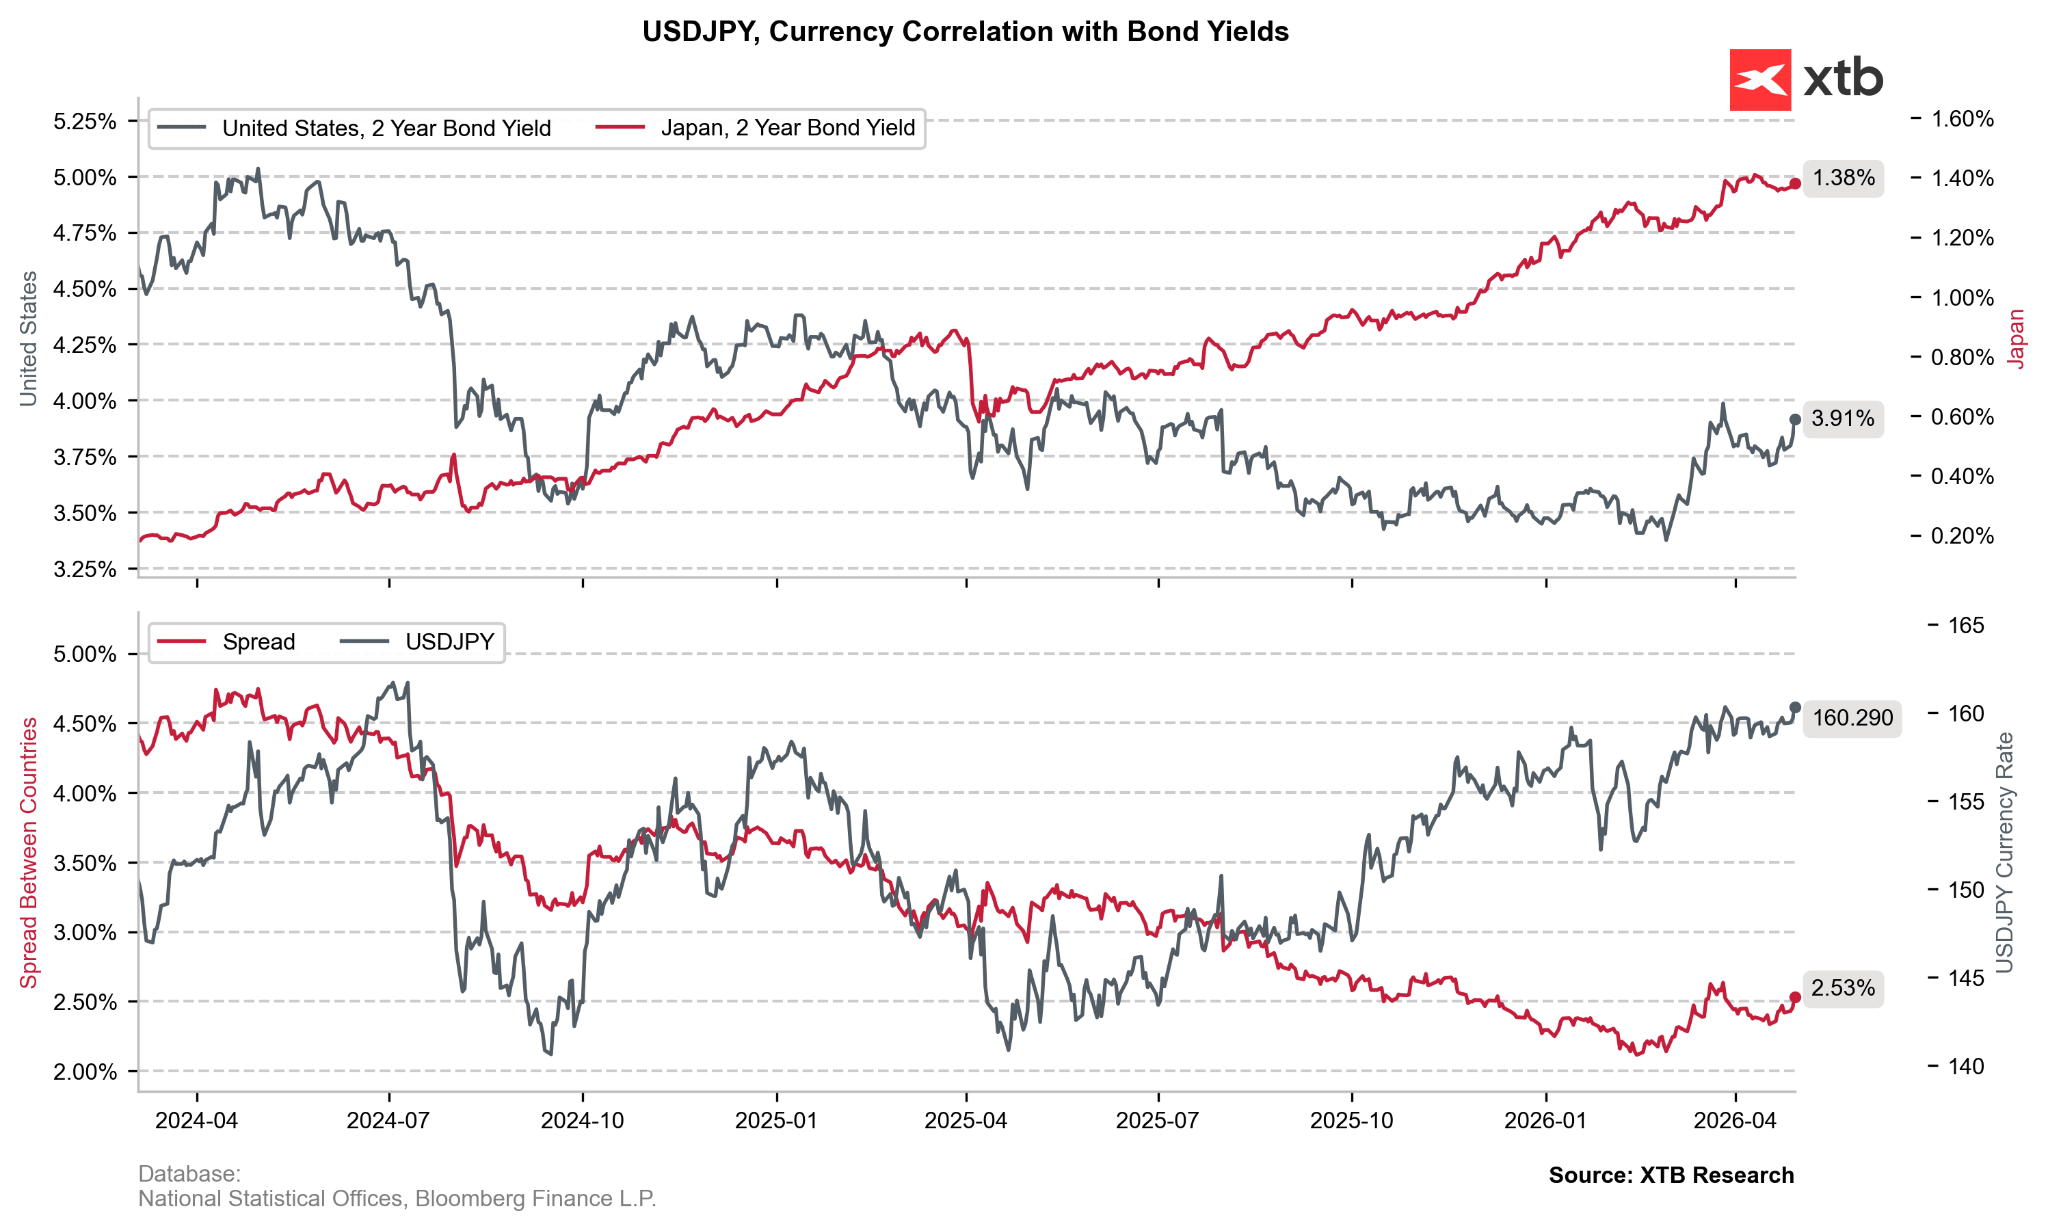
It is worth noting that the spread should have clearly favored the yen for nearly a year now , but the rise in yields in Japan is a result not only of higher interest rates but primarily concerns regarding the massive debt situation and further fiscal expansion plans. Source: Bloomberg Finance LP, XTB
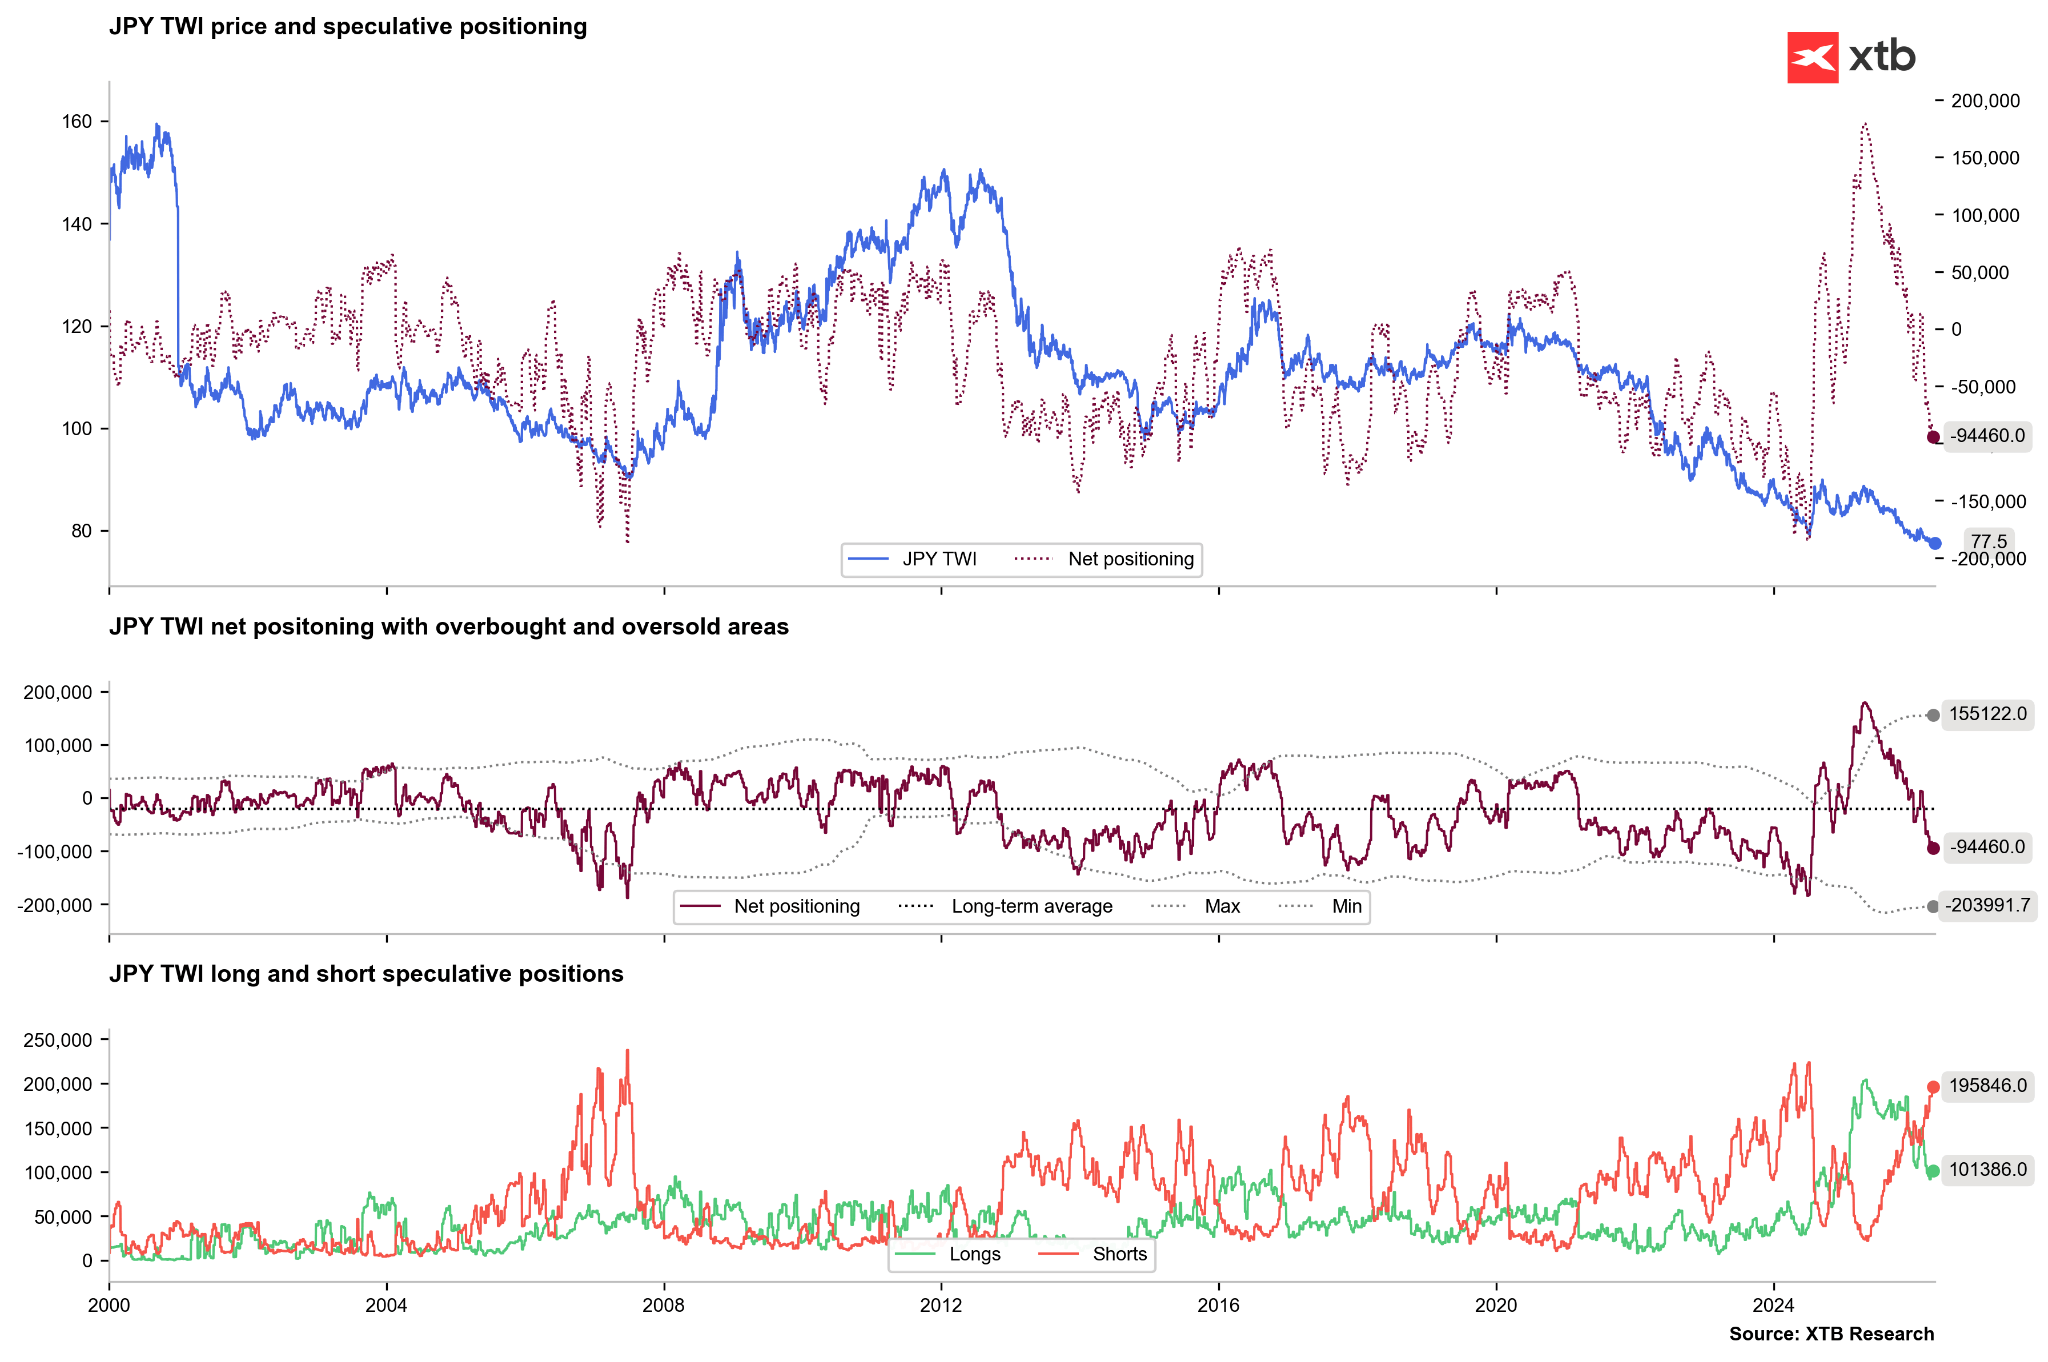
Furthermore, after the previous intervention in 2024, speculators changed their stance and a sharp short-squeeze on the yen began, with the market shifting from a net negative to a positive positioning for the first time since 2016. Currently, however, we are seeing an increase in short positions to almost the extreme high levels of 2024 or 2007. Source: xStation5
Bank of Japan Strategy: An Extremely Slow March Toward Normalization
While the Ministry of Finance fights on the front line with billions of dollars from reserves, the Bank of Japan (BoJ) is conducting an operation to normalize monetary policy after decades of maintaining extremely low interest rates. Nevertheless, due to the state of the Japanese economy, this process is very slow.
Where are we? After the December hike in 2025, the main interest rate in Japan stands at 0.75% —its highest level in three decades, yet still one of the lowest in the world. Japan is still being used for carry trade transactions.
Divisions in the board: Recent meetings have shown a growing hawkish camp. As many as three out of nine board members favor an immediate move to the 1.0% level. This means that the probability of a hike this year is high.
Inflationary pressure: The BoJ forecasts core inflation (core CPI) for 2026 at 2.8%, which, with current rates, means that real interest rates remain deeply negative.
What’s Next for Rates? The base scenario assumes that the BoJ will raise rates to 1.0% still in 2026. The weak yen is a key catalyst here: expensive energy and food imports are draining the wallets of the Japanese people, becoming a political issue that the central bank cannot ignore.
Does the Yen Have a Chance for a Permanent Recovery?
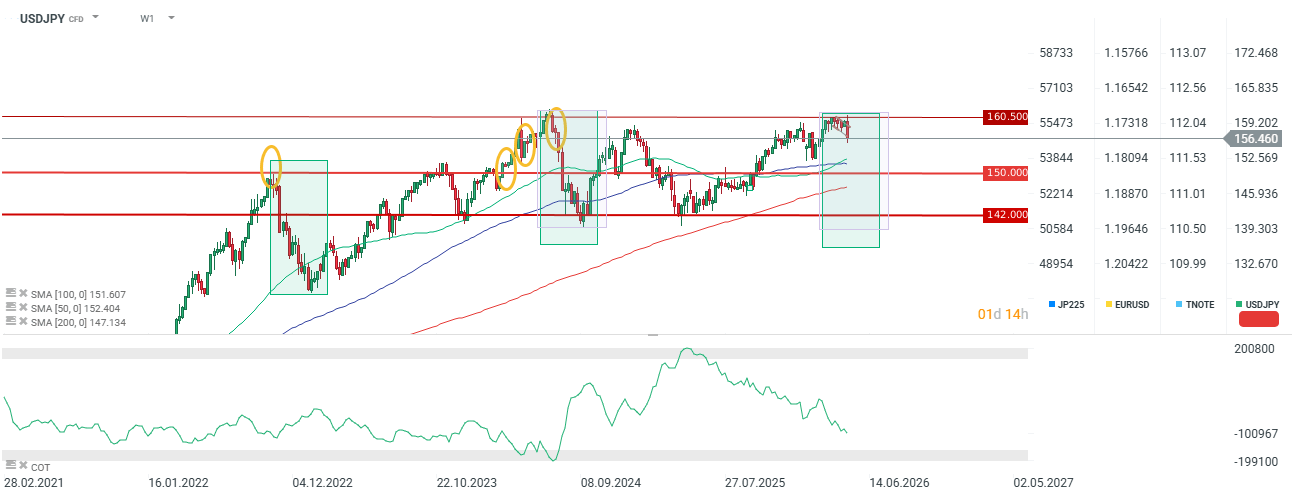
The intervention at the end of April is a clear sign that Tokyo’s threshold of patience lies around the 160 level. However, the fundamentals remain relentless. For the yen to gain value permanently, the market must believe in two factors: a change in BoJ communication to a more hawkish tone , which must be handled cautiously to avoid a crisis in yields; and a change in sentiment regarding the dollar. If the crisis in the Strait of Hormuz ends, the dollar will no longer be as necessary as a safe haven. On the other hand, if the Fed begins to communicate possible hikes, USDJPY could permanently find itself above 160.
The pair is currently in an important area of potential extreme overbought conditions. Interventions would need to be carried out regularly, and additionally, we would need to see a fundamental shift on both the Japanese and global sides. Source: xStation5
USD/JPY moves away from a two-month low following the release of a softer Tokyo CPI print.
A modest USD uptick further supports spot prices, though intervention risks cap the upside.
The mixed technical setup warrants caution before positioning for any further appreciation.
The USD/JPY pair builds on the previous day’s late rebound from the vicinity of mid-155.00s, or over a two-month trough, and gains some positive traction during the Asian session on Friday. Spot prices touched a daily high near the 157.55 region, though the lack of follow-through buying warrants some caution for bullish traders.
The Japanese Yen (JPY) weakens across as softer consumer inflation figures from Tokyo – Japan’s capital city – give the Bank of Japan (BoJ) reasons to pause amid economic concerns due to Middle East tensions. Apart from this, a modest US Dollar (USD) uptick turns out to be another factor offering support to the USD/JPY pair. Meanwhile, Japan’s top foreign exchange diplomat, Atsushi Mimura, reiterated that officials are in close contact with the US on currency. This keeps intervention risks in play and limits JPY losses, capping the currency pair.
From a technical perspective, Thursday’s steep intraday decline from the 160.75 area, or the highest level since July 2024, stalled near the 61.8% Fibonacci retracement level of the February-April upswing. Moreover, the USD/JPY pair, so far, has held above the 200-day Exponential Moving Average (EMA), which, in turn, keeps bearish traders on the back foot. However, a softening Relative Strength Index (RSI) near 40, alongside a negative Moving Average Convergence Divergence (MACD) reading below zero, suggests downside pressure persists.
Hence, recovery attempts are likely to face supply on further rise towards initial resistance at the 38.2% retracement near 157.48. That said, a sustained strength beyond would expose the 23.6% retracement at 158.73 and then the 160.75 cycle high.
On the downside, immediate support emerges at the 50.0% retracement near 156.47, followed by the 61.8% retracement at 155.47 and the 200-day EMA at 155.21. A clear loss of this area would open the way toward deeper Fibonacci support at 154.03 and the 152.20 swing low.
(The technical analysis of this story was written with the help of an AI tool.)
USD/JPY daily chart
Japanese Yen Price Today
The table below shows the percentage change of Japanese Yen (JPY) against listed major currencies today. Japanese Yen was the strongest against the New Zealand Dollar.
USD
EUR
GBP
JPY
CAD
AUD
NZD
CHF
USD
0.03%
0.05%
0.39%
0.03%
0.13%
0.24%
0.07%
EUR
-0.03%
0.00%
0.37%
-0.02%
0.11%
0.20%
0.04%
GBP
-0.05%
-0.01%
0.34%
0.00%
0.08%
0.18%
0.05%
JPY
-0.39%
-0.37%
-0.34%
-0.36%
-0.27%
-0.18%
-0.31%
CAD
-0.03%
0.02%
0.00%
0.36%
0.09%
0.21%
0.05%
AUD
-0.13%
-0.11%
-0.08%
0.27%
-0.09%
0.11%
-0.02%
NZD
-0.24%
-0.20%
-0.18%
0.18%
-0.21%
-0.11%
-0.15%
CHF
-0.07%
-0.04%
-0.05%
0.31%
-0.05%
0.02%
0.15%
The heat map shows percentage changes of major currencies against each other. The base currency is picked from the left column, while the quote currency is picked from the top row. For example, if you pick the Japanese Yen from the left column and move along the horizontal line to the US Dollar, the percentage change displayed in the box will represent JPY (base)/USD (quote).
EUR/JPY rises as the Japanese Yen weakens after mixed Tokyo inflation data.
Tokyo CPI rose 1.5% YoY in April; core CPI also 1.5%, missing the 1.8% forecast.
The ECB kept the deposit rate at 2% despite rising Eurozone inflation driven by the Iran conflict.
EUR/JPY gains ground after registering 1.88% losses in the previous day, trading around 184.40 during the Asian hours on Friday. The currency cross advances as the Japanese Yen (JPY) weakens following mixed Tokyo inflation data.
Japan’s Statistics Bureau reported Friday that Tokyo’s headline Consumer Price Index (CPI) rose 1.5% year-over-year (YoY) in April, up from 1.4% prior. Core CPI (excluding fresh food) also increased 1.5% YoY, missing the 1.8% forecast and down from 1.7% previously. Meanwhile, CPI excluding fresh food and energy eased to 1.5% from 1.7%.
The JPY found some support against major peers after suspected intervention by Tokyo, which came hours after officials issued a “final” warning against excessive currency selling. Although the Finance Ministry has not confirmed action, the sharp market move led traders to attribute it to government support. Investors are now weighing the chances of further intervention, as authorities often act in multiple rounds.
Japan’s top FX official, Vice Finance Minister for International Affairs Atsushi Mimura, declined to comment on intervention or crude oil futures, but noted ongoing close communication with the US on currency matters.
The Euro (EUR) also gains support after the European Central Bank (ECB) left interest rates unchanged at its April meeting. The governing council kept the deposit rate at 2% despite rising Eurozone inflation amid the Iran conflict, stating that while the outlook remains broadly unchanged, upside risks to inflation and downside risks to growth have increased.
GBP/JPY rises to near 214.00 as the Japanese Yen surrenders some gains driven by Japan’s intervention.
Tokyo CPI ex. Fresh Food growth cooled down to 1.5% YoY in April.
BoE’s Bailey clarifies that the central bank will act if it finds there might be second-round effects of inflation.
The GBP/JPY pair is up 0.35% at around 214.00 during the Asian trading session on Friday. The pair trades higher as the Japanese Yen (JPY) surrenders a majority of its Thursday’s gains, which were driven by Japan’s intervention in forex markets to counter one-way speculative moves against the domestic currency.
Japanese Yen Price Today
The table below shows the percentage change of Japanese Yen (JPY) against listed major currencies today. Japanese Yen was the weakest against the US Dollar.
USD
EUR
GBP
JPY
CAD
AUD
NZD
CHF
USD
0.02%
0.03%
0.35%
0.00%
0.13%
0.22%
0.03%
EUR
-0.02%
0.00%
0.31%
-0.04%
0.11%
0.18%
0.00%
GBP
-0.03%
-0.00%
0.30%
-0.03%
0.09%
0.17%
0.02%
JPY
-0.35%
-0.31%
-0.30%
-0.33%
-0.22%
-0.16%
-0.31%
CAD
-0.01%
0.04%
0.03%
0.33%
0.11%
0.20%
0.04%
AUD
-0.13%
-0.11%
-0.09%
0.22%
-0.11%
0.08%
-0.06%
NZD
-0.22%
-0.18%
-0.17%
0.16%
-0.20%
-0.08%
-0.15%
CHF
-0.03%
-0.00%
-0.02%
0.31%
-0.04%
0.06%
0.15%
The heat map shows percentage changes of major currencies against each other. The base currency is picked from the left column, while the quote currency is picked from the top row. For example, if you pick the Japanese Yen from the left column and move along the horizontal line to the US Dollar, the percentage change displayed in the box will represent JPY (base)/USD (quote).
According to a report from Reuters, Japan intervened to prop up the JPY against the US Dollar (USD) on Thursday, its first official currency action in nearly two years.
Japan Finance Minister (FM) Satsuki Katayama also said on Thursday that they are moving closer to taking decisive action in the foreign exchange markets.
Meanwhile, Tokyo’s Consumer Price Index (CPI) ex. Fresh Food data for April has come in lower than expected. The underlying inflation growth cooled down to 1.5% Year-on-Year (YoY) from 1.7% in March, while it was expected to arrive higher at 1.8%.
In the Asian trade, the Pound Sterling (GBP) trades higher against its major currency peers, except the Canadian Dollar (CAD), as the Bank of England (BoE) has opened the room for an interest rate hike if the energy supply shock continues to persist.
On Thursday, the BoE left interest rates unchanged at 3.75%, as expected, and Governor Andrew Bailey warned that second-round effects of energy crisis-led inflation could arise, but the central bank would not wait and act early. “It would be a mistake to wait to see the second-round effects before acting because then it would be too late,” Bailey said in the press conference, Reuters reported.
EUR/JPY gives back recent gains and comes under pressure around 183.60.
ECB keeps rates unchanged and highlights rising uncertainty on inflation and growth.
Japan strengthens its intervention rhetoric, supporting the Japanese Yen.
EUR/JPY declines and trades around 183.60 at the time of writing, after hitting two-week highs above 187.50, amid mixed pressures from European monetary policy and rising intervention risks in Japan.
The European Central Bank (ECB) leaves its key interest rates unchanged at its April meeting, as expected, with the main refinancing rate at 2.15%, the marginal lending facility at 2.4% and the deposit facility at 2%. The central bank notes that incoming data has been broadly in line with its expectations, but warns that upside risks to inflation and downside risks to growth have intensified, particularly due to rising energy prices linked to geopolitical tensions in the Middle East.
The ECB emphasizes a data-dependent, meeting-by-meeting approach and reiterates that it is not pre-committing to any specific rate path. It also highlights that long-term inflation expectations remain well anchored, although short-term expectations have increased significantly.
On the Japanese side, pressure builds on the Japanese Yen (JPY) following firm comments from Finance Minister Satsuki Katayama, who signals that the time for decisive action in the foreign exchange market is approaching. These remarks come as USD/JPY moved above the key 160.00 level, reviving speculation about potential intervention by Japanese authorities to support the currency.
At the same time, rising Oil prices, driven by tensions in the Middle East, weigh on Japan’s economic outlook as a major energy importer, limiting the JPY’s upside despite intervention warnings.
In the Eurozone, macroeconomic data sends mixed signals. Germany’s Gross Domestic Product (GDP) expanded by 0.3% in the first quarter, beating expectations, but the Unemployment Rate rose to 6.4%, pointing to ongoing labor market fragility. Meanwhile, inflation in the Eurozone accelerated, with the Harmonized Index of Consumer Prices (HICP) increasing by 3% YoY in April, above forecasts.
Market focus now shifts to the press conference of ECB President Christine Lagarde for further guidance on the future path of monetary policy.
Euro Price Today
The table below shows the percentage change of Euro (EUR) against listed major currencies today. Euro was the strongest against the US Dollar.
USD
EUR
GBP
JPY
CAD
AUD
NZD
CHF
USD
-0.13%
-0.25%
-2.21%
-0.09%
-0.48%
-0.61%
-0.89%
EUR
0.13%
-0.09%
-2.04%
0.03%
-0.33%
-0.48%
-0.73%
GBP
0.25%
0.09%
-1.93%
0.13%
-0.23%
-0.37%
-0.64%
JPY
2.21%
2.04%
1.93%
2.13%
1.75%
1.55%
1.30%
CAD
0.09%
-0.03%
-0.13%
-2.13%
-0.39%
-0.56%
-0.80%
AUD
0.48%
0.33%
0.23%
-1.75%
0.39%
-0.14%
-0.39%
NZD
0.61%
0.48%
0.37%
-1.55%
0.56%
0.14%
-0.25%
CHF
0.89%
0.73%
0.64%
-1.30%
0.80%
0.39%
0.25%
The heat map shows percentage changes of major currencies against each other. The base currency is picked from the left column, while the quote currency is picked from the top row. For example, if you pick the Euro from the left column and move along the horizontal line to the US Dollar, the percentage change displayed in the box will represent EUR (base)/USD (quote).
(This story was corrected at 13:05 GMT to say that EUR/JPY was trading around 183.60, not 186.60)
EUR/JPY retreats to 186.20 from two-week highs above 187.50, turns negative on the day.
Japanese Finance Minister Katayama said that “the time for decisive action” is near.
German GDP beat expectations in Q1, but unemployment rose unexpectedly.
The Euro (EUR) has pulled back form two week highs above 187.50 against the Japanese Yen (JPY) on Thursday, retreating to 186.20 at the time of writing, as Japanese Finance Minister Satsuki Katayama launched a clear intervention warning.
Katayama affirmed on Thursday that the “timing for decisive action is near” and that Japanese authorities are getting closer to stepping into the FX markets. These comments arrive after the USD/JPY crossed the key 160.00 level, considered a line in the sand for Tokyo.
The JPY was showing the weakest performance among the G8 currencies on Thursday. The latest jump in Oil prices and the prospect of an extended blockade in the Strait of Hormuz have reactivated concerns about the consequences for the Crude-importing Japanese economy, offsetting the hawkish tone of the Bank of Japan’s (BoJ) recent monetary policy meeting.
In Europe, German jobless figures in March disappointed. The unemployment rate rose to 6.4%, against the market consensus of a steady 6.3% rate from February. Data from Destatis revealed that the number of jobless workers increased by 20K, exceeding the 4K forecasted by market analysts and keeping the total unemployment figure beyond 3 million.
These figures offset the 0.3% increase of the first quarter’s Gross Domestic Product (GDP), which beat expectations of a slight slowdown to 0.2%, following another 0.3% quarterly gain in the last three months of last year.
In the Eurozone, inflation figures have confirmed the higher inflationary pressures stemming from the Middle East conflict. The Eurozone preliminary Harmonized Index of Consumer Prices (HICP) has risen 1% in April, following a 1.3% increase in March. Moreover, the HICP rose 3% YoY, from 2.6% in March, and exceeded market expectations of 2.9%.
The focus now shifts to the European Central Bank (ECB), which will disclose the outcome of its last monetary policy meeting. The bank is likely to keep its benchmark interest rate on hold, but hint at rate hikes in the near term, pressured by the rising prices.
To provide the best experiences, we use technologies like cookies to store and/or access device information. Consenting to these technologies will allow us to process data such as browsing behavior or unique IDs on this site. Not consenting or withdrawing consent, may adversely affect certain features and functions.
Functional
Always active
The technical storage or access is strictly necessary for the legitimate purpose of enabling the use of a specific service explicitly requested by the subscriber or user, or for the sole purpose of carrying out the transmission of a communication over an electronic communications network.
Preferences
The technical storage or access is necessary for the legitimate purpose of storing preferences that are not requested by the subscriber or user.
Statistics
The technical storage or access that is used exclusively for statistical purposes.The technical storage or access that is used exclusively for anonymous statistical purposes. Without a subpoena, voluntary compliance on the part of your Internet Service Provider, or additional records from a third party, information stored or retrieved for this purpose alone cannot usually be used to identify you.
Marketing
The technical storage or access is required to create user profiles to send advertising, or to track the user on a website or across several websites for similar marketing purposes.