

- USD/JPY consolidates around 161.60 as hawkish BoJ supporting Japanese Yen counters outperforming the US Dollar.
- One BoJ member expects interest rates to rise to 2% as soon as possible.
- BoJ’s Asada, PM Takaichi appointee, voted against the interest rate hike in the policy meeting this month.
The USD/JPY pair trades in a limited range around 161.60 during the European trading session on Wednesday. The pair consolidates as hawkish Bank of Japan (BoJ) bets are supporting the Japanese Yen (JPY) against the US Dollar’s (USD) continued outperformance.
Earlier in the day, the BoJ Summary of Opinions (SoP) of the June meeting showed that a majority of officials favor more interest rate hikes to counter mounting inflation risks. Also, one board member said Japan’s policy rate must be brought closer to the estimated neutral rate of around 2% as soon as possible.
The BoJ SoP also showed that new board member, Toichiro Asada, the appointee of Prime Minister (PM) Sanae Takaichi, voted against the hike, citing downside inflation and employment risks due to the Middle East crisis. In the policy meeting, the BoJ lifted interest rates by 25 basis points (bps) to 1%.
Meanwhile, a Reuters report shows that the BoJ is almost certain to deliver another interest rate hike this year in December.
At press time, the US Dollar Index (DXY), which tracks the Greenback’s value against six major currencies, trades 0.1% higher to near 101.50, the highest level seen in over a year.
USD/JPY technical analysis
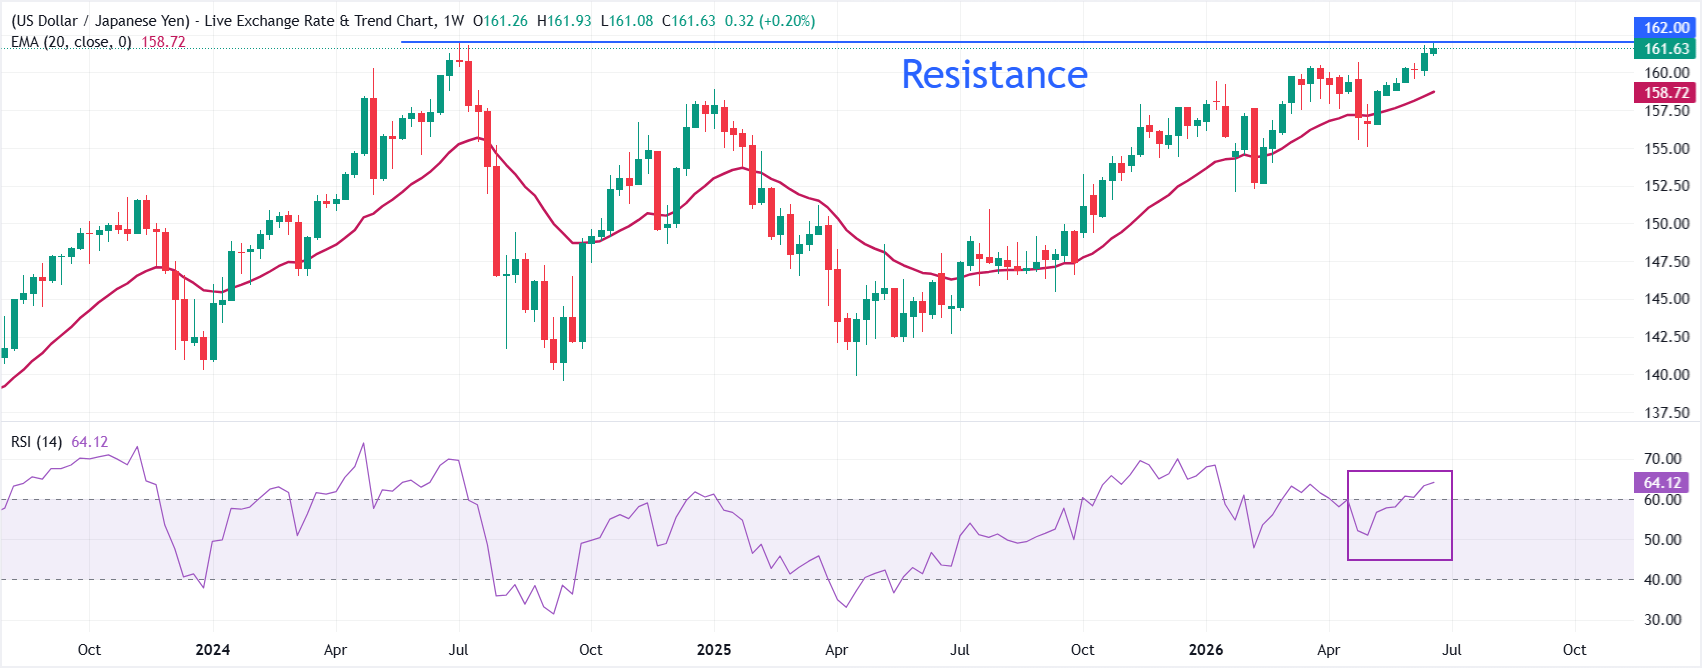
USD/JPY trades flat at around 161.65 at press time. The pair maintains a bullish near-term bias as price holds well above the 20-week exponential moving average (EMA) at 158.72, keeping the broader uptrend intact.
Weekly Relative Strength Index (RSI) at 64.11 stays in positive territory but below overbought levels, suggesting strong yet not extreme upside momentum.
On the downside, immediate support is seen at the round-level 160.00, followed by the 20-week EMA at 158.72. On the upside, the pair would enter uncharted territory if it breaks above the all-time high around 162.00.

